
U.S. Solar Market Grows 76% in 2012; Now an Increasingly-Competitive Energy Source for Millions of Americans Today
WASHINGTON, DC and BOSTON, MA – GTM Research and the Solar Energy Industries Association® (SEIA®) today released U.S. Solar Market Insight: Year-in-Review 2012, the definitive analysis of solar power markets in the U.S.
With another record-breaking year, solar is the fastest growing energy source in the U.S., powering homes, businesses and utility grids across the nation. The Solar Market Insight annual edition shows the U.S. installed 3,313 megawatts (MW) of solar photovoltaics (PV) in 2012, a record for the industry. Perhaps most importantly, clean, reliable, affordable solar is continuing a major growth pattern that has made it a leading source of new electricity for America that’s increasingly competitive with conventional electricity across dozens of states today.
Even with the cost of solar falling for consumers, the market size of the U.S. solar industry grew 34 percent from $8.6 billion in 2011 to $11.5 billion in 2012—not counting billions of dollars in other economic benefits across states and communities. As of the end of 2012, there were 7,221 MW of PV and 546 MW of concentrating solar power (CSP) online in the U.S. — enough to power 1.2 million homes.
At the state level, 2012 was another year for breaking records. California became the first state to install over 1,000 MW in one year, with growth across all market segments. Arizona came in as the second largest market, led by large-scale utility installations, while New Jersey experienced growth in the state’s non-residential market. The top 10 largest state solar markets in 2012 were:
1. California – 1,033
2. Arizona – 710
3. New Jersey – 415
4. Nevada – 198
5. North Carolina – 132
6. Massachusetts – 129
7. Hawaii – 109
8. Maryland – 74
9. Texas – 64
10. New York – 60
MW of PV installed during 2012
FIGURE: U.S. PV Installations and Weighted Average Installed Price 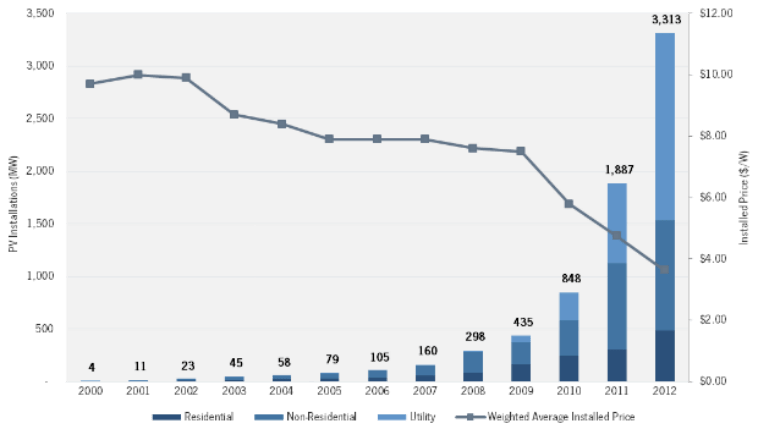
Source: U.S. Solar Market Insight: Year-in-Review 2012
In addition to record annual installations, the fourth quarter (Q4) of 2012 shattered all-time quarterly records as well, with 1,300 MW of installed PV, besting the previous high by a whopping 64 percent. The residential and utility segments had their best quarters ever, installing 144 MW and 874 MW respectively.
“2012 was a busy year in the U.S. solar market,” said Shayle Kann, vice president at GTM Research. “The market value of U.S. solar installations reached $11.5 billion in 2012, up from just $3.6 billion in 2009. Amidst this boom, the industry faced newly-imposed import tariffs on Chinese solar cells and ongoing consolidation in the manufacturing space. In 2013, we expect another strong year, driven in part by new mechanisms to increase the availability, and lower the cost, of solar project financing.”
The residential market saw meaningful growth in California, Arizona, Hawaii, Massachusetts, and New York, as average residential system prices dropped nearly 20 percent in one year – from $6.16 per watt in Q4 2011 to $5.04 per watt in Q4 2012. SEIA and GTM Research expect residential solar to surge in 2013 and beyond, as third-party solar financing options spread across the country.
The non-residential segment, which includes commercial, governmental, and non-profit systems, installed more than 1,000 MW in 2012. Leading non-residential markets included California, New Jersey, Arizona, Massachusetts, and Hawaii.
Meanwhile, the utility market continues to be dominated by installations in the desert southwest. There were 152 utility solar installations in 2012, and eight of the ten largest projects currently in operation were completed in 2012. These installations represented 54% of total installed capacity, or 1,782 MW.
“There were 16 million solar panels installed in the U.S. last year – more than 2 panels per second of the work day – and every one of these panels was bolted down by a member of the U.S. workforce,” said Rhone Resch, president and CEO of SEIA. “We’ve brought more new solar online in 2012 than in the three prior years combined. This sustained growth is enabling the solar industry to create thousands of good jobs and to provide clean, affordable energy for more families, businesses, utilities, and the military than ever before. This growth simply would not have occurred without consistent, long-term policies that have helped to ensure a stable business environment for this country’s 5,600 solar companies – many of them small businesses.”
SEIA and GTM Research expect the growth to continue into 2013 and beyond. For this year, the report forecasts 4,300 MW of new PV installations, up 29 percent over 2012, and 946 MW of concentrating solar power. Over the next four years, the residential and non-residential markets are expected to gain market share as system prices decline, the industry becomes even more efficient, and new financing channels arise. “All of these data point to solar having turned the corner,” added Resch. “Solar is an affordable option for homes and businesses today, and is well on its way to becoming a substantial part of America’s energy portfolio.”
Key Report Findings
- PV installations grew 76% in 2012 to reach 3,313 MW
- There are now more than 300,000 PV systems operating across the U.S.
- The U.S. installed 11% of all global PV in 2012, the highest market share in at least fifteen years
- Cumulative PV capacity operating in the U.S. as of the end of 2012 stood at 7,221 MW and cumulative operating concentrating solar stood at 546 MW
- Twelve states installed over 50 MW of solar each in 2012, up from eight in 2011
- There were over 90,000 solar installations in 2012, including 83,000 in the residential market alone
- The non-residential segment, which includes commercial, governmental, and non-profit systems, installed more than 1,000 MW in 2012. Leading non-residential markets included California, New Jersey, Arizona, Massachusetts, and Hawaii.
- Weighted average PV system prices fell 27% in 2012, reaching $5.04/W in the residential market, $4.27/W in the non-residential market, and $2.27/W in the utility market
FIGURE: U.S. PV Installation Map, 2012
Source: U.S. Solar Market Insight: Year-in-Review 2012
More Resources:
- Sign-up for our Google Hangout: The State of the Solar Industry, featuring SEIA CEO Rhone Resch at 11:00am ET on Thursday, March 14.
- U.S. Solar Market Insight: Year-in-Review 2012: executive summary, factsheet, infographic here
- Click here to purchase the full report, including 2013 state solar forecasts
About U.S. Solar Market Insight:
The U.S. Solar Market Insight: Year-in-Review 2012 report is the most detailed and timely research available on the continuing growth and opportunity in the U.S. The report includes deep analysis of solar markets, technologies and pricing, identifying the key metrics that will help solar decision-makers navigate the market’s current and forecasted trajectory.
About GTM Research:
GTM Research, a division of Greentech Media, provides critical and timely market analysis in the form of research reports, data services, advisory services and strategic consulting. GTM Research’s analysis also underpins Greentech Media’s webinars and live events. Our coverage spans the green energy industry including solar power, smart grid, energy storage, energy efficiency and wind power sectors. www.gtmresearch.com
About SEIA®:
Established in 1974, the Solar Energy Industries Association® is the national trade association of the U.S. solar energy industry. Through advocacy and education, SEIA and its 1,000 member companies are building a strong solar industry to power America. As the voice of the industry, SEIA works to make solar a mainstream and significant energy source by expanding markets, removing market barriers, strengthening the industry and educating the public on the benefits of solar energy. www.seia.org
Media Contacts:
Jamie Nolan, SEIA Press Officer: 202.556.2886, [email protected]
Nicholas Rinaldi, GTM Research, Senior Marketing Manager: 347.725.3510, [email protected]
Shayle Kann, GTM Research, Vice President: 617.500.4216, [email protected]
learn more
Receive SEIA's Latest Press Releases

