Solar Market Insight Report 2012 Q3
Purchase the full report | Press Release | Press Resources | Fact Sheet | Archived Webinar
The quarterly SEIA/GTM Research U.S. Solar Market Insight™ report shows the major trends in the U.S. solar industry. Learn more about the U.S. Solar Market Insight Report.
1. Introduction
Despite some manufacturing plant closures and capacity reductions, the global solar industry remains in a state of heavy oversupply as the end of 2012 approaches. PV module manufacturing capacity will stand at roughly 70 GW[1] at year’s end, while global demand is estimated at 31 GW. These manufacturing woes have coincided with (and, to an extent, fueled) booming solar demand in the U.S., where domestic PV installations more than doubled in 2010 and again in 2011. In 2012, we forecast a growth rate of 70 percent – still much higher than the 14 percent rate of expected global market growth.
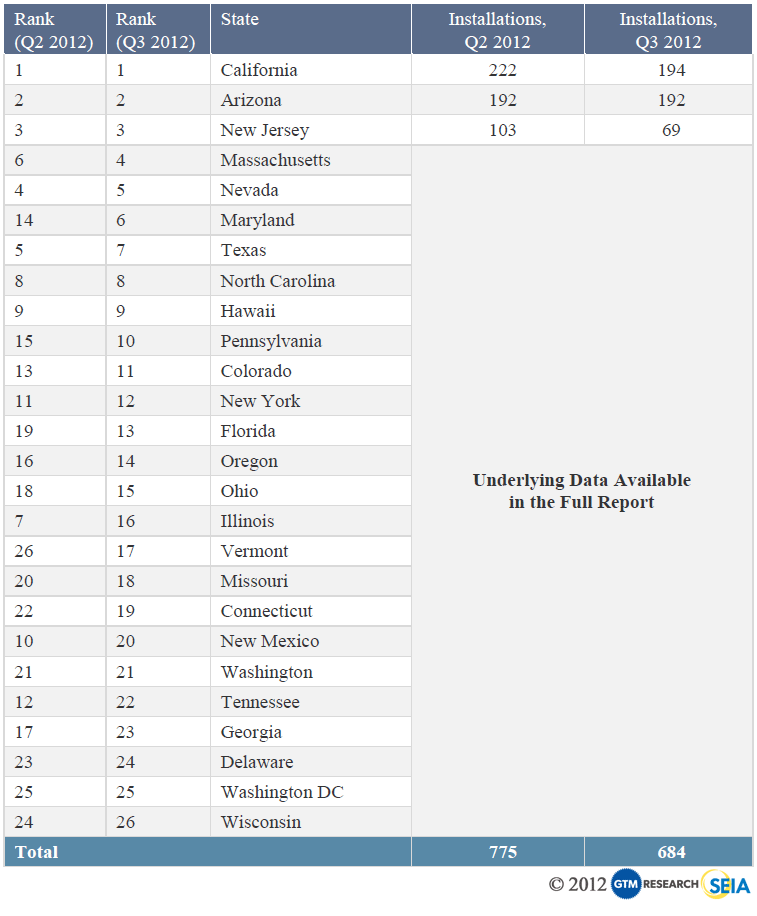
As the numbers throughout this report show, the U.S. solar market is still booming. Residential and commercial installations were strong in the third quarter of 2012, and many large utility solar projects are expected to come online in the fourth quarter. Still, the picture is not entirely rosy for all downstream players in the U.S. A number of currently expanding markets (e.g. Massachusetts) are headed for a downturn in 2013, while other historically booming markets (e.g. New Jersey) are midway through a correction period. Successful installers, developers, and EPCs will be able to navigate the choppy waters of these markets, but success will require a deep understanding of near-term market dynamics and other unique requirements needed to play in each territory.
GTM Research forecasts that 3.2 GW of PV will be installed in 2012, up from 1.9 GW in 2011. Given this growth, U.S. share of global installations will rise to over 10% from 7% in 2011 and less than 5% in 2010. GTM Research also expects that at least 21 individual states will install over 10 MW of PV in 2012, up from only four in 2008.
KEY FINDINGS
Photovoltaics (PV)
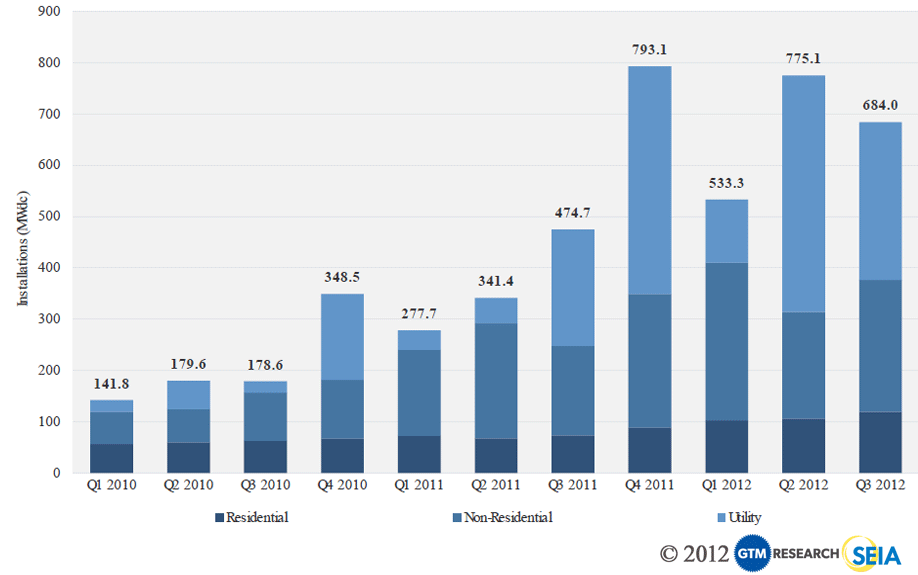
- PV installations totaled 684 MW in Q3 2012, up 44% over Q3 2011[2]
- The residential market grew 12% over Q2 2012 and had its largest quarter in history
- The non-residential market grew 24% over Q2 2012, thanks primarily to growth in California and Massachusetts
- There is now a total of 5.9 GW of PV operating in the U.S. from over 271,000 installations
- We expect record installations in Q4, leading to 70% annual installation growth in 2012 on 3.2 GW installed
Concentrating Solar Power (CSP and CPV)
- All phases of BrightSource’s Ivanpah project are expected to come online in 2013
- Abengoa’s Solana Generating Station is over 75% complete and expected to be online in summer 2013
- SolarReserve continues PPA discussions with Tri-State and Xcel for its 200 MWac Saguache project in Colorado
- The California Public Utilities Commission (CPUC) unanimously approved an amended PPA for BrightSource’s Sonoran West project
Figure 1.1 Q3 2012 State PV Installation Rankings
2. Photovoltaics (PV)
Photovoltaics (PV), which convert sunlight directly to electricity, continue to be the largest component of solar market growth in the U.S.
2.1. Installations
The U.S. installed 684 MW in Q3 2012. This represents a 12% decline from Q2 2012 but 44% growth over Q3 2011. As always, it is important to take the utility market out of the equation when seeking meaningful conclusions within quarterly installation figures, as the utility market is simply too volatile and dependent on individual projects. In this context, Q3 was quite strong, with 20% quarter-over-quarter growth in the distributed generation (DG) market. Both the residential and non-residential markets grew over Q2 in more than half the states we track.
Through the first three quarters of the year, the U.S. installed a total of 1,992 MW – more than the 2011 annual figure. Still, in order for the market to reach the 3.2 GW we forecast for the year, the fourth quarter will have to be, relatively speaking, enormous. For context, the largest quarter in the history of the U.S. market was Q4 2011, during which 792 MW of PV were installed. Meanwhile, our forecast calls for 1,202 MW to be installed in the fourth quarter of this year.
Note: Historical and forecasted installation figures by state and by market segment, as well as state-by-state market analysis, are available in the full report. |
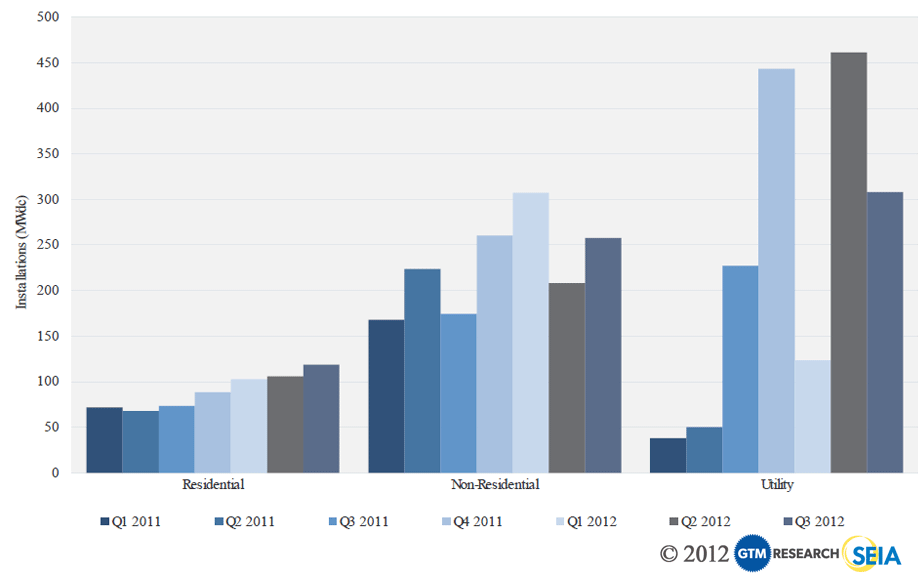
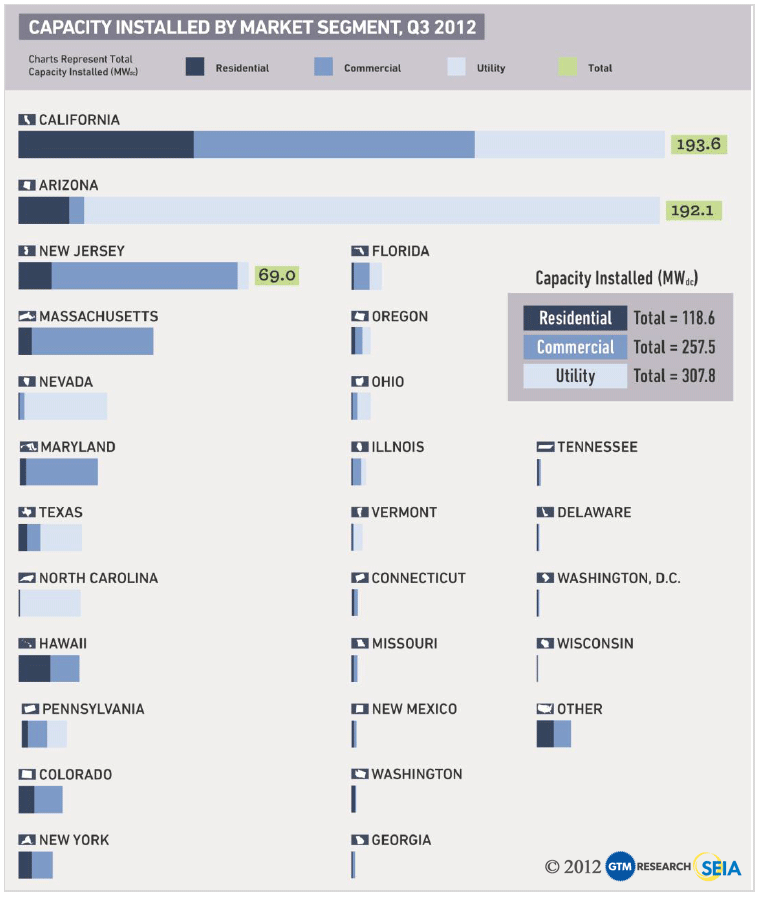
Residential PV installations continued to grow incrementally in Q3 2012. In each of the last five quarters, residential installations have grown between 3% and 21% on a national level, which makes the residential sector by far the most stable segment in the U.S. market. California led the way in Q3 2012 with 52.4 MW installed, up from 46.4 MW in Q2 2012. Second-tier residential markets also generally had a strong quarter, with expansion in Arizona, Hawaii, and Colorado. The one exception was New Jersey, where residential installations declined along with the rest of the market. Third-party owned residential PV systems continue to far outnumber direct purchases by homeowners in mature markets.
After a weak Q2, the non-residential market bounced back in Q3 2012 with 24% quarterly growth. This is particularly impressive given that New Jersey (formerly the largest non-residential market in the country) dropped by 24 MW in Q3. States with notable growth in Q3 included California and Massachusetts. As with other market segments, the non-residential market tends to trend upward in the fourth quarter of each year as installers rush to complete projects within a calendar year. We expect this to remain true in 2012, particularly in California, Arizona, and Massachusetts.
There were 21 utility projects (or phases of projects) completed in Q3 2012 ranging in size from 300 kW to 115 MW. Most notable among these were phases of some of the largest projects in development – Agua Caliente in Arizona and California Valley Solar Ranch in California. There are currently 2.1 GWdc of utility PV projects operating in the U.S. as compared to 10 GW of projects with PPAs that are not yet operating. Of this 10 GW, fully 3 GW comes from the ten largest projects in construction, all of which will be selling power to utilities in California. The imbalance between completed and late-stage development projects will result in significant installation growth figures in the 2012-2014. However, new utility PPA procurement is down and developers are having a harder time finding buyers than they did even one year ago. We expect this to have a meaningful impact on installations in 2015-2016, which is why our forecast for the utility market shows slowing growth in the out years.
Figure 2.3 State-Level Installations, Q3 2012
2.2. Installed Price
Figure 2.4 Average Installed Price by Market Segment, Q1 2011 – Q3 2012
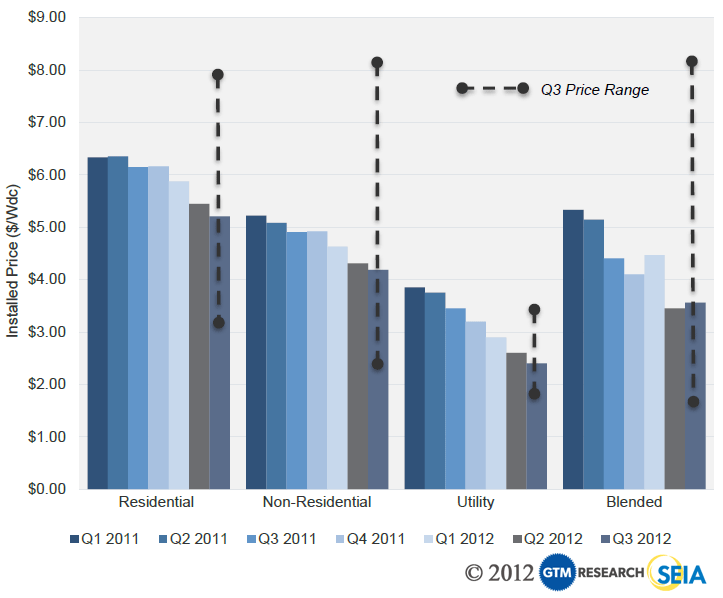
Quarter-over-quarter, the national weighted-average system price rose by 3.2%, from $3.45/W to $3.56/W. Year-over-year, average installed costs declined by 19.3%. This capacity-weighted number is heavily impacted by the volume of utility-scale solar installed in a given quarter, of which there was substantially more installed in Q2 2012 compared to Q3 2012. Within each market segment individually, average installed prices were down across the board. It should be noted that prices reported in this section are weighted averages based on all systems that were completed in Q3 across all locations.
- RESIDENTIAL system prices fell 4.4% from Q2 2012 to Q3 2012, as the national average installed price dropped from $5.45/W to $5.21/W. Year-over-year, installed costs declined by 15.3%. Installed prices came down in all major residential markets—California, Arizona, New Jersey, Massachusetts, and Colorado—and it was not uncommon for final installed prices to be in the $4.00/W range.
- NON-RESIDENTIAL system prices fell 3.0% Q/Q, from $4.31/W to $4.18/W. Year-over-year, installed costs declined by 14.7%. SREC states, such as New Jersey and Massachusetts, helped to drive down the overall national price. For projects in excess of 100 kW, final project prices were consistently in the $2.25/W-$2.75/W range, which leaves limited margins for developers and installers. California also experienced a significant price decrease, helping installation figures rebound from a weak Q2 2012.
- UTILITY system prices once again declined Q/Q, dropping from $2.60/W in Q2 2012 to $2.40/W in Q3 2012. Year-over-year, installed prices fell by 30.4%. First Solar, which has very low turn-key costs, brought a large majority of new utility capacity online in Q3, helping to drive down the average.
2.3 Component Pricing
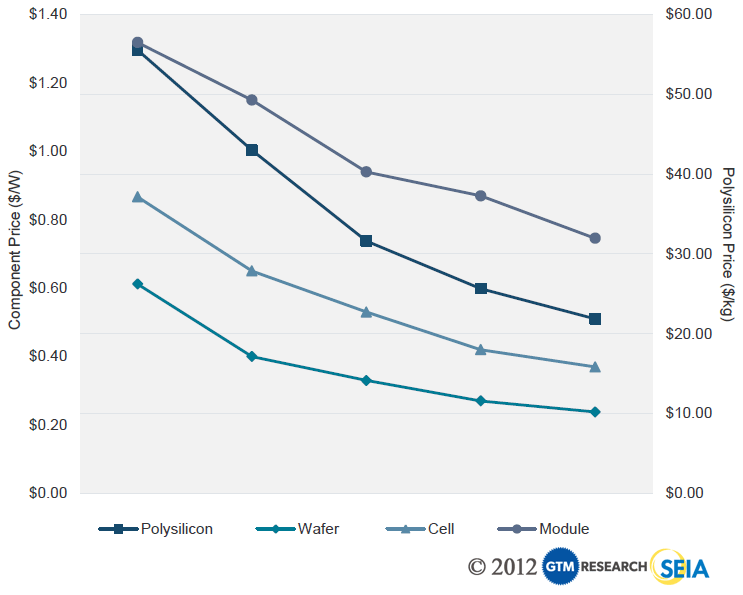
Pricing for polysilicon and PV components remained soft in Q3 2012 due to the persistence of the global oversupply environment that the industry has faced since early 2011. Blended polysilicon prices declined by 15% to $22/kg. Blended module ASPs for Q3 2012 were down to $0.75/W, a staggering 43% lower than Q3 2011 levels of $1.32/W. As the International Trade Commission (ITC) has issued its final decision in the antidumping (AD) and countervailing duty (CVD) investigations against Chinese c-Si cell manufacturers, GTM Research maintains that tariffs will not have a material impact on pricing in the U.S. Many manufacturers continue to obtain U.S.-bound cells via tolling from Taiwan with an estimated cost impact of less than $0.10/W. This does not necessarily prohibit Chinese manufacturers from pricing modules below their domestic competitors. Coupled with the U.S. AD/CVD decision, the outcome of the trade dispute in Europe may have a greater impact on U.S. supply than the U.S. decision alone.
Figure 2.5 U.S. Polysilicon, Wafer, Cell, and Module Prices, Q4 2011-Q3 2012
Residential Rooftop – 7.5kW – 10kW sloped roof in California using a penetrating rail-based systemThis edition also marks the beginning of our coverage of pricing and market dynamics for PV balance of systems, starting with PV mounting structures. Factory gate pricing for PV mounting structures differ heavily depending on market segment, configuration, layout and project size, which can complicate an “average” cost. For example, manufacturers reported costs for the third quarter for commercial systems anywhere between $0.24/W to $0.35/W. For simplicity, we note that the values reported below reflect the mounting structure-only costs of the following system types:
- Commercial Rooftop – 100 kW – 500 kW flat roof ballasted system in California requiring no additional structural support
- Ground Mount Fixed Tilt – 1 MW – 5 MW fixed tilt ground mount system in California, not including foundation structures
- Ground Mount Tracking – 5 MW – 10 MW one-axis tracker in California not including foundation structures
Even with these baselines, note that PV mounting structure purchasers should consider the full implied cost of individual manufacturers rather than relying on quotes versus the national average. Differences in racking materials and design have different implications for labor costs, grounding requirements and additional structural support.
Figure 2.6 U.S. Mounting Structure Pricing by End Market and Quarter, Q3 2012
2.4. Market Outlook
This quarter we have overhauled our installation forecasts. Instead of providing three demand scenarios as we have in the past, we now focus on providing a single forecast with significantly increased detail. Specifically, we will be adding forecasts by state, by market segment, as well as including rolling quarterly forecasts – all of which are available in the full report.
Historically, the fourth quarter has been by far the largest for PV installations in the U.S. In 2010 and 2011, the fourth quarter represented 41% and 42% of all annual installations, respectively. We expect a similar, albeit slightly lower, fourth quarter bump in 2012 with 1,202 MW installed, or 38% of the annual total. To be sure, much of this forecast hinges on the timely completion of a number of utility-scale projects currently in the late stages of construction. But we do expect growth across all market segments.
Apart from the utility sector, Q4 developments in Massachusetts and California are worth noting. Specifically, we are expecting to see 40 MW of non-residential installations in Massachusetts over that time frame, while the California forecast calls for 60 MW in residential installations. We anticipate a continued downturn in New Jersey and Colorado, but robust growth in Hawaii and Arizona.
Figure 2.7 PV Installation Forecast, 2010-2016E

Our overall forecast for U.S. PV market growth has largely remained steady this quarter, with 3.2 GW expected in 2012 growing to nearly 8 GW in 2016. However, there is one significant revision within our market outlook. In the out years of the forecast (2015-2016) our estimate of utility PV installations has decreased, while the residential and non-residential forecasts have been increased. As a result, we expect the distributed generation sector to regain some of the market share it has been losing beginning in 2015, if not earlier.
Figure 2.8 PV Market Segmentation, 2008-2016E

Note: Installation forecast by state available in the full report |
3. Concentrating Solar Power
While there was no additional concentrating solar capacity installed in Q3 2012, there were significant developments within the market:
- All phases of BrightSource’s Ivanpah project are expected online in 2013
- Abengoa’s Solana Generating Station is over 75% complete and expected online in summer 2013
- PPA discussions continue with Tri-State and Xcel for the 200 MWac Saguache project in Colorado
- The California Public Utilities Commission (CPUC) unanimously approved an amended PPA for BrightSource’s Sonoran West project
Figure 3.1 Select Concentrating Solar Project Development Highlights
Project | State | Technology | Capacity (MWac) | Expected Completion | Project Status Update |
|---|---|---|---|---|---|
Solana Generating Station | AZ | CSP | 280 | 2013 | Installation 75% complete; expected online |
Ivanpah | CA | CSP | 392 | 2013 | Unit 1: Successfully aimed first 3 heliostats at Unit 1 boiler; on track to begin hydro-testing; more than 49,000 pylons and heliostats installed |
Genesis Solar Energy Project-1 | CA | CSP | 125 | 2013 | Flooding damaged 35 sections of mirrors, creating ~$3M in damage and extended project timeline |
Crescent Dunes Solar Energy Project | NV | CSP | 110 | 2013 | BATZ Energy selected to supply sandwich panels for heliostats |
Palen Solar | CA | CSP | 500 | 2014 | CEC approves ownership transfer to BrightSource |
Abengoa Mojave Solar (AMS) | CA | CSP | 280 | 2014 | Installation 30% complete |
Saguache | CO | CSP | 200 | 2015 | PPA discussions with Tri-State and Xcel, but |
Rio Mesa 1 | CA | CSP | 250 | 2015 | CPUC voted to deny cost recovery for SCE PPA based on price and value comparison |
Siberia 1 & 2 | CA | CSP | 400 | 2016 | CPUC voted to deny cost recovery for SCE PPA due to transmission uncertainty and interference with nearby military training operations |
Sonoran West | CA | CSP | 200 | 2017 | CPUC unanimously approved amended PPA |
ASU CPV Project | AZ | CPV | 1 | 2012 | SunPower driving piers into ground |
SunPower C7 Project | AZ | CPV | 6 | 2013 | PPA with Tucson Electric Power; will begin construction in first half of 2013; online Q4. |
[1] All capacity figures are reported in direct current (DC) unless otherwise stated
[2] To ensure the upmost accuracy, each quarter new data is added to the U.S. Solar Market Insight reports, thus reported
figures may not match those of previous iterations
U.S. Solar Market InsightTM is a quarterly publication of the Solar Energy Industries Association (SEIA)® and GTM Research. Each quarter, we survey nearly 200 installers, manufacturers, utilities, and state agencies to collect granular data on photovoltaic (PV) and concentrating solar power. These data provide the backbone of this Solar Market InsightTM report, in which we identify and analyze trends in U.S. solar demand, manufacturing, and pricing by state and market segment. We also use this analysis to look forward and forecast demand over the next five years. As the U.S. solar market expands, we hope that Solar Market InsightTM will provide an invaluable decision-making tool for installers, suppliers, investors, policymakers and advocates alike.
* References, data, charts or analysis from this Executive Summary should be attributed to the SEIA/GTM Research U.S. Solar
Market Insight.
* Media inquiries should be directed to Nick Rinaldi ([email protected]) at GTM Research or to Monique Hanis ([email protected]) or Jamie Nolan ([email protected]) at SEIA.
* All figures sourced are from GTM Research. For more detail on methodology and sources, visit www.gtmresearch.com/solarinsight.
AUTHORS
GTM Research Solar Analysts:
Shayle Kann, Vice President, Research
Shyam Mehta, Senior Analyst
MJ Shiao, Senior Analyst
Andrew Krulewitz, Solar Analyst
Carolyn Campbell, Solar Analyst
Scott Burger, Solar Analyst
Nicole Litvak, Research Associate
SEIA Policy and Research Division:
Tom Kimbis, Vice President, Strategy and External Affairs
Justin Baca, Senior Research Manager
Will Lent, Research & Policy Analyst
Shawn Rumery, Research Associate
