Solar Market Insight Report 2013 Year in Review
Purchase the full report | Press Release | Fact Sheet
The quarterly SEIA/GTM Research U.S. Solar Market Insight™ report shows the major trends in the U.S. solar industry. Learn more about the U.S. Solar Market Insight Report.
1. Introduction
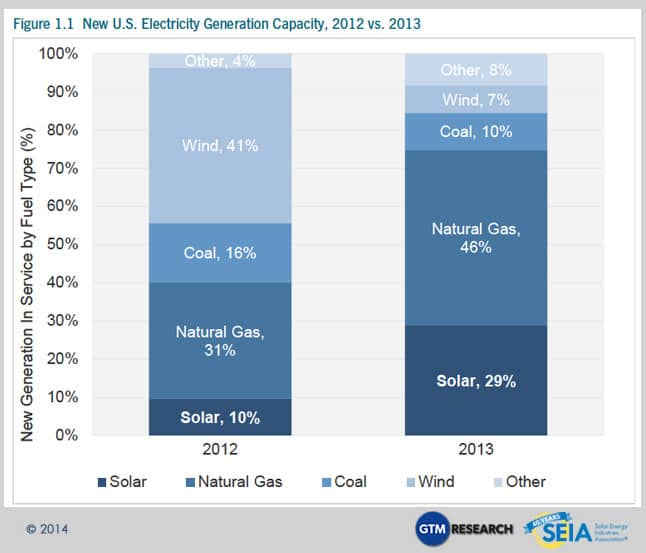
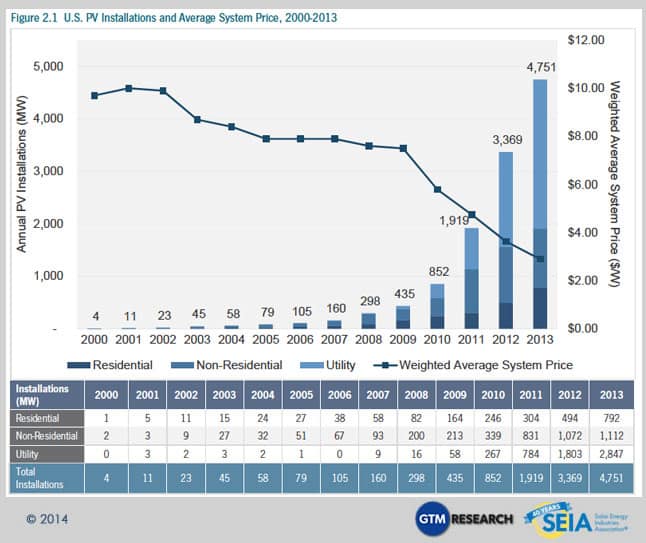
The U.S. solar industry has much to celebrate about the year 2013. Photovoltaic (PV) installations continued to proliferate, increasing 41% over 2012 to reach 4,751 MW. Solar was the second-largest source of new electricity generating capacity in the U.S., exceeded only by natural gas. And the cost to install solar fell throughout the year, with average system prices ending the year 15% below the mark set at the end of 2012.
 The U.S. solar market showed the first real glimpse of its path toward mainstream status in 2013. The combination of rapid customer adoption, grassroots support for solar, improved financing terms, and public market successes indicated clear gains for solar in the eyes of both the general population and the investment community. And in the long term, a mainstream solar industry will need customers who seek out and support solar, as well as investors who see an attractive risk-adjusted opportunity in the market.
The solar industry also became a major part of a much larger discussion that took center stage in 2013 around the future of electricity and electric utilities. As distributed solar gains steam, and as adjacent technologies such as energy storage become economically viable, the traditional utility business model is increasingly called into question. Throughout the electricity industry, 2013 was the year of catchphrases such as “utility 2.0” and “utility of the future.” Utilities themselves began to stake out positions on all sides of the issue, some seeking to protect their current territory and others investing in distributed generation – capitalizing on the opportunity that comes with change.
If 2013 was about raising the issue, 2014 will be about defining solutions. Increasingly, solar is not bound by its cost, but rather by its role in the electricity sector. And as solar continues along its path toward the mainstream, its integration with the broader electricity market from a technical, market and regulatory perspective will become one of the most important issues in the industry.
Key Figures
- The U.S. installed 4,751 MW of solar PV in 2013, up 41% over 2012 and nearly fifteen times the amount installed in 2008
- There is now a total of 12.1 GW of PV and 918 MW of CSP operating in the U.S.
- There were 140,000 individual solar installations in the U.S. in 2013, and a total of over 445,000 systems operating today
- Q4 2013 was by far the largest quarter ever for PV installations in the U.S., with 2,106 MW energized, up 60% over the second-largest quarter (Q4 2012)
- More solar has been installed in the U.S. in the last eighteen months than in the 30 years prior
- The market value of all PV installations completed in 2013 was $13.7 billion
- Solar accounted for 29% of all new electricity generation capacity in 2013, up from 10% in 2012. This made solar the second-largest source of new generating capacity behind natural gas.
- Weighted average PV system prices fell 15% in 2013, reaching a new low of $2.59/W in the fourth quarter
- We forecast 26% PV installation growth in 2014, with installations reaching nearly 6 GW. Growth will occur in all segments, but will be most rapid in the residential market.
- The U.S. also installed 410 MW of concentrating solar (CSP) in 2013, increasing total CSP capacity in the U.S. by more than 80%
- The wave of concentrating solar power installations slated for completion at the end of 2013 into 2014 kicked off with the 280 MWac Solana project and the Genesis Solar project’s initial 125 MWac phase. In early 2014, BrightSource’s notable Ivanpah project also began operating and SolarReserve’s Crescent Dunes began commissioning.
2013 TOP 10 SOLAR STATES

We count down the Top 10 Solar States based on solar capacity installed in 2013. California installed half of all the solar capacity it has ever installed in 2013, but Texas, ranked 8th, has enough solar potential it could power the world twice over. What state has the fastest growing solar industry? Find out!
Additional highlights from 2013 in the U.S. solar market include:
- Positive Early Signs in NEM Debates: Disputes between utilities and solar advocates emerged over the issue of net energy metering (NEM) across a variety of markets, ranging from major solar states (e.g., California, Colorado and Arizona) to more nascent solar states (e.g., Utah, Idaho, Louisiana and Georgia). Broadly speaking, the solar market has remained unscathed thus far. But the next two years will bring both new venues for NEM debates and longer-term decisions in the existing battlegrounds.
- Financial Innovation: After years of discussion and speculation, a number of new financing mechanisms for solar emerged in 2013. NRG Energy took its first YieldCo public, generating a tradable, dividend-producing security that contains both utility-scale and rooftop solar projects, as well as fossil fuel assets. SolarCity successfully launched the first distributed solar securitization, worth $54 million. Opportunities for consumers to invest in solar via crowdfunding or community solar gained new prominence.
- Cost Reduction: PV module prices increased slightly in 2013, the first annual price increase since 2008. However, prices fell substantially for other components such as inverters (which decreased by 15% to 18%) and racking systems (19% to 24%). In addition, a range of other factors including downstream innovations drove down overall system prices throughout the year in all market segments. By the end of the year, system prices had fallen 9% in the residential market, 16% in the non-residential market and 14% in the utility market.
- A New U.S.-China Trade Case: On December 31, 2013, SolarWorld Industries filed a new antidumping/countervailing duty petition before the U.S. International Trade Commission. This petition seeks to prevent Chinese module manufacturers from using Taiwanese crystalline PV cells to avoid paying the import tariffs on modules with Chinese cells that were imposed after SolarWorld’s initial petition, filed in October 2011. Under the previous ruling, Chinese module manufacturers can produce solar wafers in China, ship them to Taiwan for cell manufacturing, and then send them back to China for module assembly to avoid U.S. import tariffs of more than 30%. While the outcome of this case remains in question, it is likely to reshape the U.S. solar market in some fashion. [See the Full Report for more details, or visit http://www.seia.org/policy/manufacturing-trade/international-trade.]
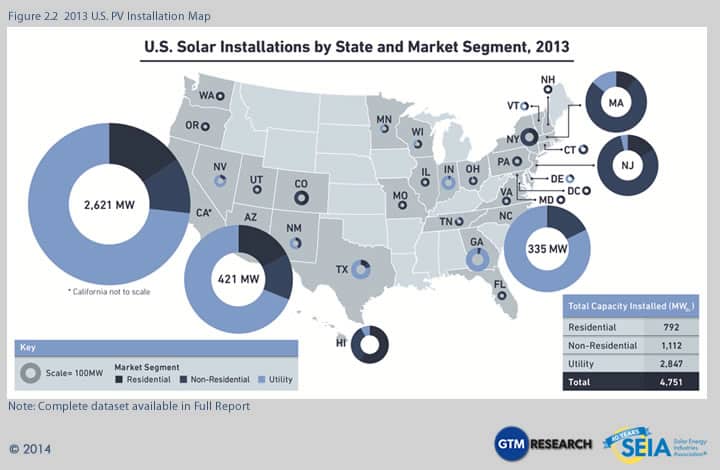
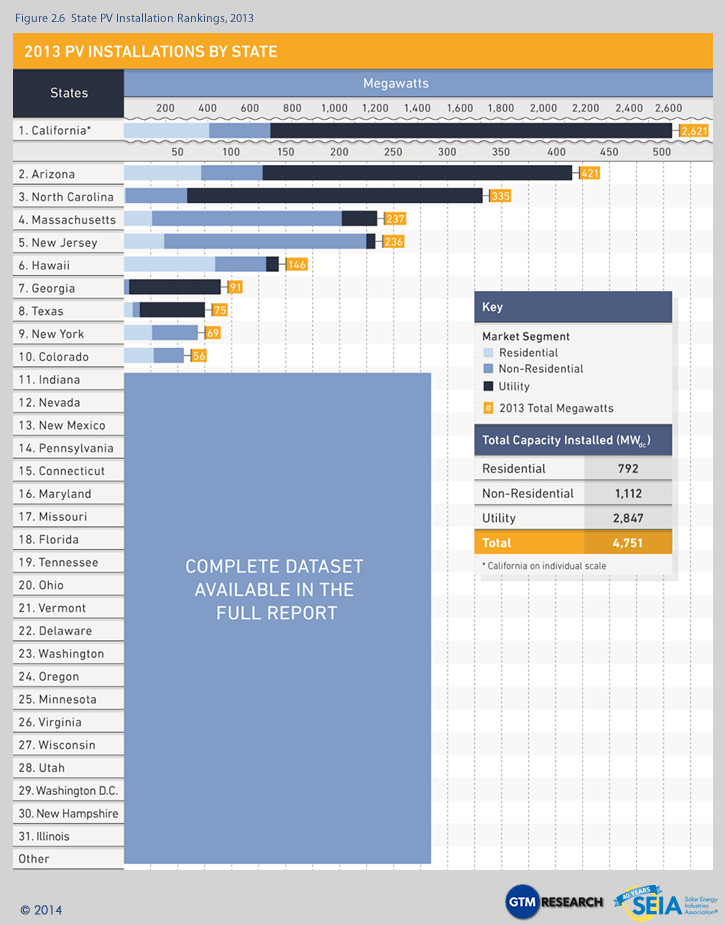
- California Sees Unparalleled Growth: California alone installed more than half of all solar in the U.S. in 2013. In fact, the state installed more solar in 2013 than the entire country did in 2011. California led the pack in each market segment and saw a doubling of installations in both the residential and utility segments. Looking to 2014, California shows no signs of slowing down, particularly in the distributed generation market.
- The Ascent of North Carolina, Massachusetts and Georgia: While Arizona and New Jersey, historically the second- and third-largest state solar markets, faltered in 2013, three states in particular emerged to fill the gap. North Carolina grew 171% over 2012 to install 335 MW, Massachusetts grew 76% to install 237 MW, and Georgia grew 762% to install 91 MW in 2013.
- The Realized Promise of Centralized Solar: The U.S. installed over 2.8 GW of utility solar in 2013, up 58% over 2012. Eleven individual projects of more than 50 MW each were completed in 2013, more than in any other year. Together, Arizona, California, and North Carolina accounted for 87% of all utility PV installations.
2. Photovoltaics
2.1 Installations
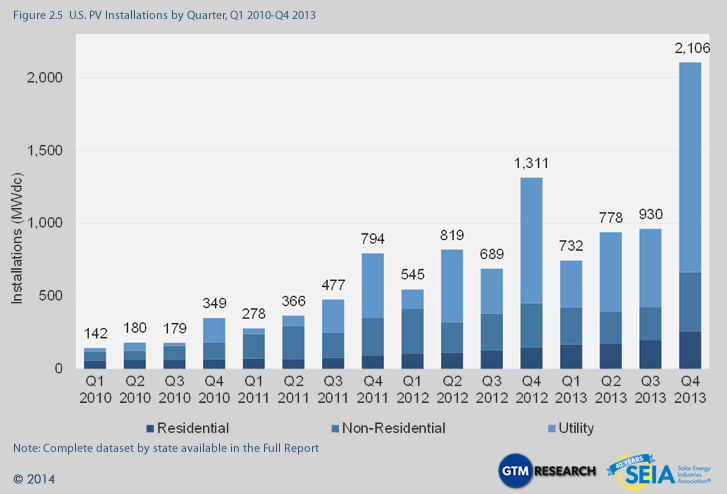
The U.S. installed 4,751 MW of PV in 2013, up 41% over 2012. Annual weighted average PV system prices continued to decline in 2013, reaching a historic low of $2.89/W.
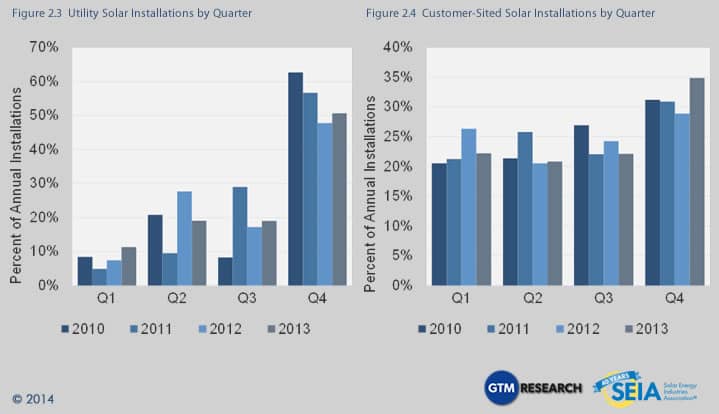
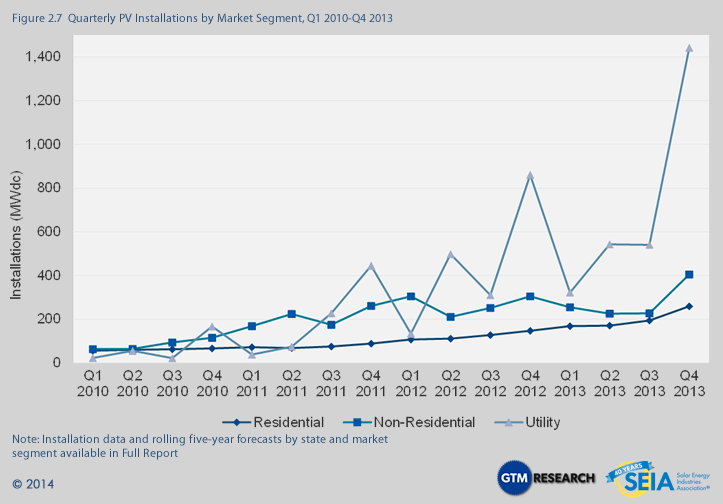
 Of the 4,751 MW installed in 2013, 2,106 MW (44%) came in the fourth quarter. This makes Q4 2013 by far the largest quarter in the history of the U.S. market, exceeding the second-largest quarter by 60%. This end-of-year boom came from all market segments, but was particularly strong in the utility market, which saw over 1.4 GW installed across fifteen states in Q4.
The fourth quarter boom experienced in 2013 is consistent with previous years. The U.S. market tends to see a significant jump in installations at the end of the year, regardless of whether there are major incentives that are expiring. This seasonality was observed in the distributed generation market, where 35% of annual 2013 installations took place in Q4, but it was particularly pronounced in the utility market, where 51% of annual installations were completed in Q4.
2.1.1. Market Segment Trends
Residential
792 MW installed in 2013, representing 60% annual growth.
Over the past three years, the U.S. residential solar market has been distinguished by its remarkably consistent incremental growth. On a national level, residential solar has steadily gained steam as homeowner financing options (leases, loans, and PPAs) become more widely available, system costs continually decline, and market participants innovate. Some of the most impactful developments in 2013 included:
- Evolving Channel Strategies – Residential solar installers and originators spent much effort in 2013 honing their strategies to reach customers. Some announced new retail partnerships (e.g., with Home Depot, Toyota), while others linked up with electricity retailers or local service professionals. We expect to see further diversification of sales channels in 2014, including a number of new partnerships with electricity suppliers, the entry of cable and other home service providers, and potentially an increased role for local banks in solar sales.
- Financial Innovation – Though its immediate impact is small, the long-term impact of SolarCity’s first securitization of distributed solar assets is likely to be huge. Securitizing pools of residential solar assets can both lower the cost of capital and increase its availability – removing two of the primary historical barriers to growth in the residential sector. In 2014, another residential system owner will almost certainly securitize its own portfolio and, if all goes according to plan, yields on these pools will begin to decrease.
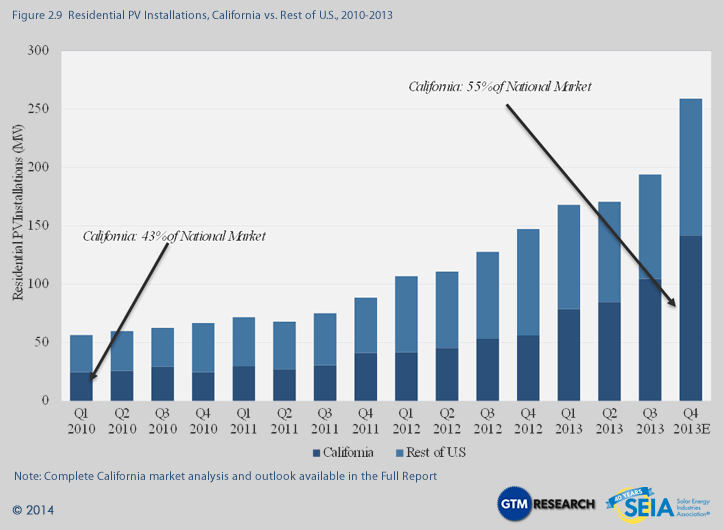
Most notable about 2013 was the Q4 boom, in which installations jumped 33% over the previous quarter – the largest quarterly increase in recent history.
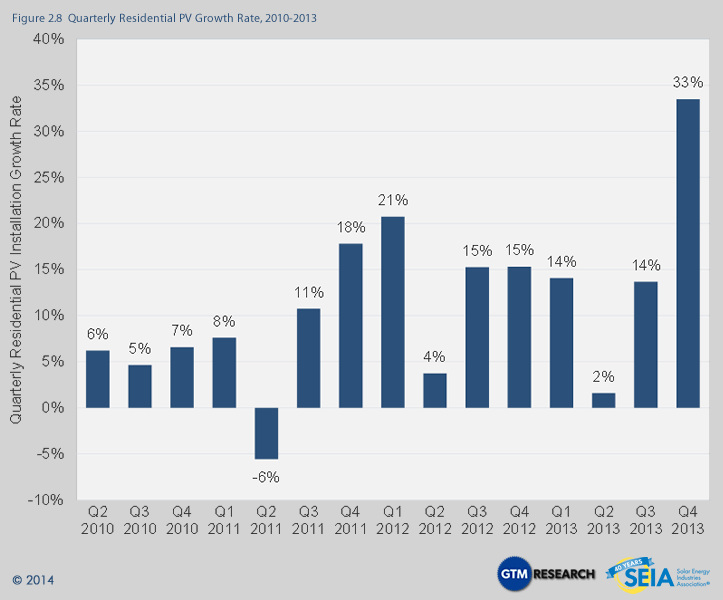 This year-end jump, and indeed much of the annual growth, is attributable primarily to California. While the California market has always been the largest for residential solar, its importance has only grown over time, with its market share of national installations increasing from 43% in Q1 2010 to 55% in Q4 2013. As we have noted previously, California is the first major solar market to begin the transition away from state-level incentives. By all accounts, the residential solar market in California shows no signs of slowing down in the near term. Its medium- and long-term potential rests on decisions regarding net energy metering and rate design.
Non-Residential
1,112 MW installed in 2013, representing 4% growth over 2012.
Thanks to a huge Q4, the non-residential market (comprising commercial, government, school and nonprofit installations) squeaked out 4% annual growth at the national level. Still, it was a difficult year overall for the market. Three of the top five state markets in 2012 -- Arizona, California and New Jersey -- shrank in 2013. While this decline was overcome by impressive growth in a number of other markets, most notably Massachusetts, it made for a volatile period for project developers.
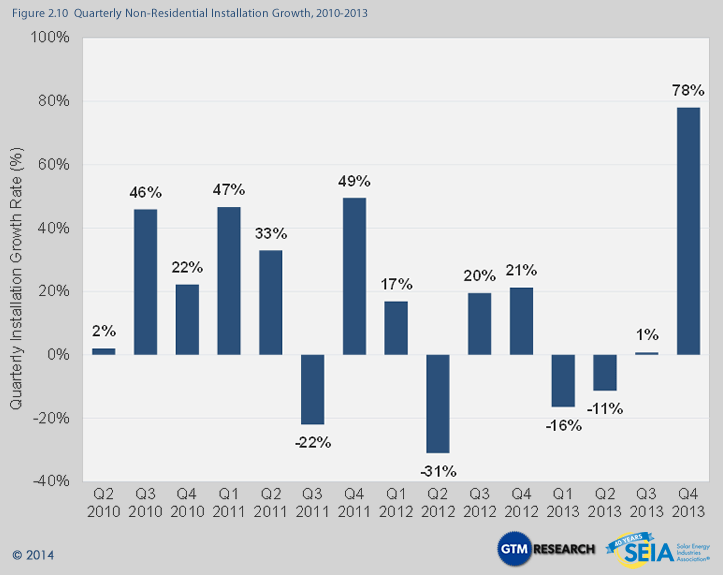 Within the Q4 2013 data, there are a number of positive signs for this market’s recovery in 2014.
- New Jersey Market Recovery – New Jersey saw early signs of a recovery from its SREC-oversupply-driven slump in Q4. As is discussed in more detail in the New Jersey section of the Full Report, SREC pricing and supply/demand indicators suggest that the New Jersey market will see a stronger 2014 overall, though it is unlikely to reach its previous heights.
- Massachusetts Solar Shines – The Massachusetts market now has clarity regarding the next phase of its SREC program, dubbed SREC II, and 2014 will see a mixture of installations from final SREC I projects (of which there are many) and projects under the new structure, combining to create another strong year for 2013’s third-largest non-residential market.
- Secondary Market Expansion – A number of states with previously small or stagnant non-residential markets will see meaningful installation growth in 2014. In particular, look for significant figures out of New York, Arizona, and Colorado.
Utility
2,847 MW installed in 2013, representing 58% growth over 2012.
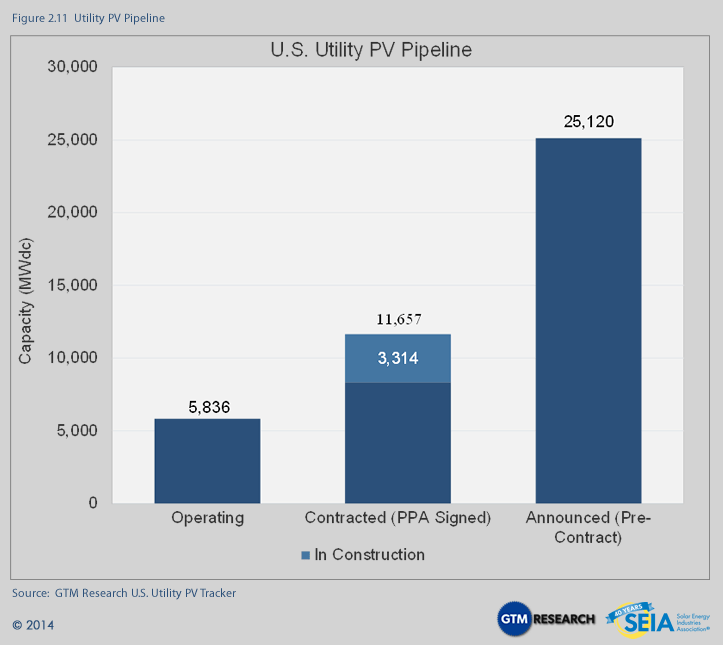
To place the utility PV sector’s impressive installation growth in historical perspective, utility PV installations in 2013 alone accounted for approximately one-quarter of all cumulative PV capacity in the U.S. Of this total, a record-breaking 1.4 GW came on-line in Q4 2013 alone. But despite this impressive growth in installations, project pipeline replenishment was in the red for the first time in the segment’s history in Q4, with installations outpacing new procurement as RPS-driven demand began to wane and with less than three years remaining for the 30% federal investment tax credit. The contracted pipeline of projects fell from 12.6 GW to 11.7 GW, of which 3.3 GW is currently in construction with expected completion in the next two to three years.
 Looking forward to 2014, the demand landscape has shifted toward projects in the 1 MW to 20 MW range in order to meet utilities’ near-term capacity needs and remaining RPS compliance obligations. New procurement of utility PV in the 50 MW to 100 MW range is currently confined primarily to Georgia Power’s Advanced Solar Initiative and the wave of new RFPs that will be issued by North Carolina’s IOUs to meet the ample capacity remaining for their RPS requirements. A glimpse of future utility PV demand based on pure cost-competitiveness has come from Xcel Energy in Colorado, which has received approval to procure 170 MW of utility PV as a hedge against volatile natural gas prices.
2.2. System Prices
2013 ranks as another banner year for average installed price reductions across all market segments in the U.S.
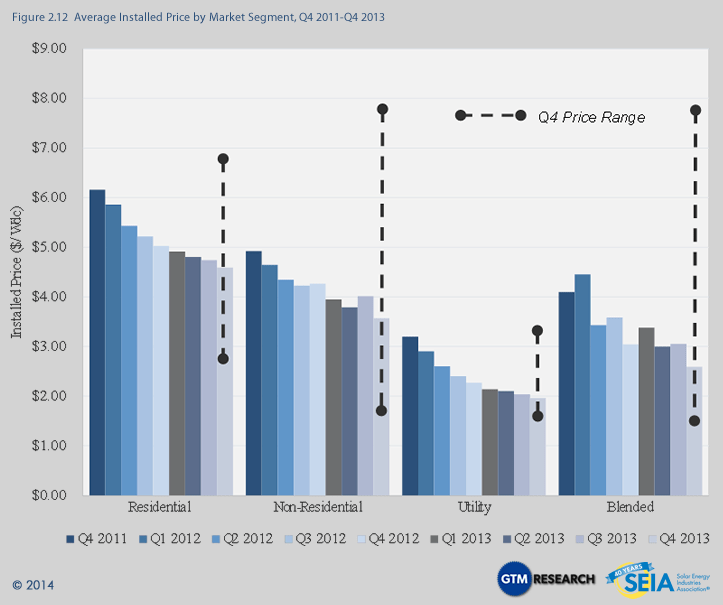
Quarter-over-quarter, the national average system price declined by 15%, falling from $3.05/W in Q3 to $2.59/W in Q4, while dropping 14.8% from $3.04/W a year earlier. This capacity-weighted number is heavily impacted by the volume of utility-scale solar installed in a given quarter. Utility PV capacity accounted for more than two-thirds of all new capacity installed, and for that reason, it had a relatively larger impact on the blended average system price. Individually, the residential, non-residential, and utility segments all saw price decreases on a quarter-over-quarter basis. (It should be noted that prices reported in this section are weighted averages based on all systems that were completed in Q4 across many locations and that the weight of any individual location can influence the average.)
- From Q4 2012 to Q4 2013, residential system prices fell 8.8%, from $5.03/W to $4.59/W. Quarter-over-quarter, installed prices declined by 3.2%. Installed prices came down in most major residential markets including California, Arizona, New Jersey, and New York.
- Non-residential system prices fell by an impressive 16.3% year-over-year, from $4.26/W to $3.57/W, while quarter-over-quarter installed costs decreased by 11%. Higher-priced school and government projects with prevailing wage requirements drove up average installed costs in Arizona’s non-residential market. Amidst this uptick, however, the non-residential market on the whole benefited from an influx of large ground-mount systems completed in Massachusetts and New Jersey, with $3.00/W average installed prices and prices that ranged as low as $1.94/W.
- Utility system prices once again declined quarter-over-quarter and year-over-year, down from $2.27/W in Q4 2012 and $2.04/W in Q3 2013, settling at $1.96/W in Q4 2013.
On the whole, installed PV prices vary greatly not only state to state, but also project to project. Common residential system prices ranged from less than $3.00/W to just under $7.00/W. Non-residential prices hit levels as low as $1.70/W, but ranged upward to almost $8.00/W. Utility prices also display high variability: a 50-MW-plus fixed-tilt installation will be significantly less expensive than a 1 MW pilot project that employs dual-axis tracking. (Note that the lowest installed cost per watt does not necessarily yield the lowest levelized cost of energy, an important metric for measuring project returns which is heavily influenced by the energy production.)
2.3. Component Pricing
Note: Detailed component pricing, including inverters and mounting structures, available in the Full Report
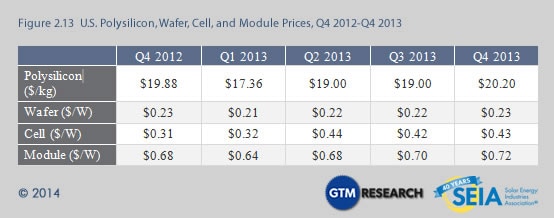
2.3.1 Polysilicon, Wafers, Cells and Modules
After two years of continuous and often precipitous declines, pricing for polysilicon and upstream PV components recovered in 2013 due to a much stronger global supply-demand balance. Pricing for polysilicon, wafers and modules in Q4 2013 registered increases of low single digits compared to Q4 2012, while Q4 2013 cell pricing was up 35% year-over-year. This was due to price hikes for Taiwanese cells driven by explosive growth in the Japanese end market, where large volumes of Taiwanese cells are currently sold for module assembly. On a quarterly basis, pricing continued to tick upwards slightly compared to Q3 2013 due to strong end demand in Japan, the U.S. and China, as well as a more consolidated supply chain. Blended polysilicon prices increased by 6% quarter-over-quarter to $20.20/kg, while blended module ASPs were up to $0.72/W, 3% higher than Q3 2013 levels. Pricing increases could continue over the course of 2014, with spot polysilicon currently trading in the $24/kg to $25/kg range and U.S. module pricing increasing by $0.01/W to $0.02/W in January and February.
2.4 Market Outlook
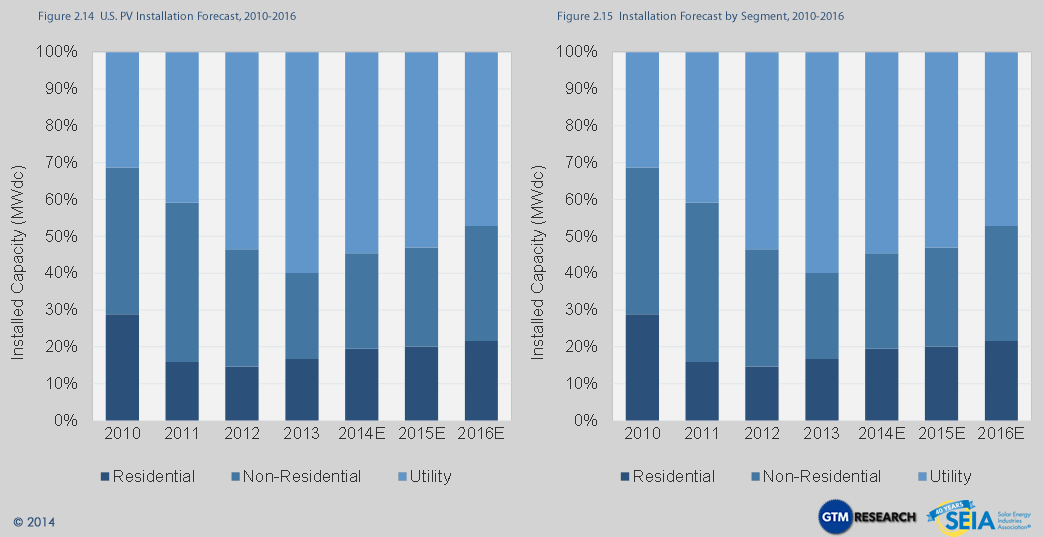
For 2014, our forecast calls for 26% overall growth in the U.S. solar market, with installations reaching nearly 6 GW. We expect growth in all three segments, though at varying magnitudes.
 Forecast details by state and market segment are available in the Full Report.
3. Concentrating Solar Power
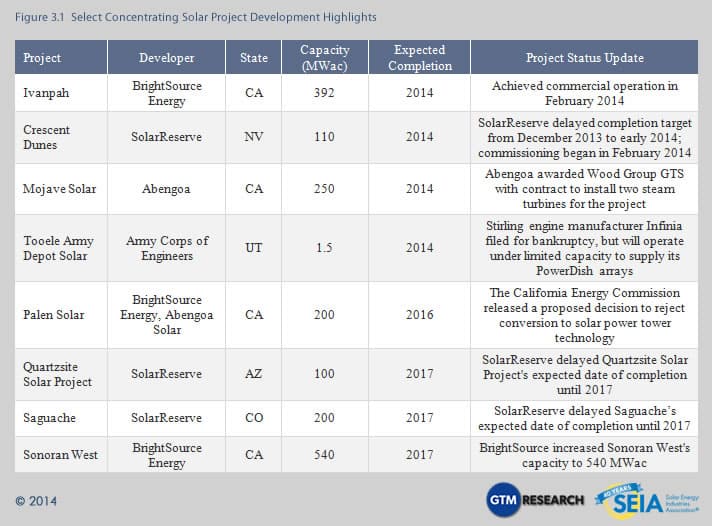
While the 5 MWac Kalaeloa Solar One project was the only concentrating solar power (CSP) project to come on-line in the first three quarters of 2013, in Q4 the first wave of mega-scale CSP projects began to come on-line, starting with Abengoa’s 280 MWac Solana Generating Station and the first 125 MWac phase of NextEra’s Genesis solar project.
While BrightSource Energy’s Ivanpah project dominated market news throughout 2013, it officially achieved commercial operation during Q1 2014. The next notable project slated for completion is SolarReserve’s 110 MWac Crescent Dunes, which entered the commissioning phase in February 2014. Major CSP project development highlights throughout 2013 and into the beginning of 2014 can be found below:
