Solar Market Insight Report 2014 Q2
Purchase the full report | Press Release
The quarterly SEIA/GTM Research U.S. Solar Market Insight™ report shows the major trends in the U.S. solar industry. Learn more about the U.S. Solar Market Insight Report.
Key Figures
The U.S. installed 1,133 MWdc of solar PV in Q2 2014, up 21% over Q2 2013, making it the fourth-largest quarter for solar installations in the history of the market
Cumulative operating PV capacity has now eclipsed the 15 GWdc mark, thanks to three consecutive quarters of more than 1 GWdc installed.
Through the first half of 2014, more than a half-million homeowners and commercial customers have installed solar PV.
For the first time ever, more than 100 MWdc of residential PV came on-line in a single quarter without any state incentive.
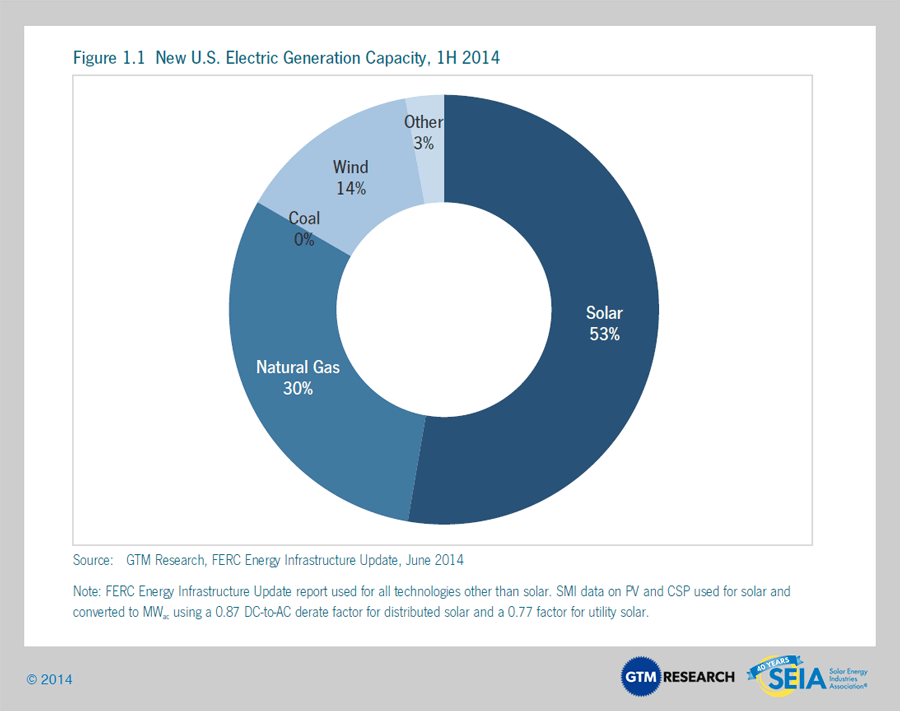
53% of all new electric generating capacity in the U.S. in 1H 2014 came from solar.
Growth remains driven primarily by the utility solar PV market, which installed 625 MWdc in Q2 2014, up from 543 MWdc in Q2 2013.
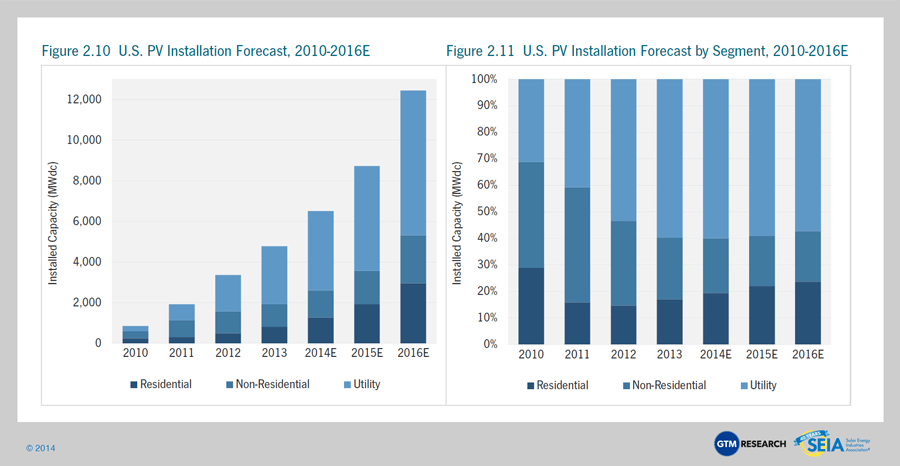
We forecast that PV installations will reach 6.5 GWdc in 2014, up 36% over 2013 and more than three times the market size of just three years ago.
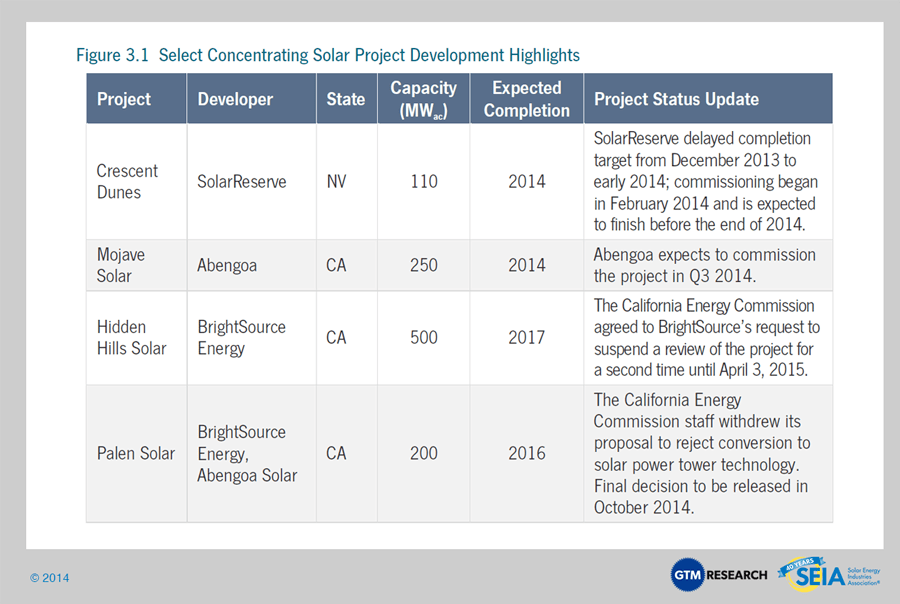
Q1 2014 was the largest quarter ever for concentrating solar power, due to the completion of the 392 MWac Ivanpah project and Genesis Solar project’s second 125 MWac phase. While no CSP plants came on-line in Q2 2014, commissioning work continues at Crescent Dunes and a total of 857 MWac is expected to be completed by year’s end, making 2014 the biggest year ever for CSP.
1. Introduction

The U.S. solar market had another strong quarter in Q2 2014. Photovoltaic (PV) installations reached 1,133 MWdc in Q2, up 21% over the same quarter in 2013. As has been the case for the last two years, the utility PV market drove the majority of this growth, accounting for 55% of capacity installed in Q2 2014. Across the distributed generation landscape, residential PV resumed its trend of incremental growth, while non-residential PV rebounded after adding fewer installations than the residential market in the last quarter.
While no CSP plants came on-line in Q2 2014, Q1 2014 was the largest quarter ever for concentrating solar power, due to the completion of the 392 MWac Ivanpah project and Genesis Solar project’s second 125 MWac phase. After converting PV installations into alternating current (AC) and including CSP installations, total solar installed capacity for the first half of 2014 was 2,673 MWac. This represents 53% of all new electricity generating capacity installed during the quarter.
Beneath these top level numbers, the market is complex and always changing. In this report, we highlight a number of important dynamics shaping the market today. Among them are:
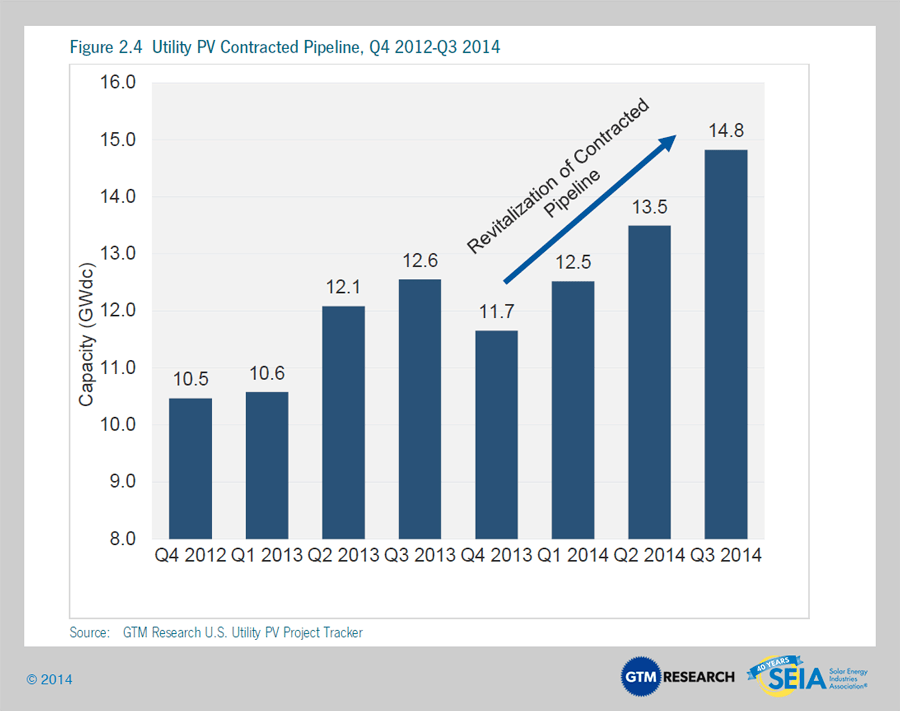
The resurgence of utility PV procurement. Despite many utilities in the Western U.S. having already met their near-term renewable energy obligations, utility-scale solar project developers have amassed more than 3 gigawatts of new contracts over the past twelve months. Solar’s increasing cost-competitiveness, along with a variety of new procurement mechanisms, is fueling the flames of a market that had, until recently, been focused primarily on existing pipeline build-out.
- The resurgence of utility PV procurement. Despite many utilities in the Western U.S. having already met their near-term renewable energy obligations, utility-scale solar project developers have amassed more than 3 gigawatts of new contracts over the past twelve months. Solar’s increasing cost-competitiveness, along with a variety of new procurement mechanisms, is fueling the flames of a market that had, until recently, been focused primarily on existing pipeline build-out.
- Continued net energy metering debates, with potential solutions on the horizon. Net energy metering remains a crucial point of contention between the solar industry and utilities in more than a dozen states. Thus far, the outcomes of these debates have largely favored the solar industry, but many remain in process. We highlight the minimum bill, recently proposed in Massachusetts and under consideration in a number of other states, as a potential framework for compromise.
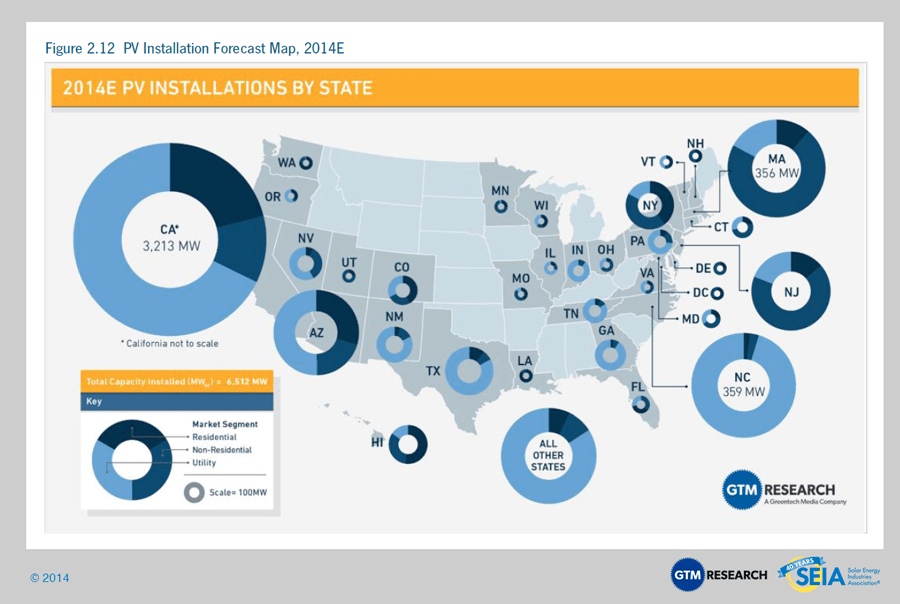
- The residential solar juggernaut continues. The residential market has seen the most consistent growth of any segment for years, and its momentum shows no signs of slowing. For the first time ever, more than 100 MWdc came on-line without any state incentive in Q2 2014. However, the residential market has grown increasingly dependent on California, which accounted for more than 50% of installations for the fourth consecutive quarter.
- The small commercial solar gap. Within the non-residential market, we focus on the small commercial sector, whose share of installations has been shrinking precipitously over the past few years, even as the share of projects larger than 1 MWdc has grown. Difficulties in financing, along with other non-scaling costs, have long kept the small commercial sector in check despite its enormous potential. Still, we see some opportunity on the horizon as companies develop mechanisms to build out and finance small commercial portfolios.
By all accounts, 2014 will be another banner year for solar in the U.S. We forecast that 6,512 MWdc will be installed this year, up 36% over 2013 and more than 650% over 2010. Likewise, 2014 will be a landmark year for concentrating solar power (CSP), which will likely see a total of 857 MWac completed.
2. Photovoltaics
2.1. Installation Overview
The U.S. installed 1,133 MWdc of solar PV in the second quarter of 2014, down 16% from Q1 2014 but up 21% over Q2 2014. This is the third consecutive quarter in which more than 1 gigawatt (GW) was installed in the U.S., highlighted by the continued distributed generation (DG) boom in which residential and non-residential installations added more than 500 MWdc for the second time ever.

Although the DG market has grown by impressive strides, the primary backbone of U.S. demand continues to be utility PV. More than 10 gigawatts of utility PV earned PPAs between 2010 and 2012, thanks to a wave of aggressive procurement driven by RPS standards. This contracted pipeline is finally becoming realized, and the outlook for utility PV remains stronger than ever as contracted capacity continues to outpace capacity brought on-line in primary markets (California and North Carolina) and secondary markets as well (Georgia, Minnesota, Texas, and Utah).
2.1.1. Market Segment Trends
Residential PV
- Up 45% over Q2 2013
- Up 2% over Q1 2014
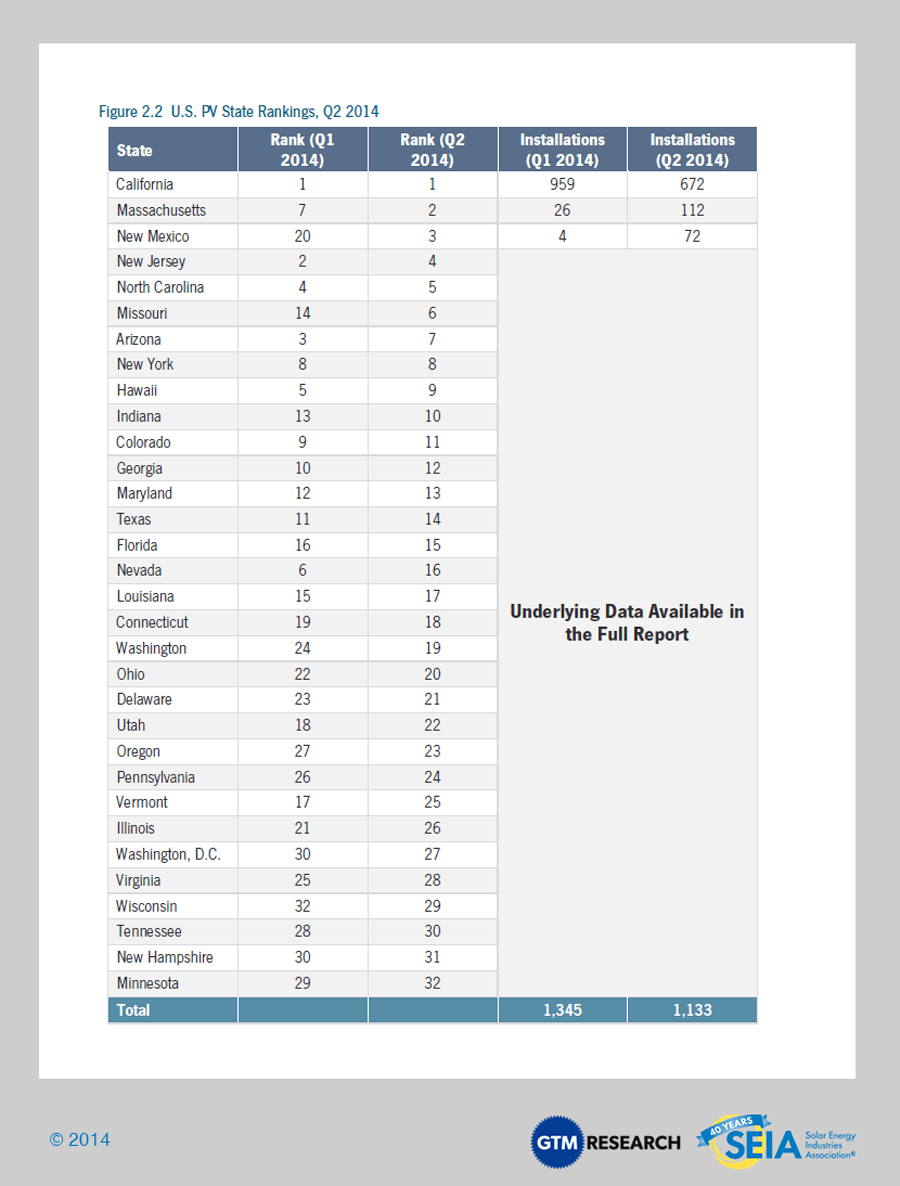
In Q2 2014, the residential market resumed its trend of incremental quarterly growth. Of the 31 states we track, twenty-two grew on a year-over-year basis, although growth remains increasingly reliant on California, which accounted for a record 57% of national installations in Q2 2014. Third-party-owned (TPO) residential PV systems continue to be an attractive option for many homeowners, driving anywhere from 56% (Massachusetts) to well over 90% (Colorado) of residential installations in mature state markets. However, Arizona, California, and Massachusetts all experienced gradually declining TPO market share over the past year as 1) an increasing number of installers have partnered with national and regional banks to provide loans and 2) the cost of solar has come down enough that more customers can afford to pay in cash.
Non-Residential PV
- Up 16% from Q2 2013
- Up 13% from Q1 2014
The non-residential market continues to be characterized by lumpy development cycles, driven by the ebbs and flows of incentive levels across a select number of state markets. In Q2 2014, non-residential installations increased 13% over Q1 2014, although they remained well below the record growth experienced in the final quarter of 2013. The incremental rebound that did occur, however, can be largely attributed to an uptick in Massachusetts (up 370% quarter-over-quarter), California (up 14% quarter-over-quarter), and Missouri, which added more than 10 MWdc for the first time ever in Q2 2014. In the second half of 2014, we expect continued growth across the state market leaders, including Massachusetts, California, and New York.
FULL REPORT EXCERPT: The Small Commercial Solar Gap
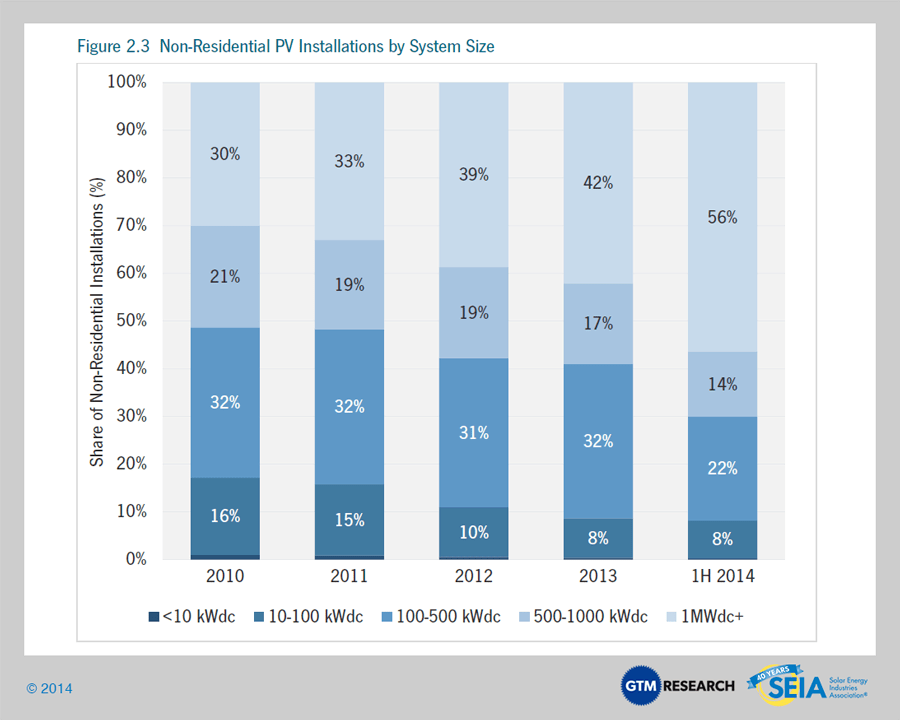
Though the availability of capital for non-residential solar has vastly increased over the past five years, it has remained exceedingly difficult to finance and develop small commercial solar projects. These projects often have varying contract terms, power purchasers without credit ratings or easily assessed creditworthiness, and site-specific project requirements. What’s more, the transaction costs associated with smaller commercial projects are nearly the same as those for much larger deals. These difficulties have often led developers to focus their attention on larger commercial projects, particularly those larger than 1 MWdc.
This dynamic has only become exacerbated over time. In 2010, 70% of all non-residential systems installed were less than 1 MW, whereas this category accounted for only 44% in the first half of 2014. The decline has been particularly stark for projects less than 100 kWdc in size, whose market share has been cut in half over the same period.
It is important for the market to improve in the small commercial arena, in no small part because the theoretical market potential for that segment is virtually boundless by today’s standards. Fortunately, we foresee a number of developments that should aid in this transition. First, states such as Massachusetts and New York are rolling out incentive programs with specific carve-outs for small commercial, recognizing the need for that segment to be treated independently. Second, we have seen a variety of companies seek out innovations to lower the administrative burden associated with financing small commercial through solutions such as project scores, online diligence tools, and investment platforms. Finally, some larger commercial developers have begun building small commercial assets on their own balance sheet as a proof-of-concept to attract third-party capital. We remain optimistic that the small commercial slump will ultimately reverse itself over the coming years.
Utility PV
- 625 MWdc installed in Q2 2014
- Drove more than 50% of national PV installations for the fifth straight quarter
In Q2 2014, the U.S. installed 625 MWdc of utility PV from 62 individual projects. The majority of this capacity (476 MWdc) came from the four largest projects, all developed by First Solar.
Beyond these large projects, the Q2 capacity was largely made up of two distinct project types: utility PV projects between 1 MWdc and 20 MWdc in nontraditional state markets (Indiana, Missouri and Rhode Island) and from longstanding procurement programs in California, including Southern California Edison’s Renewable Auction Mechanism (RAM) and Pacific Gas & Electric’s feed-in tariff program.
Both of these categories reflect a broader trend in the utility PV market, which has been the transition from large, centralized development toward smaller projects with specialized procurement. The project pipeline remains full of such projects, but as we discuss in greater detail in the full report, we believe a window of opportunity has reopened for larger projects.
Over the past twelve months, two factors have been reshaping the market and rebuilding the contracted pipeline to the highest levels in the market’s history. First, project developers have found gigawatt levels of new demand from utilities that have begun to recognize that utility-scale solar is either economically competitive with natural gas or is well suited to hedge against natural gas price volatility. Second, utilities in California have resumed procurement to meet their RPS obligations further into the future. On August 1, for example, Southern California Edison announced PPAs for more than 1,300 MWdc of PV, with contracts beginning in 2019 and 2020. This has created opportunities for a number of the formerly stranded assets that may now see success in later years.
2.1.2 FULL REPORT EXCERPT: Is Solar PV Mainstream?
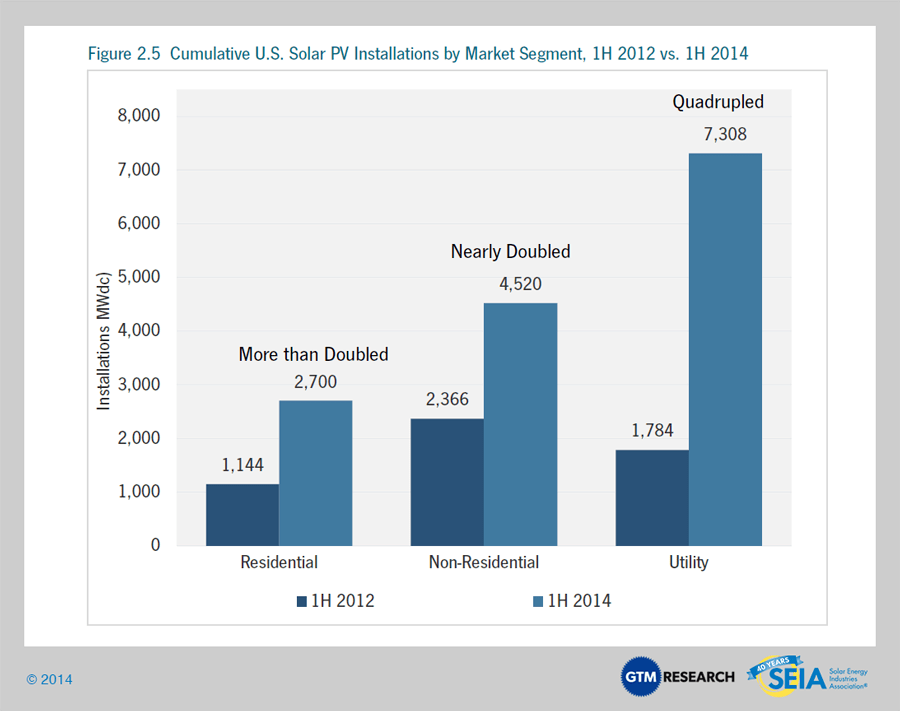
Over the past two years, solar PV has moved light years ahead of where it stood back in the first half of 2012. Between 1H 2012 and 1H 2014, cumulative residential and non-residential installations have both doubled, while cumulative utility PV installations have more than quadrupled.
But this top-level installation growth is not the only evidence of solar becoming increasingly mainstream within the broader energy landscape. Most notably, here are three key milestones achieved by the U.S. solar market during the first half of 2014.
- Gigawatts of PV now deemed bankable: As of 1H 2014, more than 1.5 GWdc of solar PV has or will be used to finance publicly traded investment vehicles, including YieldCos backed by solar plus securitized bonds specifically backed by residential PV.
- Utilities are beginning to enter the residential solar market: Last summer, Arizona’s solar market attracted industry attention and pushback due to the introduction of net metering fees. Now the two major utilities in Arizona (Arizona Public Service and Tucson Electric Power) are now the first utilities in the U.S. to formally propose plans to own rooftop solar on residential customers’ homes.
- Procurement of utility solar based on cost-competitiveness: As mentioned, over the past twelve months, ten utilities without RPS standards or ahead of RPS requirements have announced plans to procure a total of 3 GWdc of utility-scale solar due to its economic competitiveness in tandem with or in lieu of natural gas alternatives.
Although the U.S. solar market has more than doubled over the past two years, looking ahead, systemic challenges to growth loom both in the near term (e.g., the recent U.S.-China tariff decision) and medium term (e.g., the federal ITC’s scheduled dropdown at the end of 2016). Nevertheless, the first half of 2014 showcased innovative financing strategies, evolving utility business models, and solar’s increasing economic competitiveness with fossil fuels, all of which offer encouraging signs of the U.S. market’s ability to weather barriers to growth and further push solar PV into the mainstream.
2.3. National System Pricing
In the Q1 2014 edition of U.S. Solar Market Insight, we introduced a new methodology of capturing and reporting national system pricing. Our previous methodology used weighted average system pricing directly from utility and state incentive programs, but we have long felt that the data was not an ideal reflection of the current state of system pricing, as it often represented systems quoted well prior to the installation and connection date, and much of the reported data was based on fair-market-value assessments for TPO systems.
Our new bottom-up methodology is based on tracked wholesale pricing of major solar components and data collected from major installers, with national average pricing supplemented by data collected from utility and state programs. Starting with this report, we will no longer be reporting system prices state by state, although we will still continue to show reported system pricing from state and utility incentive programs.
2.2.1. National Residential System Pricing
Note: Detailed information about national system prices by market segment is available in the full report.
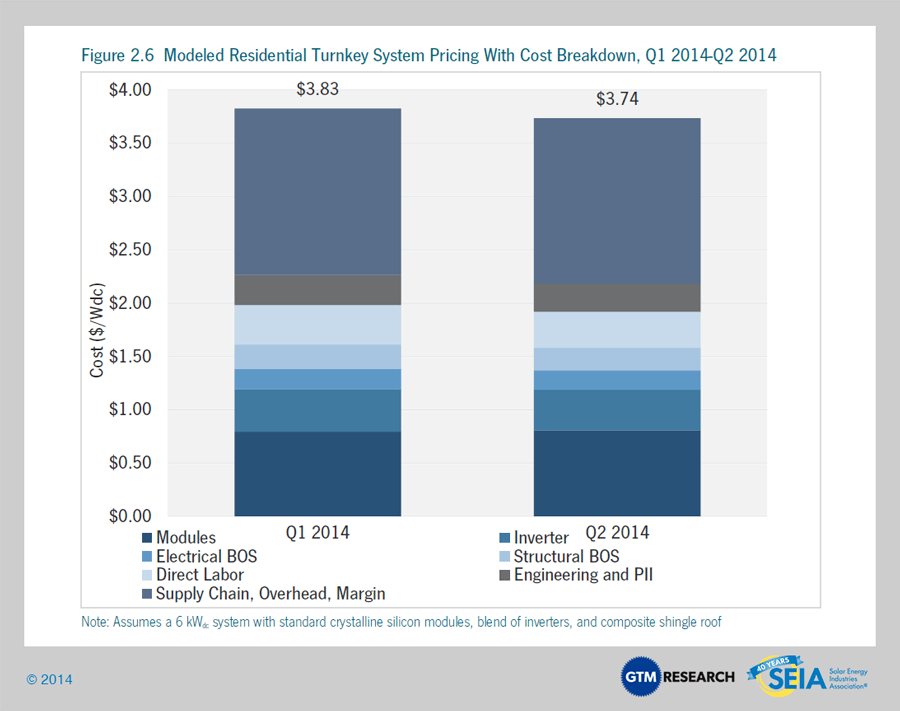
System pricing continues to sustain pressure across the full value chain as residential incentives continue to decline and more competitors target a slowing market in states like Arizona and Hawaii. Our modeled costs show blended average national residential systems pricing at $3.74/Wdc in Q2 2014, versus the revised modeled costs for Q1 2014 of $3.83/Wdc – a 2.4% quarter-over-quarter cost reduction. In general, cost reductions were incremental and somewhat countered by a slight uptick in modeled PV module prices. As described in the Full Report, structural balance-of-system costs continue to be one of the most heavily pressured hardware sectors, with racking vendors indicating large volume purchases in the low- to mid-teens per watt.
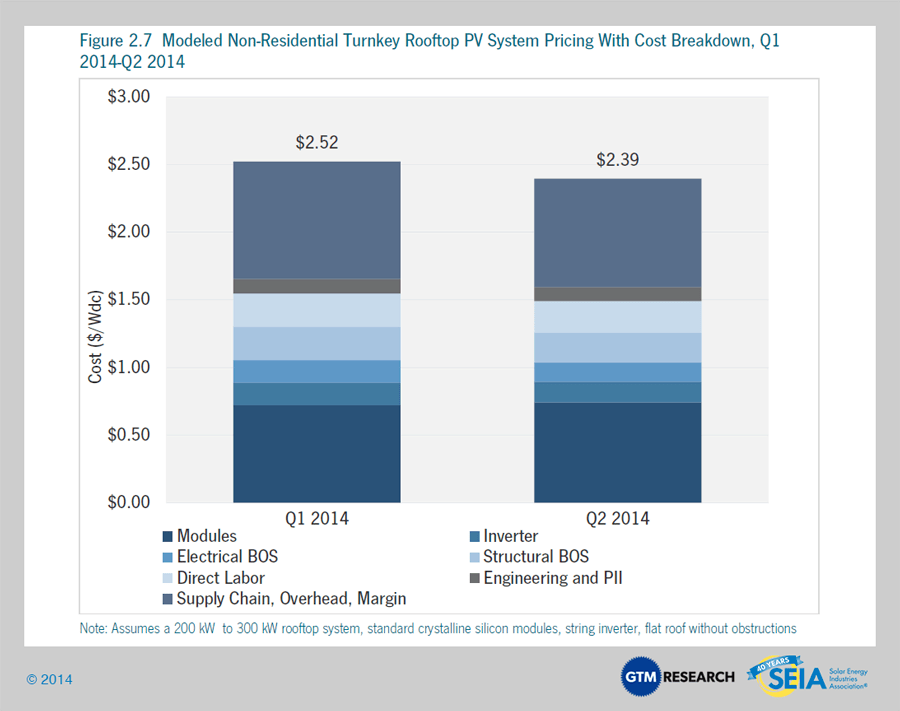
2.2.2. National Non-Residential System Pricing
Note: Detailed information about national system prices by market segment is available in the full report.
2.2.3. National Utility System Pricing
Note: Detailed information about national system prices by market segment is available in the full report.
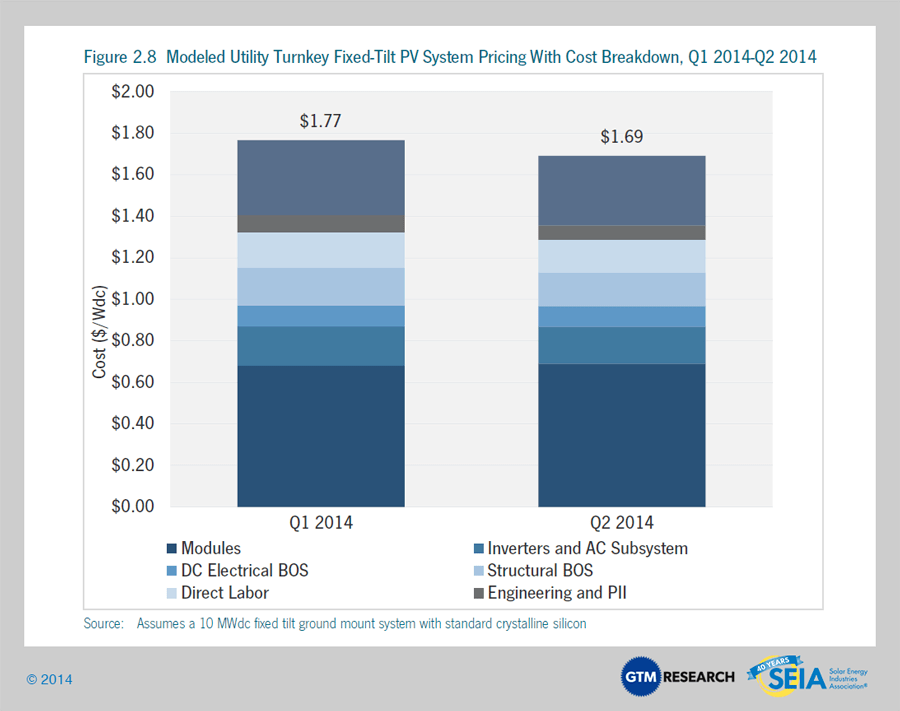
Unlike residential and non-residential systems, utility system pricing is rarely reported. As a result, our national capacity-weighted average incorporates publicly reported pricing where available, as well as input from utility developers and EPCs. National weighted-average system pricing for utility systems in Q2 2014 came in at $1.81/Wdc, a 2.2% drop from Q1 2014, reflecting continued construction efficiencies and competition in the U.S. utility market. This estimate includes both tracking and fixed-tilt projects.
We also find that costs for systems installed in Q2 2014 came in as low as $1.60/Wdc and as high as $2.05/Wdc. Low pricing reflects strong competition in new markets that has pushed component and EPC margins significantly downward. High pricing reflects systems with legacy PPAs and higher-cost components like single-axis tracking.2.3.Component Pricing
Note: Detailed information about national system prices by market segment is available in the full report.
2.3.1. Polysilicon, Wafers, Cells and Modules, Q2, 2014
Blended polysilicon pricing in the second quarter of 2014 increased by 2% quarter-over-quarter to $22/kg, while wafer pricing decreased by 4% to $0.23/W, mostly due to buildup of excess inventory in the early part of the year. Cell pricing also declined by 5% quarter-over-quarter to levels of $0.42/W, reflecting significantly lower demand for Taiwanese cells following new tariff rulings on imports of Chinese and Taiwanese solar products into the U.S. in the month of June.
Module pricing in the U.S. differs widely based on order volume, producer region and individual firm. Delivered prices for Chinese modules in Q2 2014 ranged from $0.67/W on the low side (corresponding to order volumes greater than 10 MW for less established firms) to $0.72/W on the high side (established, bankable firms, order volumes less than 1 MW). Prices for European, U.S. and Japanese modules (selling mostly into the residential and small commercial sector) were notably higher at $0.78 to $0.85/W. A few Taiwanese and Korean suppliers were offering pricing in between these two bands ($0.75 to $0.80/W), albeit at limited volumes. Pricing for Chinese modules has increased in Q3 2014 due to the announcement of preliminary countervailing duties on Chinese modules and antidumping duties on Chinese and Taiwanese cells and modules, with quotes in mid-Q3 ranging from $0.73/W to $0.76/W. The most popular sourcing strategy currently being adopted by Chinese suppliers to mitigate cost increases from the new tariffs involves shipping all-Chinese product to the U.S. and paying the 2012 tariff on Chinese cell imports (30.7% for most firms).

2.4 Market Outlook
We expect another strong year for the U.S. PV market in 2014, with installations reaching 6.5 GWdc, a 36% increase over 2013. The fastest growth will come from the residential segment (55% year-over-year), followed by the utility segment (37%), and the non-residential segment (21%). Most notably, we increased our utility forecast for 2014 as a result of greater pipeline visibility and lowered our non-residential outlook, in part driven by a downturn in Arizona and weak growth in New Jersey.
Forecast details by state (31 states) and market segment through 2018 are available in the full report.
3. Concentrating Solar Power
The final quarter of 2013 kicked off the first wave of mega-scale CSP projects to be completed over the next few years, and Q1 2014 built on that momentum with 517 MWac brought on-line. This includes BrightSource Energy’s 392 MWac Ivanpah project and the second and final 125 MWac phase of NextEra’s Genesis solar project. While Q2 2014 was dormant for CSP, a total of 857 MWac is expected to be completed by year’s end, making 2014 the largest year ever for CSP. The next notable project slated for completion is SolarReserve’s 110 MWac Crescent Dunes, which entered the commissioning phase in February 2014. Major CSP project development highlights in Q2 2014 can be found in the following table.
Acknowledgments
U.S. Solar Market Insight® is a quarterly publication of GTM Research and the Solar Energy Industries Association (SEIA)®. Each quarter, we collect granular data on the U.S. solar market from nearly 200 utilities, state agencies, installers, and manufacturers. This data provides the backbone of this U.S. Solar Market Insight® report, in which we identify and analyze trends in U.S. solar demand, manufacturing, and pricing by state and market segment. We also use this analysis to look forward and forecast demand over the next five years. All forecasts are from GTM Research; SEIA does not predict future pricing, bid terms, costs, deployment or supply.
* References, data, charts or analysis from this executive summary should be attributed to “GTM Research/SEIA: U.S. Solar Market Insight®.”
* Media inquiries should be directed to Mike Munsell ([email protected]) at GTM Research and Ken Johnson ([email protected]) at SEIA.
* All figures are sourced from GTM Research. For more detail on methodology and sources, visit www.gtmresearch.com/solarinsight.
Our coverage in the U.S. Solar Market Insight reports include 30 individual states and Washington, D.C. However, the national totals reported include all 50 states, Washington, D.C., and Puerto Rico.
Detailed data and forecasts for all 30 states are contained within the full version of this report, available at www.greentechmedia.com/research/ussmi.
AUTHORS
GTM Research
Cory Honeyman, Solar Analyst
Nicole Litvak, Solar Analyst
Shayle Kann, Senior Vice President
Shyam Mehta, Lead Upstream Analyst
MJ Shiao, Director of Solar Research
Jade Jones, Solar Analyst
SEIA
Tom Kimbis, Vice President
Justin Baca, Director of Research
Shawn Rumery, Research Manager
Aaron Holm, Research Analyst