Solar Market Insight Report 2015 Q2
Purchase the Full Report | Press Release
The quarterly SEIA/GTM Research U.S. Solar Market Insight™ report shows the major trends in the U.S. solar industry. Learn more about the U.S. Solar Market Insight Report.
Key Figures
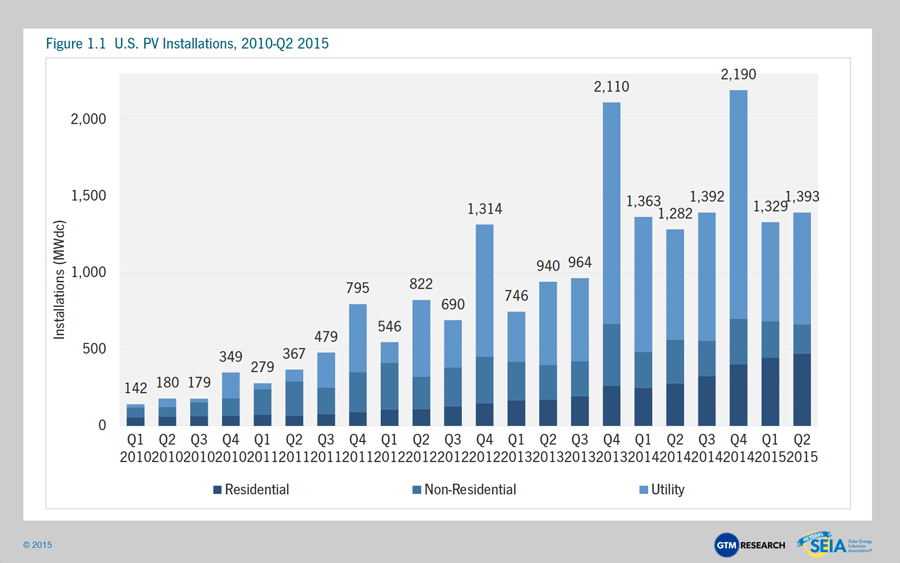
- The U.S. installed 1,393 MWdc of solar PV in Q2 2015, marking the seventh consecutive quarter in which the U.S. added more than 1 GWdc of PV installations.
- Q2 2015 was a milestone quarter for the U.S. solar PV market, with cumulative installations eclipsing the 20 GWdc mark.
- Throughout the first half of 2015, 40% of all new electric generating capacity brought on-line in the U.S. came from solar.
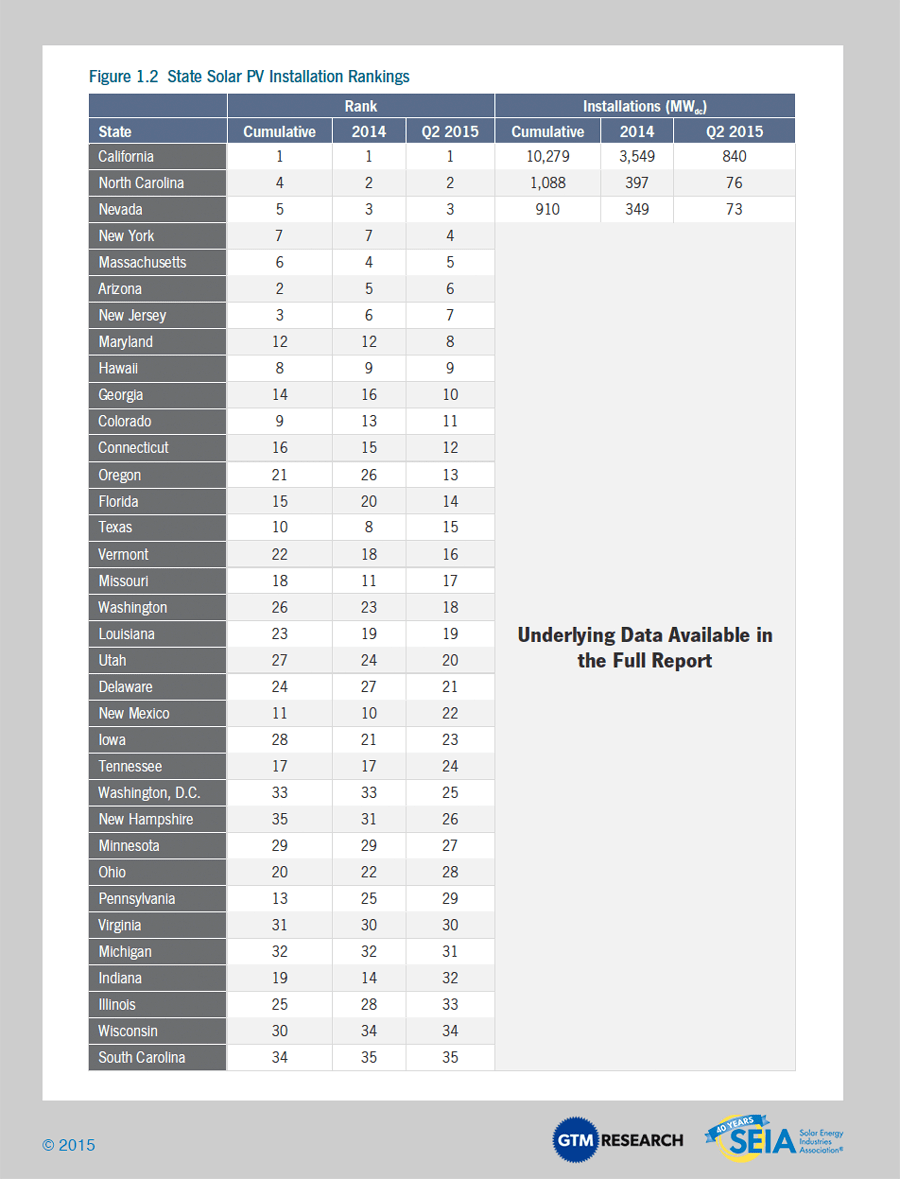
- 21 states have now added more than 100 MWdc of solar PV, but the top five states still account for nearly three-fourths of cumulative U.S. PV installations.
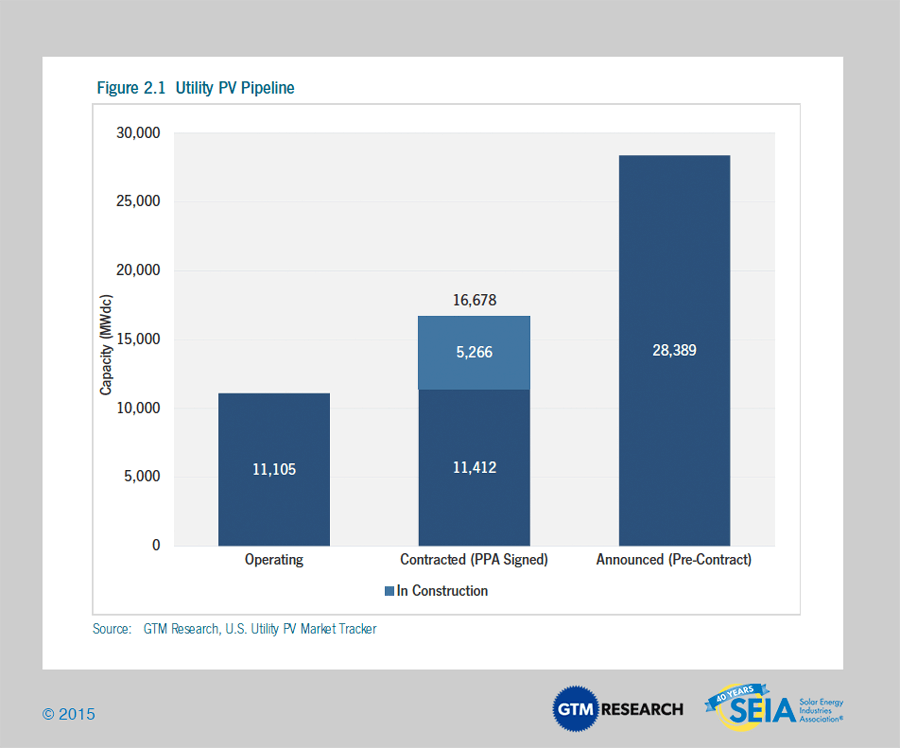
- 40% of the 16.6 GWdc utility PV pipeline in development has been procured primarily due to solar’s economic competitiveness with fossil-fuel alternatives.
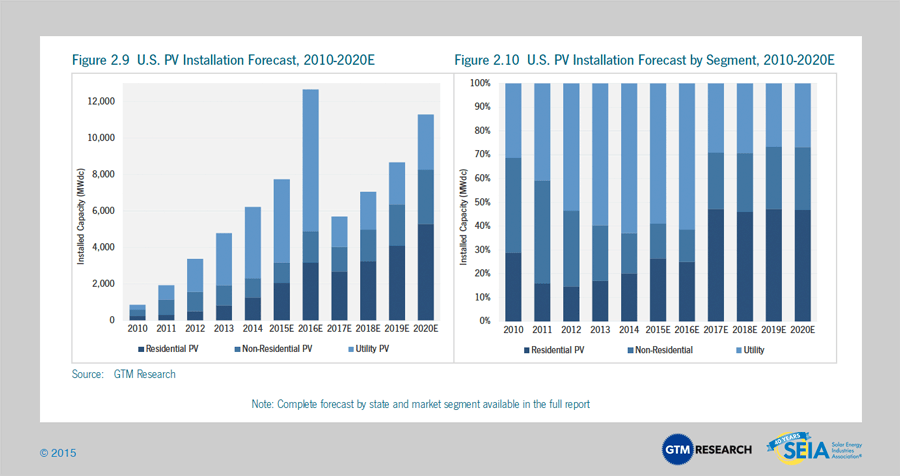
- We forecast that PV installations will reach 7.7 GWdc in 2015, up 24% over 2014. Growth will occur in all segments, but will be most rapid in the residential market.
- 2014 was the largest year ever for concentrating solar power, with 767 MWac brought on-line. The next notable CSP project slated for completion is SolarReserve’s 110 MWac Crescent Dunes, which entered the commissioning phase in 2014 and is expected to become fully operational before the end of 2015.
1. Introduction
The U.S. solar market continues on its pace for a record-breaking year, with 1,393 MWdc in the second quarter of the year, bringing the market up to 2,722 MWdc in the first half. The second half of the year should be significantly larger than the first in terms of new deployments. We anticipate a bevy of utility-scale project completions, combined with a continued ramp in the residential market and a commercial solar resurgence in select states to bolster installations through the rest of the year.

We believe the following three stages will define the next decade for the U.S. solar market:
- Stage 1 (Today-2016): The first stage, which extends through the end of 2016, will bring an unprecedented boom in solar installations. Across all segments and most state markets, improved project economics, low interest rates, insulation from incentive reduction and the rush to complete projects ahead of the ITC step-down will accelerate an already-growing market to new heights. Between July 2015 and December 2016, the U.S. solar PV market is expected to add 18 GWdc, which would exceed cumulative installations through the first half of 2014.
- Stage 2 (2017-2019): Assuming no ITC extension, the second stage contains the most uncertainty in our forecast period. Five macro factors will be at play, pushing the market in different directions.
- First, the ITC rush of 2016 will be over, and project pipelines for commercial and utility-scale developers will be lighter. Some projects that were intended for 2016 may spill over into 2017, but we anticipate a dearth of new larger-scale projects at the beginning of stage 2
- Second, project economics will be significantly tighter as a result of ITC reduction (to 10% for commercial, utility and third-party owned residential, and to zero for host-owned residential).
- Third, interest rates could conceivably rise during this period, putting upward pressure on the cost of capital for solar projects.
- Fourth, the Clean Power Plan will not yet have taken full effect. The first compliance date for the CPP is 2022, but the rule issued by the EPA includes a Clean Energy Incentive Program intended to support renewable energy installations in 2020 and 2021. One unintended consequence of this program, if it is left unchanged, is that states may design their policies to support solar/wind installations in those years, even at the expense of earlier years (2017-2019), since those earlier installations won’t receive the same credit.
- Finally, despite these headwinds, solar project costs will continue to fall and increasingly large pockets of demand will remain open. The overall market may decline substantially year-over-year in 2017, but growth from the new, smaller smaller base will resume thereafter.
- Stage 3 (2020-2025): The third stage will usher in a new era of growth for solar in the U.S. The beginning of the Clean Power Plan (CPP) compliance era will incentivize states to support (directly or indirectly) the solar market. Meanwhile, project costs will be significantly below today’s levels, placing solar on a strong competitive playing field with both retail electricity and alternative sources of wholesale generation. Much of the uncertainty from stage 2 will have been settled, and market participants will experience a more extended period of consistent expansion. Most notably, this period will also likely be the time during which solar in the U.S. truly becomes a 50-state market, as the combination of CPP compliance and improving project economics will open up state markets that historically have seen very limited solar development.
These stages will also be marked by a growing number of states redesigning their electricity markets to accommodate the growth of distributed energy resources. While today’s focus is on states such as New York (through the REV initiative) and California (through AB 327 and its offshoots), other states will undoubtedly follow. And our expectation is that many states will be engaged in, if not already implementing, similarly transformational processes over the next decade. For this reason alone, it will be an exciting time to monitor the solar market.

2. Photovoltaics
2.1.1 Market Segment Trends
Residential PV
Key Figures
- Up 6% over Q1 2015
- Up 70% over Q2 2014
The residential PV market continued apace in Q2 2015, notching 6% quarterly growth and once again setting a new record for the largest quarterly total in its history. California’s share of the national market fell slightly to 49% in Q2 as that market stayed flat, while New York, Massachusetts, New Jersey and Maryland all saw quarterly growth. Notably, 10 individual states each installed more than 10 MWdc of residential solar in the second quarter of the year – the first time this milestone has been reached.
Non-Residential PV
Key Figures
- Down 20% from Q1 2015
- Down 33% from Q2 2014
The non-residential market’s struggles continued in the second quarter, as the market fell 20% from Q1 and quarterly installation volumes dipped below 200 MWdc – the sector’s lowest quarterly total in four years. This was primarily due to California, Massachusetts and New Jersey, which all fell significantly quarter-over-quarter. New Jersey in particular has struggled and appears to have hit its nadir. Only 6.5 MWdc of non-residential solar were installed in the state in Q2, down from a peak of 79 MWdc in Q2 2012.
However, it is worth noting that corporate procurement overall has been relatively strong, thanks to an influx of “offsite C&I” projects such as those that will be feeding data centers, some university campuses, hospitals and other large end users or campuses. We classify these as utility-scale (and they are often >50 MWdc), but they do represent one means for large customers to access the solar market.
Utility PV
Key Figures
- 9th consecutive quarter in which utility PV added at least half a GWdc
- Contracted utility PV pipeline currently totals 16.6 GWdc
The utility PV market continues to serve as the bedrock driver of U.S. solar installations, accounting for 52% of capacity installed in Q2 2015 across all three market segments. Looking ahead to the second half of 2015, utility PV market growth will increasingly be characterized by projects procured for reasons other than a utility meeting the requirements of its renewable portfolio standard.
Key trends to keep an eye on include development of utility PV projects that leverage the Public Utility Regulatory Policies Act to secure PPAs priced at utilities’ avoided costs of peaking generation; corporate procurement of offsite solar via direct access programs or power hedge contracts; and the emergence of Texas plus Southeast state markets, where utilities are displacing coal fleets with natural gas and solar. Underlying all of these new market drivers is the fact that utility PV is now an economically competitive resource to meet utilities’ peak power needs, a value proposition that came into play last year and continues to spread across established and nascent state markets.

With less than 16 months until the federal ITC is scheduled to drop from 30% to 10% for the utility PV segment, the pipeline of projects currently in development is unprecedented in terms of size, totaling 16.6 GWdc. While developers’ timelines to complete ambitious project pipelines are increasingly tight, the uptick in construction activity has been an encouraging indicator of the segment’s aggressive growth trajectory through 2016. Total capacity under construction has increased by more than 600 MWdc since Q1 2015, and now totals more than 5 GWdc for the first time ever.
2.1.2 Full Report Excerpt | Highlight: Sizing the Solar-Plus-Storage Market
The U.S. solar-plus-storage market is very nascent today – less than 0.1% of 2014 solar PV installations were paired with storage. In fact, the penetration rate of storage in solar installations has gone down year-over-year for the past three years, although the overall solar-plus-storage market has been flat in capacity terms. But in spite of this small share, industry activity and discussion around this technology combination has been frantic.
There are a number of drivers for the increased level of industry and customer interest. Several technologies, led by lithium-ion, continue on rapid commercialization paths, bringing down costs and providing one of the biggest drivers for the industry.

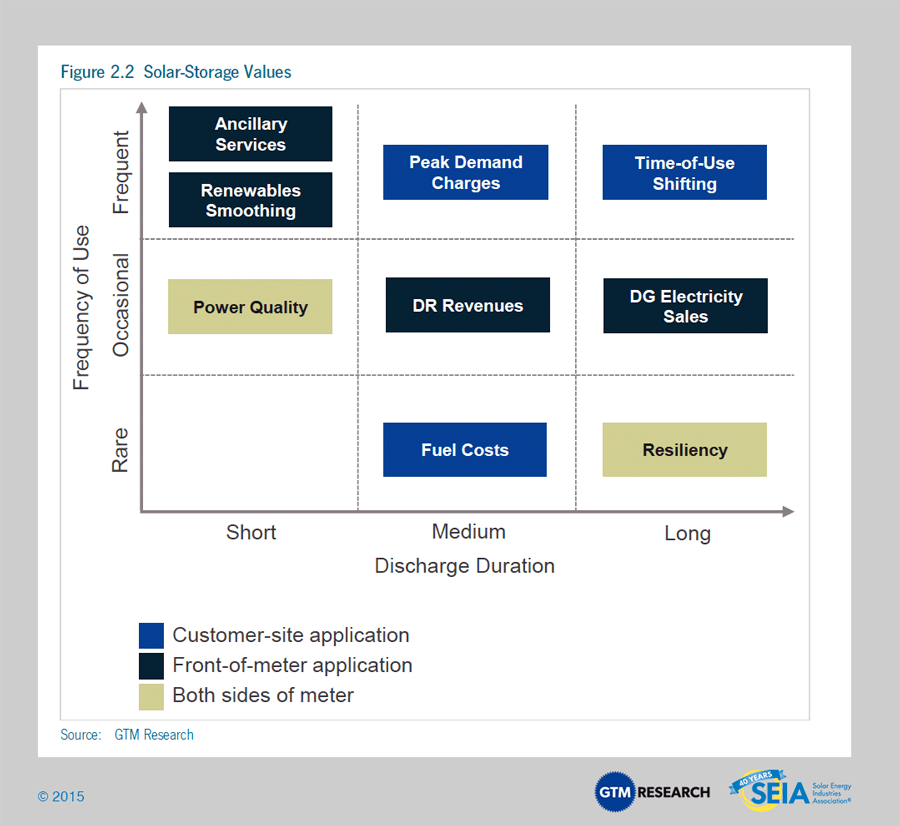
Along with cost reduction, solar-plus-storage value streams continue to advance from traditional backup to multiple use cases. These benefits vary in three ways – frequency of use, discharge duration, and key beneficiary. Generally speaking, benefits that have more frequent use improve the overall economics of the system. These benefits are not necessarily mutually exclusive, although there are limitations based on technology, availability of charge, frequency and timing of multiple applications. Apart from the technical constraints, front-of-meter benefits have generally not been monetized, except in a few markets at pilot scale. Market rules and policies are still evolving in reaction to the proliferation of distributed energy resources. But across the major state markets with attractive incentive landscapes, the value proposition of solar-plus-storage varies by customer segment. The use cases can range from homeowners optimizing rooftop solar compensation in response to NEM reforms and time-of-use retail rates to peak demand shaving for commercial customers. As electricity market designs are re-evaluated, such as in New York’s REV program, storage both behind and in front of the meter is poised to provide services to both the end customer and the grid as a capacity resource.
Solar-plus-storage deployments totaled 4 MWdc in 2014, but GTM Research expects them to grow to 22 MWdc in 2015 and reach 769 MWdc by 2020. California is expected to be the biggest solar-plus-storage market, with 422 MWdc installed in 2020 alone. In dollar terms, we expect the market to grow to $246 million in 2015 and $643 million in 2016. By 2020, the annual U.S. solar-plus-storage market will be $3.1 billion.
2.2 National Solar PV System Pricing
As was true over the last year of U.S. Solar Market Insight reports, we continue to utilize a bottom-up methodology to capture and report national system pricing. Though we continue to solicit weighted-average system pricing directly from utility and state incentive programs, we believe that this data no longer accurately reflects the current state of system pricing, as it often represents systems quoted well prior to the installation and connection date, and much of the reported data is based on fair-market-value assessments for TPO systems.
Our bottom-up methodology is based on tracked wholesale pricing of major solar components and data collected from major installers, with national average pricing supplemented by data collected from utility and state programs. While we will no longer be reporting system prices state by state, we will still continue to show reported system pricing from state and utility incentive programs.

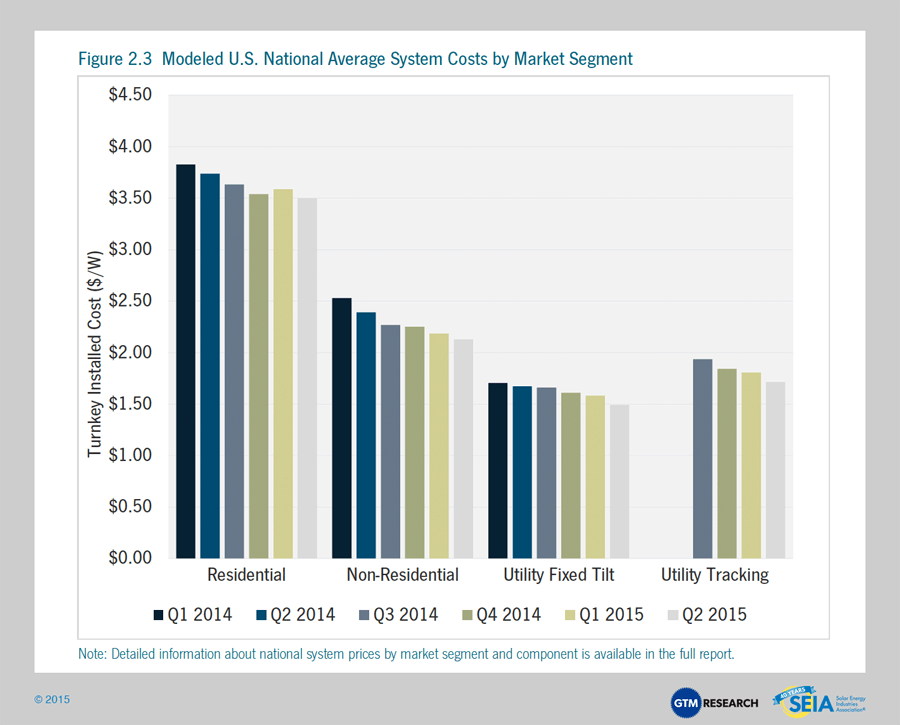
Year-over-year, system pricing has fallen by 6% to 11%, with the largest declines in the non-residential sector. Module pricing in the U.S. has continued to decline incrementally, falling year-over-year by 6.8%, while balance-of-system costs remain the primary driver of overall system cost declines. Hardware vendors continue to report significant pressure over the past year, although “soft-cost” reductions have remained relatively in step with hardware-cost reductions.
Quarterly trends show a 2% to 6% decline in system prices across market segments, underscoring a continuing incremental stepdown in national system pricing on an aggregate basis. Markets with a large footprint, such as California, continue to have a disproportionate effect on overall national average pricing, which can vary by as much as 20% from state to state. Variations in utility system costs are much smaller than variations in residential and non-residential costs.
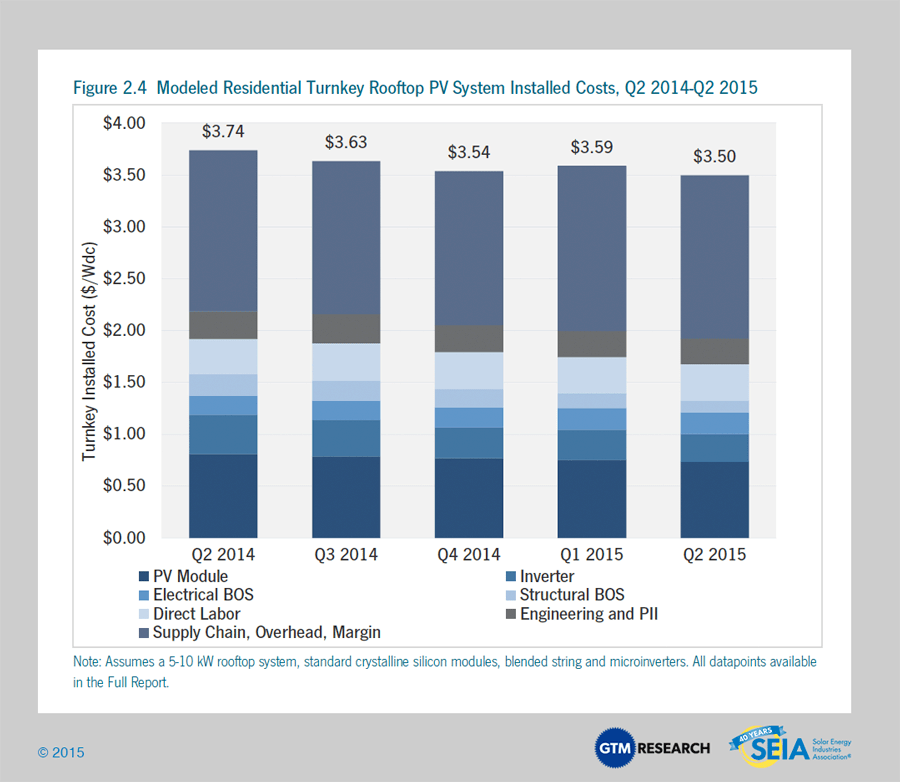
2.2.1 National Residential System Pricing
Note: Detailed breakdown of national residential system prices by market segment and component are available in the full report.
Modeled national residential PV system pricing in Q2 2015 has fallen by a modest 2.5% over Q1 2015 and 6% from Q2 2014 levels. As with previous quarters, this pricing continues to reflect a blend of systems using microinverters and string inverters to home in on a more representative “average” price. In the past year, hardware pricing has fallen by 16%, with PV inverter and racking pricing continuing to fall in the wake of stiff competition and the continuation of weak markets outside of the U.S.
Note that large disparities in system pricing exist due to the size of projects, the size of the installation company, and, to a significant degree, what the local market will bear. In regions with high retail electricity rates, overall system pricing may be higher despite similar hardware costs. In terms of hardware costs, three major factors drive estimated differences:
- Premium PV module-based systems, including high-efficiency modules, which can command prices 25% to 35% higher than standard efficiency crystalline silicon modules
- Microinverters, which lead to a 8% to 20% premium on the overall system cost due to additional hardware costs
- Structural balance-of-system requirements, especially in high-wind-zone areas or on clay tile roofs, which can drive the materials and cost of racking and mounting hardware up by 50%

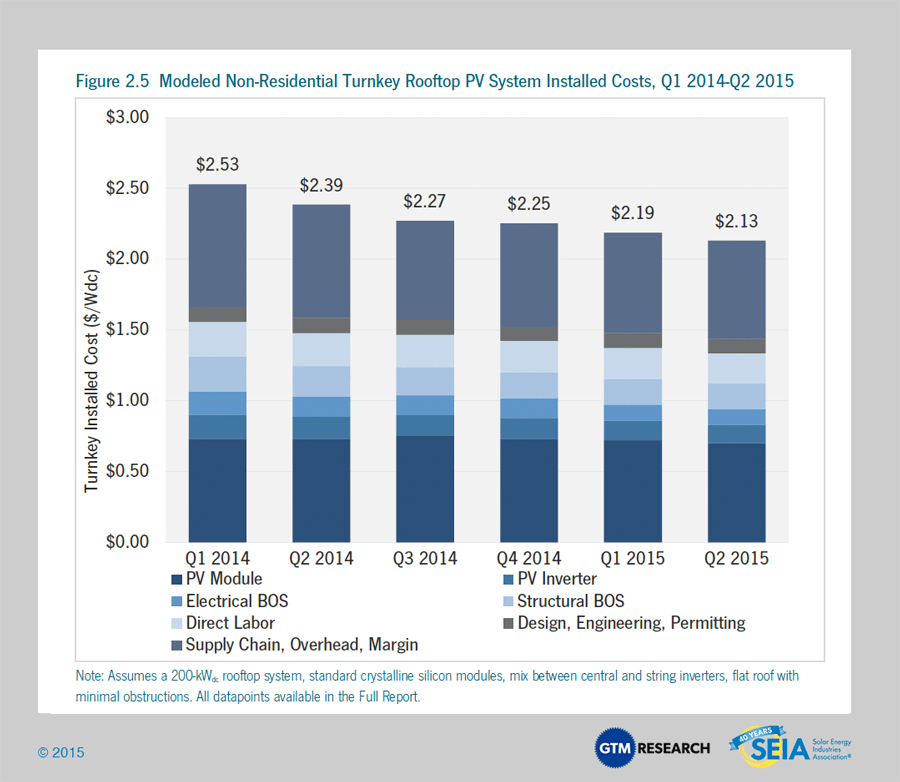
2.3 National Non-Residential System Pricing
Note: Detailed breakdown of national residential system prices by market segment and component are available in the full report.
In addition to the various forms of reporting methodologies, the category “non-residential” tends to capture a grab bag of differing project types, from large commercial ground-mount systems with costs approaching those of utility systems to small-scale carport projects with cost structures closer to residential systems. Furthermore, “non-residential” also captures projects installed for both private and public organizations, with the latter often incurring additional permitting and overhead costs. As with residential, we work closely with component manufacturers and installers to build a bottom-up model to better reflect typical turnkey installed costs.
Our model shows flat-roof non-residential system costs at $2.13/Wdc, representing a 3% decrease quarter-over-quarter. We continue to note that hardware costs in non-residential systems account for just over 50% of total installed costs. While considerably less than residential soft costs, commercial supply chain, overhead, and margins are similarly the single largest cost category. Competition among project buyers, including YieldCos and traditional IPPs, coupled with an anticipated surge ahead of the end of 2015 and 2016, continue to support EPC margins.

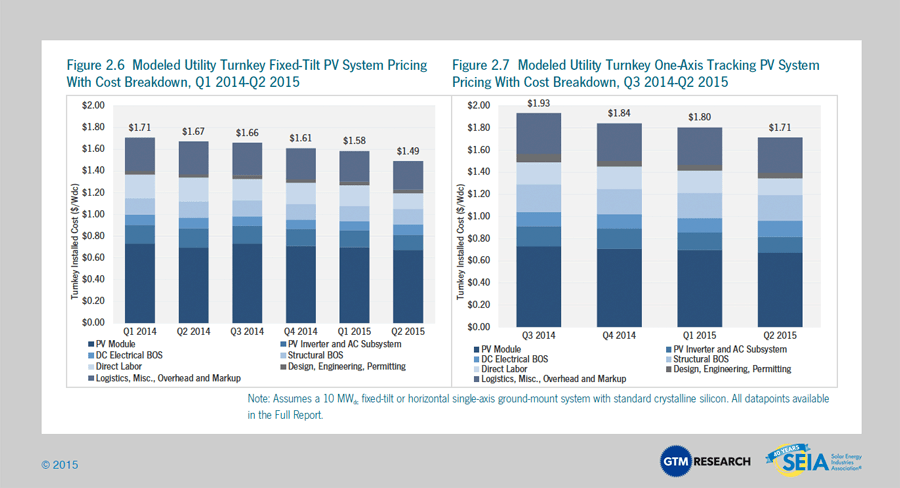
2.4 National Utility System Pricing
Note: Detailed breakdown of national residential system prices by market segment and component are available in the full report.
Modeled costs of a fixed-tilt utility system landed at $1.49/Wdc in Q2 2015, reflecting another drop from the previous quarter’s $1.58/Wdc pricing. Hardware pricing continues to be heavily pressured as developers sign low-cost PPAs. Similarly, one-axis tracking project costs dropped from $1.80/Wdc last quarter to $1.71/Wdc – a 5% reduction. While fixed-tilt systems continue to be a popular option among developers building smaller-scale “cookie-cutter” projects, tracking has become the dominant racking technology in the ground-mount space. In Q2 2015, we estimate that nearly 70% of installed utility capacity was installed with one-axis tracking technology.

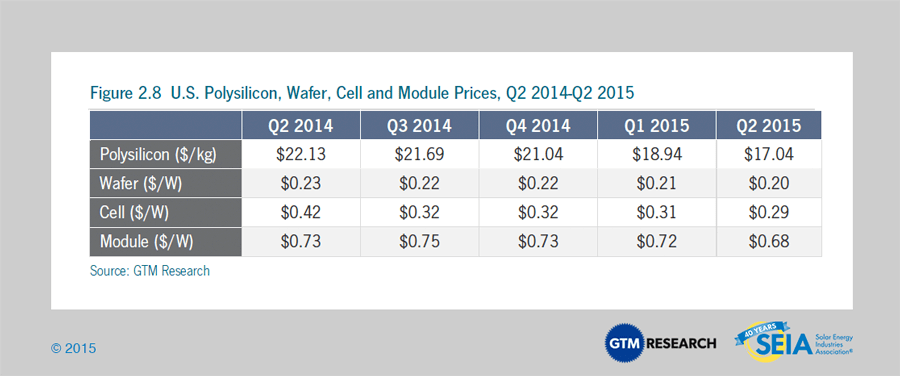
2.5 Component Pricing
2.5.1 Polysilicon, Wafers, Cells and Modules
Pricing for polysilicon and PV components fell quarter-over-quarter in the second quarter of 2015. Significant polysilicon price reduction was driven by increased inventory and seasonally weak demand, with prices falling 10% sequentially to $17.04/kg. U.S. polysilicon producer REC Silicon claims that customers have leveraged the closing of the trade loophole to obtain lower prices. Similar to polysilicon, weak demand levels and pressure from buyers to keep prices low as module prices continued to fall affected wafer and cell prices, which fell 5% to $0.20/W and 7% to $0.29/W, respectively, in Q2 2015.
It should be noted that following the U.S. imposition of antidumping duties on Taiwanese cells and modules, Chinese producers switched from using Taiwanese cells in U.S.-bound modules to using Chinese cells. Previously, prices for Taiwanese-produced cells were relevant to determining the price for a U.S.-bound, Chinese-produced module (in the period Q2 2012 to Q3 2014), but at the current juncture, prices and tariffs on Chinese-produced cells are driving module prices.
Module pricing in the U.S. differs widely based on order volume, producer region and individual firm. During the second quarter, delivered prices for Chinese modules ranged from $0.65/W on the low side (corresponding to order volumes greater than 10 MW for less established firms) to $0.70/W on the high side (established, bankable firms; order volumes of less than 1 MW). Blended delivered pricing for Chinese modules is estimated to have dropped 6% quarter-over-quarter to $0.68/W, down 7% from this time one year ago.
In July 2015, the U.S. Department of Commerce filed its final review of the import tariffs on Chinese cells into the U.S. market. The final ruling set the cumulative duty at 30.61% for most major suppliers (21.70% for Yingli). This was roughly 75% higher than the preliminary duties suggested and was largely consistent with the original duties that set rates at 30.66%. The final ruling proved disappointing for Chinese producers, which were hoping tariff rates would decrease and enable them to price all-Chinese products more competitively in the market while maintaining reasonable margins. Looking forward, producers that have invested in building tariff-free supply will have more opportunity to price more competitively than firms relying on all-Chinese products.

2.6 Market Outlook
We expect another record year for the U.S. PV market in 2015, with installations reaching 7.7 GWdc, a 24% increase over 2014. The fastest growth will come from the residential segment, which is on pace to add more than 2 GWdc for the first time ever, following a year in which the segment installed more than 1 GWdc for the first time as well. The non-residential PV market will grow by 8% and utility PV will grow by 16%, with the latter market segment fueling more than 50% of all installations brought on-line for the fourth consecutive year.
On January 1, 2017, the 30% federal Investment Tax Credit (ITC) is scheduled to drop to 10% for third-party-owned residential, non-residential, and utility PV projects under Section 48 of the tax code, while the credit for purchases of residential PV under Section 25d is scheduled to expire entirely. Given that, solar installers and developers will aim to bring as much capacity on-line as possible before the scheduled stepdown. Solar development will continue, but some markets will fare better than others, and resumption of growth after 2017 will look different from the growth seen over the past eight years. For all market segments, the total addressable market will shrink post-2016, some states will fall off the solar map entirely, and resumption of growth at a national level will be due to several states with strong economics.
The utility-scale market shows the most dramatic drop in 2017, not only because of the challenges posed by the lower ITC, but also because project developers have largely turned their attention to bringing their contracted projects on-line before the end of 2016 in order to capture the full 30% credit. Many of these projects have long-term PPAs that begin in 2017 or later but will sell electricity either through short-term PPAs or on the spot market to bridge the gap between their commercial operation date and the beginning of their long-term PPAs. This pull-in of the utility solar pipeline will render the ITC cliff dramatic. Overall, installations are expected to drop 55% in 2017.
Forecast details by state (32 states plus Washington, D.C.) and market segment through 2020 are available in the full report.

3. Concentrating Solar Power
The final quarter of 2013 kicked off the first wave of mega-scale CSP projects to be completed over the next few years, and Q1 2014 built on that momentum with 517 MWac brought on-line. This included BrightSource Energy’s 392 MWac Ivanpah project and the second and final 125 MWac phase of NextEra’s Genesis solar project. While Q2 2014 and Q3 2014 were dormant for CSP, Abengoa finished commissioning its 250 MWac Mojave Solar project in December 2014. As a result, 2014 ranked as the largest year ever for CSP, with 767 MWac brought on-line. The next notable project slated for completion is SolarReserve’s 110 MWac Crescent Dunes project, which entered the commissioning phase in February 2014 and is now expected to become fully operational before the end of 2015.
In 2016, growth prospects for the CSP market in the U.S. are bleak. On one hand, CSP paired with storage represents an attractive generation resource for utilities, offering a number of ancillary and resource-adequacy benefits. However, due to extensive permitting hurdles that have confronted CSP projects, developers are putting their CSP pipelines on hold given the short window to bring projects on-line before the federal ITC is scheduled to drop at the end of 2016. Most notably, Abengoa’s Palen Solar project, BrightSource’s Hidden Hills project, and SolarReserve’s Rice Solar project are all delayed indefinitely.
Beyond 2016, the outlook for the CSP market will depend on further progress made toward mitigating early-stage development hurdles, lowering hardware costs, and strengthening the ancillary and capacity benefits provided by CSP paired with storage.
Acknowledgments
U.S. Solar Market Insight® is a quarterly publication of GTM Research and the Solar Energy Industries Association (SEIA)®. Each quarter, we collect granular data on the U.S. solar market from nearly 200 utilities, state agencies, installers, and manufacturers. This data provides the backbone of this U.S. Solar Market Insight® report, in which we identify and analyze trends in U.S. solar demand, manufacturing, and pricing by state and market segment. We also use this analysis to look forward and forecast demand over the next five years. All forecasts are from GTM Research; SEIA does not predict future pricing, bid terms, costs, deployment or supply.
References, data, charts or analysis from this executive summary should be attributed to “GTM Research/SEIA: U.S. Solar Market Insight®.”
* Media inquiries should be directed to Mike Munsell ([email protected]) at GTM Research and Alexandra Hobson ([email protected]) at SEIA.
* All figures are sourced from GTM Research. For more detail on methodology and sources, visit www.gtmresearch.com/solarinsight.
Our coverage in the U.S. Solar Market Insight reports include 30 individual states and Washington, D.C. However, the national totals reported include all 50 states, Washington, D.C., and Puerto Rico.
Detailed data and forecasts for all 30 states are contained within the full version of this report, available at www.greentechmedia.com/research/ussmi.
AUTHORS
GTM Research
SEIA