Solar Market Insight Report 2016 Year In Review
Purchase the Full Report | Press Release
The quarterly SEIA/GTM Research U.S. Solar Market Insight™ report shows the major trends in the U.S. solar industry. Learn more about the U.S. Solar Market Insight Report.
Key Figures
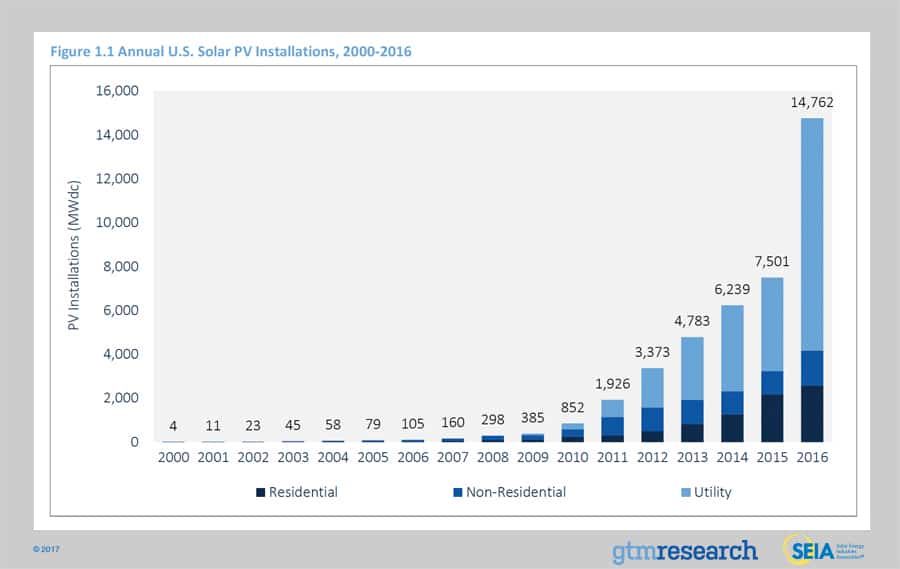
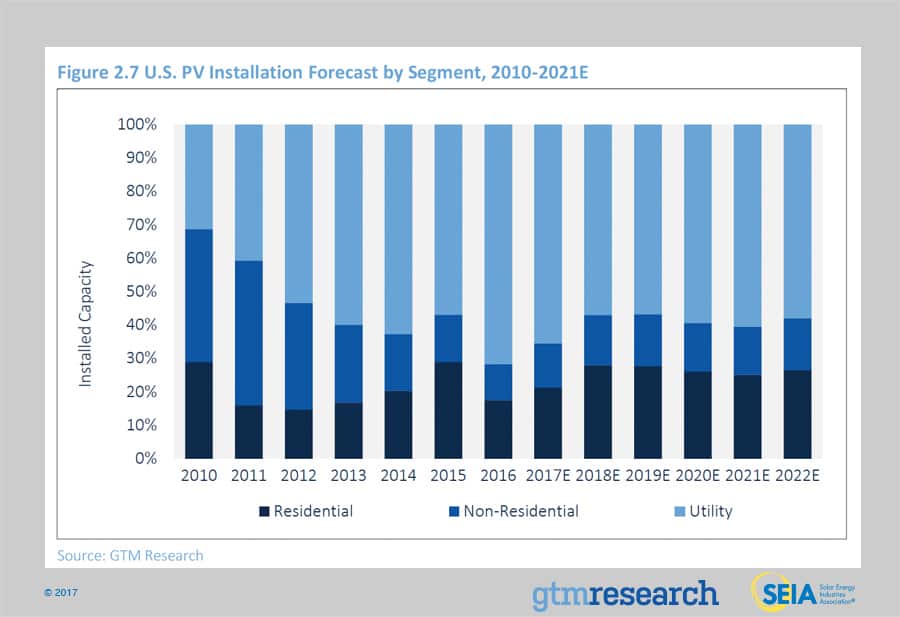
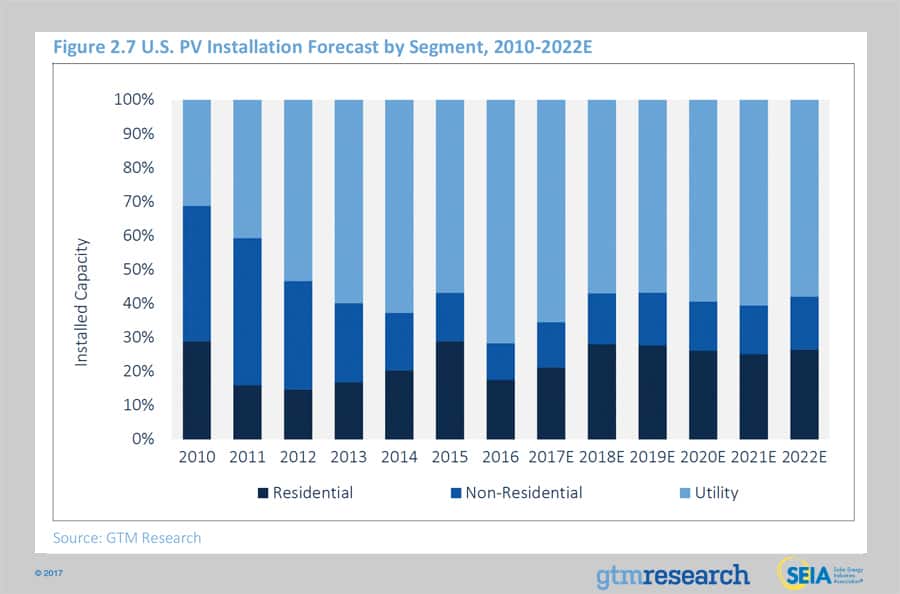
- In a record-breaking year for solar, the U.S. market installed 14,762 MWdc of solar PV in 2016 – nearly doubling the capacity installed in 2015. Growth was primarily driven by the utility PV segment, which installed more in 2016 than the entire market in 2015.
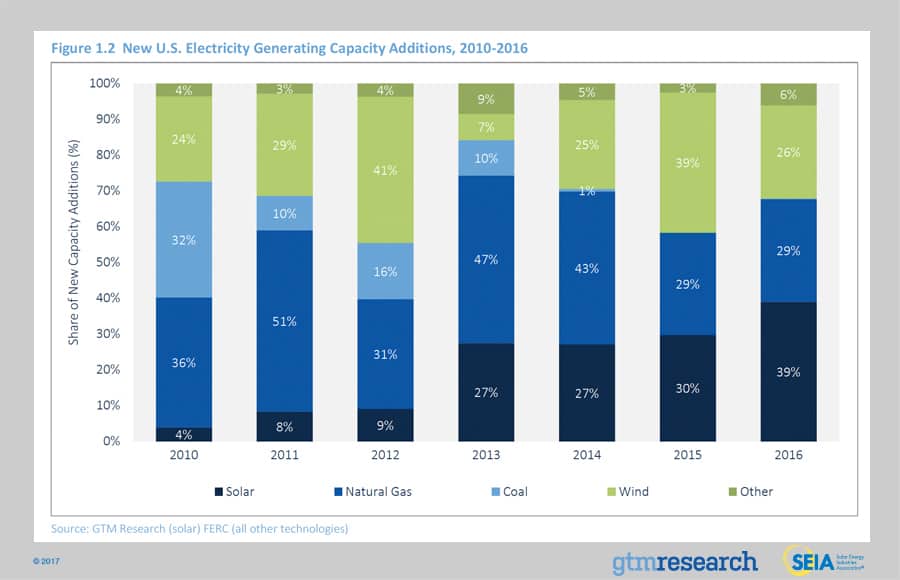
- For the first time ever, solar ranked as the No. 1 source of new electric generating capacity additions brought on-line on an annual basis at 39%.
- On average, a new megawatt of solar PV capacity came on-line every 36 minutes in 2016.
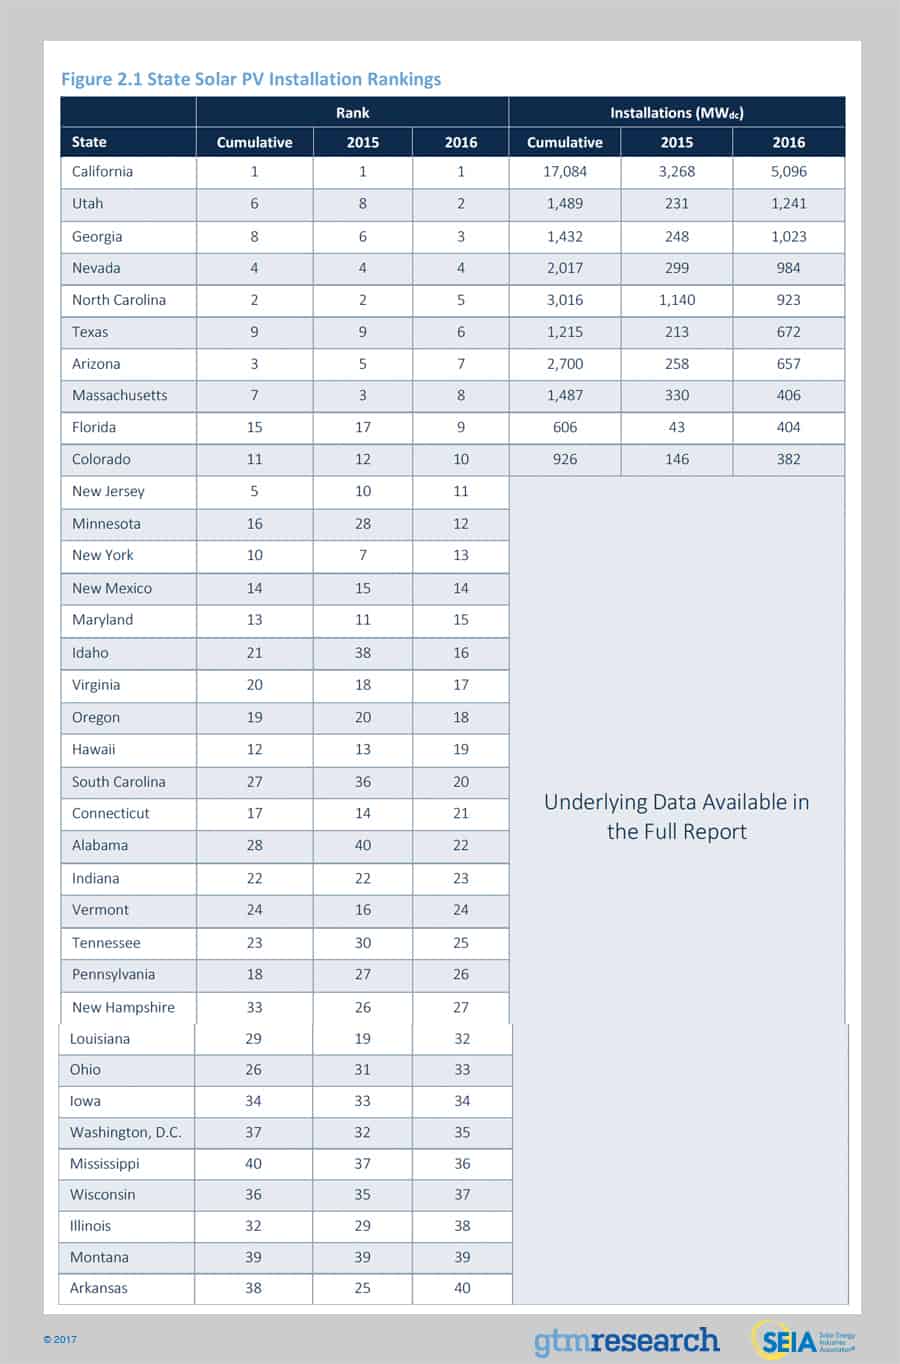
- In 2016, a record 22 states each added more than 100 MW of solar PV.
- Q4 2016 was the second consecutive quarter that California added more than 1 GWdc of utility PV and the largest single quarter by one state.
- At 19%, residential PV saw its growth slow in 2016 from record growth in 2015 due to second half slowdowns in a handful of established state markets, offset somewhat by the emergence of several new state markets.
- The once-nascent community solar market quadrupled in 2016, playing a key role in supporting the largest year ever for the non-residential PV market.
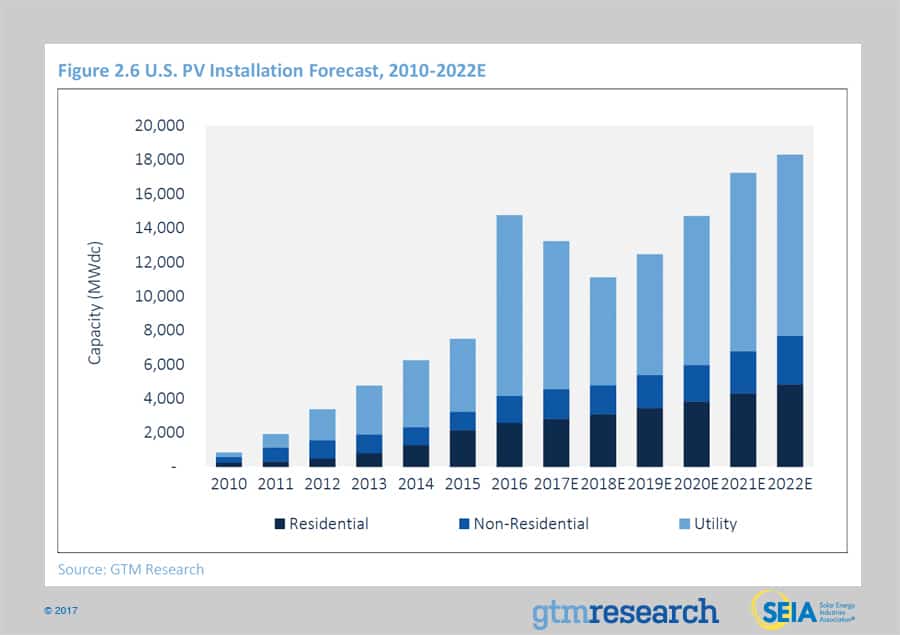
- GTM Research forecasts that 13.2 GWdc of new PV installations will come on-line in 2017, down 10% from a record-breaking 2016. Utility PV is expected to account for 66% of that new capacity.
- Total installed U.S. solar PV capacity is expected to nearly triple over the next 5 years. By 2022, more than 18 GW of solar PV capacity will be installed annually.
Introduction
By any measure, 2016 was a record year for solar in the United States. The PV market grew 97% over 2015, installing 14.8 GWdc from over 370,000 individual installations.

For the first time, solar represented the largest new source of electricity generating capacity, beating out both natural gas and wind for new capacity additions.

Twenty-two states individually installed over 100 MWdc in 2016, up from 13 in 2015 and just two in 2010. This geographic diversification occurred across market segments. In the residential sector, states such as South Carolina and Texas experienced major growth in 2016, while the utility sector saw the most expansion in Georgia, Minnesota and Utah. California remained the largest state market, but its share of total capacity fell to 35%, the state’s lowest share since 2012. Notably, this share is expected to continue to fall as utilities aggressively procured utility PV to meet the state’s renewable portfolio standards in prior years, while near-term anticipated deceleration across distributed solar markets will lead to California’s overall share of the solar market dipping below 30% for the first time since 2010.
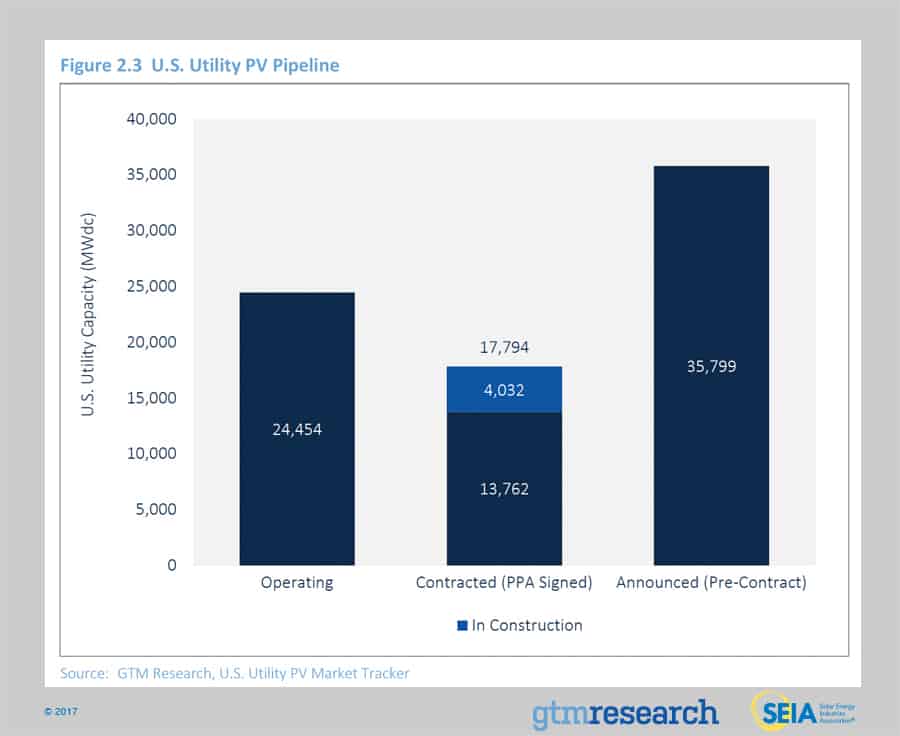
Utility PV dominated the market in 2016, but the market is not expected to exceed 10 GW again until 2021
While all market segments grew in 2016, by far the largest growth came from the utility sector, which more than doubled with installations totaling more than 10 GWdc. This boom was largely expected. In 2014 and 2015, as developers and utilities anticipated the expiration of the federal Investment Tax Credit (which had been scheduled to step down at the end of 2016), an unprecedented pipeline accumulated, nearly all of which had a contractual obligation to begin operation by the end of 2016. When the ITC was ultimately extended in late 2015, some of those projects were pushed out, but many remained in the 2016 pipeline.
As a result, 2016 was an unusually strong year for utility solar. Given the spillover of an estimated 4 to 5 GWdc of projects which had originally been slated for 2016 delivery, 2017 will likely also see a large volume of utility solar completions. Moving beyond 2017, the question for the market will be whether the pipeline can be replenished for 2018-2019, or whether there will be a capacity dip during those years before the longer-term growth trajectory resumes.
Conversely, distributed PV was a mixed bag as residential PV saw growth slow over the second half of the year
At 19% annual growth, the residential market cooled down from record growth rates over the last several years. While the segment was buoyed by the performance of several emerging state markets, growth in a handful of established markets slowed over the second half of the year as installers encountered longer lead times in acquiring new customers. Given these challenges in select markets, growth in 2017 will continue at a slower rate, more consistent with a maturing industry. Rate of long term growth in this segment is dependent on a handful of driving factors:
- The extent to which emerging state markets can reach meaningful scale and offset slowdown in major markets;
- The outcome of key NEM and rate design battles playing out across major and emerging markets;
- The ability of installers in established markets to penetrate new customer demographics and bring down customer acquisition costs; and
- To a lesser extent, the value proposition of solar plus storage self-consumption plays in mature markets.
Meanwhile, non-residential PV saw its highest growth rates in years
On the non-residential side, 2016 was a banner year for a segment that saw its highest growth since 2012 as a large pipeline of traditional C&I projects across major state markets sought to get installed under pending regulatory timelines. While 2017 will benefit from these regulatory deadlines, commercial origination will be limited in the nation’s leading commercial markets – California and Massachusetts – resulting in falling installations in 2018. From 2018 onward, the non-residential space will rebound as community solar drives a growing share of the non-residential segment, financing solutions for small-scale commercial develops, and the value proposition of commercial solar-plus-storage increases.
Photovoltaics

Market Segment Trends
Residential PV
Key Figures
- 2,583 MWdc installed in 2016
- Up 19% over 2015
After record growth rates in three of the last four years, the residential segment experienced a reduction in growth in a handful of established state markets that have historically driven the majority of market growth. While the top five markets still account for nearly 70% of national installations, three of these top five residential markets experienced their slowest growth year on record, with California dropping to single-digit annual growth over 2015. In aggregate, installers in major markets have cited difficulties including reaching customers outside of the early adopters that have driven the market to date and increased lead times in closing sales.
In contrast to the major market slowdown, a handful of emerging state markets such as Utah, Texas and South Carolina have begun to scale in 2016 as national installers capture expiring incentives and tap into early-adopter customers. Though susceptible to incentive-driven boom-and-bust cycles and the same regulatory concerns surrounding net energy metering (NEM) that major markets faced in the past, emerging markets are expected to partially, though not fully, offset the deceleration seen across major states.
Non-Residential PV
Key Figures
- 1,586 MWdc installed in 2016
- Up 49% from 2015
2016 was a banner year for non-residential PV, as the segment grew at its fastest pace since 2011 while also adding more non-residential PV than any previous year.
This was largely a function of two key factors. The first driver was considerable demand pull-in in response to looming regulatory deadlines in the nation’s two largest non-residential markets – California and Massachusetts – both of which saw record-breaking installation volume and growth. The second driver was the materialization of a large community solar pipeline led by California, Minnesota and Massachusetts that resulted in community solar installations nearly quadrupling over 2015.
Utility PV
Key Figures
- 10,593 MWdc installed in 2016
More than any other year, the utility PV market has solidified its place as the bedrock driver of installation growth in the U.S. It accounted for 72% of capacity installed in 2016, a 148% increase over 2015 utility PV installations. A total of 5.2 GWdc were brought on-line in Q4 2016, making it the largest single quarter in the history of U.S. utility solar. Three states, California, Georgia and Utah, all saw more than 1.0 GWdc brought on-line during the year. This incredible volume was primarily driven by demand pull-in from projects that utilities procured ahead of schedule and that developers rushed through the early stages of development amidst uncertainty over the extension of the 30% federal ITC.

Despite the flurry of project completion at the end of 2016, 2017 will still see 8.7 GWdc come on-line. Of the 2017 utility PV installation forecast, approximately 60% of that capacity comes from projects that originally targeted a 2016 installation, but have now spilled over. After seeing a procurement lull caused by demand pull-in, demand is beginning to pick up steam, with utilities procuring new projects primarily targeting the 2019-2021 timeframe. Consequently, 2018 is expected to be the lowest year for new utility PV capacity added since 2015. In 2019, utility PV will also see a flurry of projects beginning construction. With the ITC scheduled set to step down to 26% in 2020, utilities and developers are aiming to take advantage of commence-construction rules to capture the 30% ITC.
With many utilities having met interim or final renewable energy mandates, the demand landscape is pivoting away from state renewable portfolio standards. Currently, 64% of projects in development are driven by non-RPS mechanisms. While RPS-driven projects still make up the largest segment of projects in development, these non-RPS-driven projects make up almost all new procurement. Among the non-RPS market drivers, the Public Utility Regulatory Policies Act (PURPA) is on track to drive the largest volume of new capacity in 2017, most notably in North Carolina, Oregon and South Carolina.
As large-scale PV begins to reboot, one other notable trend is the growth of corporate procurement of offsite solar. Through a combination of direct access programs, contracts for difference, and green tariff programs, large corporate customers accounted for an unprecedented 10% of annual capacity additions in 2016, totaling more than 1.0 GWdc. Altogether, the continued rise in non-RPS procurement stems from the growing number of geographies where utility solar is now a cost-competitive resource compared with new-build natural gas alternatives.

National Solar PV System Pricing
We utilize a bottom-up modeling methodology to track and report national average PV system pricing for the major market segments. Our bottom-up methodology is based on tracked wholesale pricing of major solar components and data collected from interviews with major installers.

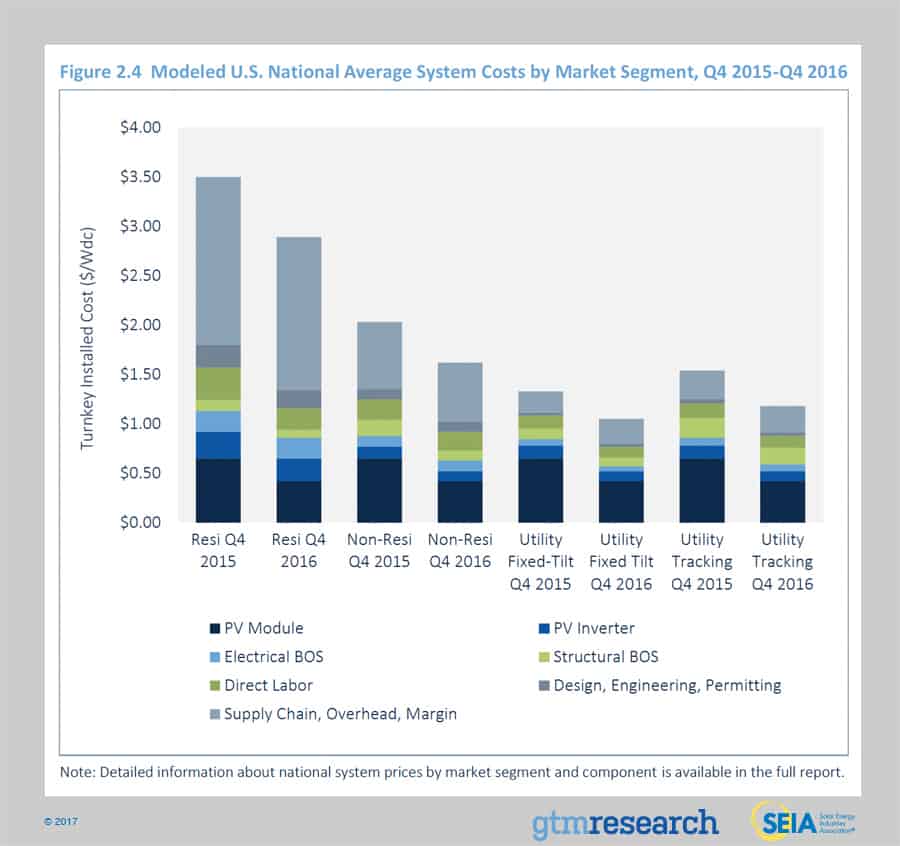
In Q4 2016, depending on the market segment, overall PV system pricing fell by up to 4.1% from Q3 2016. The segment with the largest price decline was the non-residential sector. Despite rising or stagnant soft costs on a quarterly basis, total system pricing continues to trend downward across all market segments. Quarterly price declines of 3.0%, 2.8% and 2.5% occurred in the residential, fixed-tilt utility and single-axis tracking sectors, respectively. The quarter capped a year with tremendous changes in system and component pricing. From Q4 2015 to Q4 2016, on average, U.S. PV system pricing fell by nearly 20% - that translates to an average quarterly price decline of 4.9%. This is the greatest average year-over-year price decline since this report series has been tracking modeled national system pricing. Unprecedented price declines in modules, coupled with substantial price declines in inverters and structural balance of systems, spurred the majority of the change in system pricing both in Q4 2016 and 2016 as a whole. Due to both the global module demand and supply imbalance and policy instability internationally, hardware markets were fiercely competitive in 2016, producing aggressive component price declines. Annually, hardware costs fell by 32%, 42%, 45% and 39% in the residential, non-residential, fixed-tilt and single-axis tracker market segments, respectively.
In Q4 2016, average pricing for residential rooftop systems landed at $2.89/Wdc – a 3% drop from Q3’s $2.98/Wdc. This occurred even while national and regional installers continue to report little substantial success in cutting costs in the domains of operations and customer acquisition. Even with this reported difficulty, soft costs did still fall 3.8% within the year. Year-over-year residential system pricing fell 17%.
The non-residential sector saw a 4.1% fall in pricing in the quarter. In Q4 2016, flat-roof non-residential system pricing landed at $1.62/Wdc from Q3’s $1.69/Wdc. Like the rest of the market, aggressive module, inverter and racking prices constituted almost all of this system pricing drop – total hardware costs fell 10%. The 4.1% quarter-over-quarter drop was the largest of all other market segments in Q4. Year over year system pricing fell by 20%.
Utility fixed-tilt and single-axis tracking projects in Q4 2016 saw average pricing of $1.06/Wdc and $1.18/Wdc, respectively. That represents a 2.8% and 2.5% price reduction from last quarter. Quarter-over-quarter, the premium for single-axis tracking systems was unchanged at $0.12/Wdc. Within the utility-scale segment, pricing for fixed-tilt and single-axis tracking systems fell by 20% and 23%, respectively, year-over-year.
Component Pricing
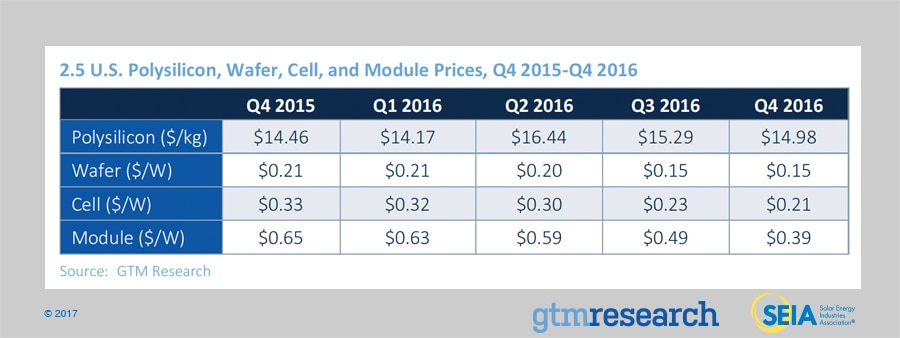
The dramatic decline in component prices in the second half of 2016 was driven by excessive component supply versus quarterly demand. This caused suppliers to aggressively slash prices and prompted buyers to adopt “wait-and-see” strategies, which allowed prices to decline further.
- For polysilicon, the quarterly average price fell 2% quarter-over-quarter to $14.98/kg in Q4 2016. The decrease in price was largely driven by weak demand and very low prices at the beginning of the quarter. Prices started to recover at the end of the quarter in response to stronger demand and lower polysilicon supply as select firms performed facility maintenance.
- Wafer and cell prices fell a respective 4% and 6% quarter-over-quarter, reaching $0.15/W and $0.21/W in Q4 2016. Price pressure from buyers, weak demand and strong price competition drove price declines for these components.
- In the past few years, U.S. module price trends were largely driven by antidumping and countervailing duties on Chinese suppliers. But recently the main driver has shifted; current module price trends are largely a result of supply-demand imbalance. During the fourth quarter, the quarterly average delivered price for Chinese producers ranged from $0.38/W for order volumes greater than 10 MW to $0.39/W on the high side for order volumes of less than 1 MW. It should be noted that these prices do not represent the low end, since rapid module price depreciation drove a large difference between prices at the start and end of the quarter

Market Outlook
After the conclusion of a record-breaking year driven by the buildout of a multi-gigawatt utility PV pipeline procured under the assumption of a 2016 federal ITC expiration, the near-term outlook for utility-scale PV will be marked by reset as developers seek to build out the ITC pipeline and restart the origination process, while distributed solar continues to see limited growth constrained by an ever-changing policy and customer acquisition landscape.
In 2017, while the residential and non-residential PV markets are both expected to experience year-over-year growth, the U.S. solar market is expected to drop just over 10% on an annual basis as utility PV projects decline relative to the massive utility PV pipeline build out witnessed in 2016. Despite buildout falling on an annual basis, the utility PV segment is still expected to see over 8 GWdc in 2017 – nearly double what was installed in 2015 – as ITC spillover drives significant utility PV deployment, accounting for between 55-60% of projected utility PV capacity buildout in 2017.
In 2018, residential PV continues to grow at a limited pace as major market installers seek to find more efficient means of customer acquisition, while emerging state markets begin to contribute a growing share of the residential market. However, 2018 marks the year in which the non-residential market begins to feel the effects of regulatory and policy constraints that will lead to an annual decline in non-residential deployment. Though 2018 will stand as a relatively low installation year for utility PV, project origination will benefit the post-2019 outlook as procurement mechanisms outside of renewable portfolio standards drive an increasing majority of the market.
By 2019, U.S. solar is expected to resume year-over-year growth across all market segments. And by 2022, 30 states in the U.S. will be 100+ MWdc annual solar markets, with 25 of those states being home to more than 1 GWdc of operating solar PV.
Forecast details by state (39 states plus Washington, D.C.) and market segment through 2021 are available in the full report.


Acknowledgments
U.S. Solar Market Insight® is a quarterly publication of Wood Mackenzie, Limited, and the Solar Energy Industries Association (SEIA)®. Each quarter, we collect granular data on the U.S. solar market from nearly 200 utilities, state agencies, installers and manufacturers. This data provides the backbone of this U.S. Solar Market Insight® report, in which we identify and analyze trends in U.S. solar demand, manufacturing and pricing by state and market segment. We also use this analysis to look forward and forecast demand over the next five years. All forecasts are from Wood Mackenzie, Limited; SEIA does not predict future pricing, bid terms, costs, deployment or supply.
- References, data, charts and analysis from this executive summary should be attributed to “Wood Mackenzie, Limited/SEIA U.S. Solar Market Insight®.”
- Media inquiries should be directed to Mike Munsell at GTM Research and Alexandra Hobson at SEIA.
- All figures are sourced from Wood Mackenzie, Limited. For more detail on methodology and sources, visit www.gtmresearch.com/solarinsight.
- GTM Research partners with Clean Power Research to acquire project-level datasets from participating utilities that utilize the PowerClerk product platform. For more information on Clean Power Research’s product offerings, visit www.cleanpower.com.
Our coverage in the U.S. Solar Market Insight reports includes 39 individual states and Washington, D.C. However, the national totals reported include all 50 states, Washington, D.C., and Puerto Rico.
Detailed data and forecasts for 39 states and Washington, D.C. are contained within the full version of this report, available at www.greentechmedia.com/research/ussmi.
Author’s Note: Revision to U.S. Solar Market Insight report title
GTM Research and SEIA have changed the naming convention for the U.S. Solar Market Insight report series. Starting with the report released in June 2016 onward, the report title will reference the quarter in which the report is released, as opposed to the most recent quarter in which installation figures are tracked. The exception will be our “Year in Review” publication, which covers the preceding year’s installation volumes despite being released during the first quarter of the current year.
AUTHORS
GTM Research | U.S. Research Team
Austin Perea, Solar Analyst (lead author)
Cory Honeyman, Associate Director of U.S. Solar
Shayle Kann, Senior Vice President
Allison Mond, Solar Analyst
MJ Shiao, Director of Solar Research
Jade Jones, Senior Solar Analyst
Scott Moskowitz, Senior Solar Analyst
Colin Smith, Solar Analyst
Benjamin Gallagher, Solar Analyst
Solar Energy Industries Association | SEIA
Shawn Rumery, Director of Research
Aaron Holm, Data Engineer
Katie O’Brien, Research Associate
Justin Baca, Vice President of Markets & Research