US Solar Market Insight Q1 2011
Introduction
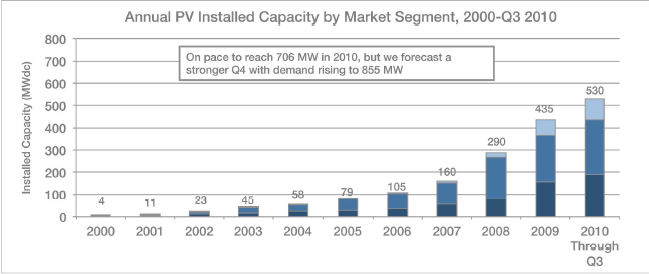
In 2010, the U.S. installed 887 megawatts1 (MW)of grid-connected photovoltaics (PV), representing104% growth over the 435 MW installed in 2009. Despite this, U.S. market share of global installations fell to 5.1%, down from 6% in 2009 due to even faster growth abroad. Over the past six years, the U.S. has been growing at a relatively even pace with the global market; as a
result, U.S. market share of global installations has consistently hovered between 5% and 7% since 2005. In 2011, however, this pattern is likely to end. A slowdown in major European markets (most notably Italy and Germany)2, combined with the continued strength of the U.S. market, has already led most PV manufacturers and developers to seek opportunities in the U.S. We anticipate an exciting, if volatile, year in the U.S. PV market. This report catalogues the beginning of this period.
For concentrating solar, which includes both concentrating solar power (CSP) and concentrating photovoltaics (CPV), the U.S. is poised to become the global market leader in installations. After 20 years of near-dormancy in the industry, many large-scale concentrating solar projects are set to continue their expected ramp-up over the next few years including the expected completion of the world’s largest CPV facility (at 30 MW) expected before December.
Installations
In the first quarter of 2011, the U.S. installed 252 MW of grid-connected PV. Although this represents a sequential decline of 110 MW from the fourth quarter of 2010, two factors should be taken into account. First, the Q4 2010 totals were propped up by the completion of 167 MW of utility PV as compared to only 33 MW in Q1 2011. The utility PV market remains lumpy as the completion of only a few plants can represent a huge swing in capacity additions from quarter to quarter, so little meaning should be attached to this variability. Second, seasonal weatherrelated impacts (particularly in Northeast U.S. markets) always push down total installations in the fi rst quarter. In 2010, for example, only 17% of the total annual installations were completed by the end of March.
A more meaningful measurement is to compare the fi rst quarter of 2011 with the first quarter of 2010. By this standard, Q1 2011 was strong, showing 66% year-over-year growth. As will be discussed in a subsequent section, the majority of this growth came in the non-residential sector, which grew 119% over Q1 2010. Despite strong growth in the fi rst quarter, the market will need to ramp up even faster in order to meet industry expectations, which generally anticipate at least another doubling of the total U.S. PV market in 2011. Given the pipeline of projects and recent module price declines, we believe this outcome remains likely.
Download the full report here.