US Solar Market Insight Q2 2011
Introduction
In 2010, the U.S. installed 887 megawatts (MW) of grid-connected PV, 104% growth over the 435 MW installed in 2009. Despite this, U.S. market share of global installations fell to 5.1%, down from
6.0% in 2009. Over the past six years, the U.S. has been growing at a relatively even pace with the global market; as a result, U.S. market share of global installations has consistently hovered between 5% and 7% since 2005. In 2011, however, this pattern is likely to end. A first-half slowdown in major European markets (most notably Italy and Germany) combined with continued strength in the
U.S. has already led most PV manufacturers and developers to seek opportunities in the U.S. market with many in the industry expecting the it to be the largest market in the world within a few years.
At the same time, the U.S. market faced a rapidly changing landscape in the first half of 2011. Module prices fell drastically across the country, but incentives were also reduced in many locations.
These opposing forces caused a great deal of uncertainty for many industry players. This report examines those trends and seeks to demystify the current landscape for U.S. PV installations.
For concentrating solar, which includes both concentrating solar thermal electric (CSP) and concentrating photovoltaics (CPV), the second quarter saw the installation of several smaller projects, as well as significant progress on the loan guarantee front for several larger projects.
Installations
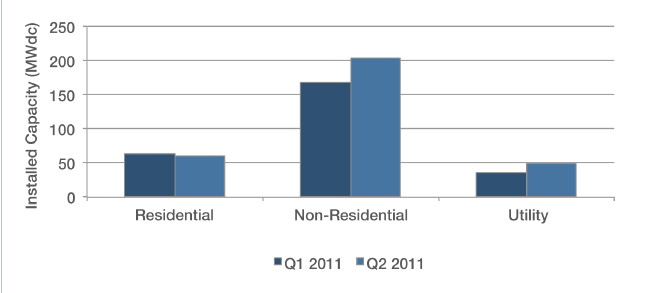
The U.S. installed 314 MW of PV in the second quarter of 2011, 69% more than Q22010. This figure represents 17% growth over the Q1 2011 installations of 268 MW. As was discussed in the Q1 2011 report, first quarter installations were bolstered by a shipment boom in Q4 2010 as a result of the then-expected expiration of the Section 1603 Treasury program. This raised the total installation figure for Q1, an effect which trailed off in Q2. The 17% quarterly growth figure is impressive when considered in this light. On the other hand, the first quarter is typically seasonally weak in the U.S. market, primarily for climatic reasons. We would thus expect a stronger second quarter, which the data does support.
The module price declines experienced in the first half of the year (discussed in the Full Report) impacted every major PV market, and the U.S. was no exception. Prices began to fall in earnest early in the second quarter. Given that there is generally a delay for changing component prices to filter downstream into installations, we expect that these impacts will help drive second half installations.
Read the full report here.