Solar Market Insight Report 2017 Q4
About SMI | Press Release | More Industry Data
The quarterly SEIA/GTM Research U.S. Solar Market Insight™ report shows the major trends in the U.S. solar industry. Learn more about the U.S. Solar Market Insight Report.
Download the Executive Summary
Key Figures
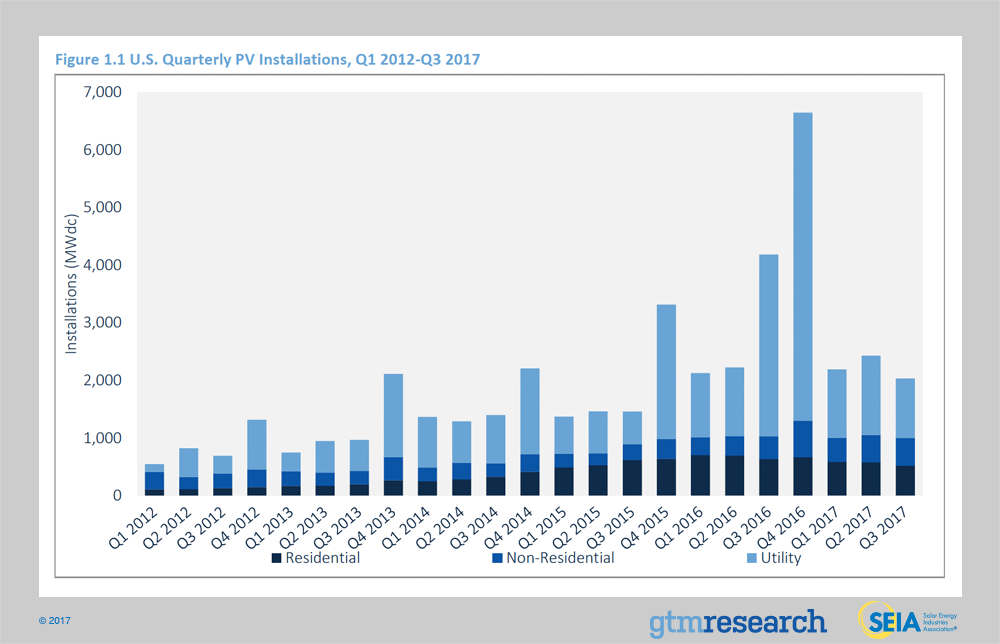
- In Q3 2017, the U.S. market installed 2,031 MWdc of solar PV, a 51% decrease year-over-year from Q3 2016. Through the end of Q3, installations are tracking 22% behind the pace set through the same period during a record-breaking 2016.
- Through the first three quarters of 2017, 25% of all new electric generating capacity brought on-line in the U.S. has come from solar, ranking second over that period only to natural gas.
- In the Section 201 safeguard case, the U.S. International Trade Commission (U.S. ITC) failed to achieve a formal recommendation of trade relief on foreign-manufactured crystalline silicon cells and modules. Rather, individual commissioners suggested to the Trump administration three sets of remedies at levels below the petitioners' requests. President Trump has until January 26 to decide the outcome of the case.
- Q3 2017 saw price increases across all market segments for the first time since this report series’ inception, stemming from increases in module costs due to a global shortage of Tier 1 module supply and the Section 201 petition.
- The residential PV sector fell 10% quarter-over-quarter. Declining growth is driven by weakness in California and major Northeast markets, which continue to feel the impact of pull-back from national providers.
- In contrast to residential PV, the non-residential sector grew 22% year-over-year, primarily driven by regulatory demand pull-in from looming policy deadlines in California and the Northeast in addition to the continued build-out of a robust community solar pipeline in Minnesota.
- Voluntary procurement continues to be the primary driver of new utility PV procurement, in 2017 accounting for 57% of new procurement through Q3.
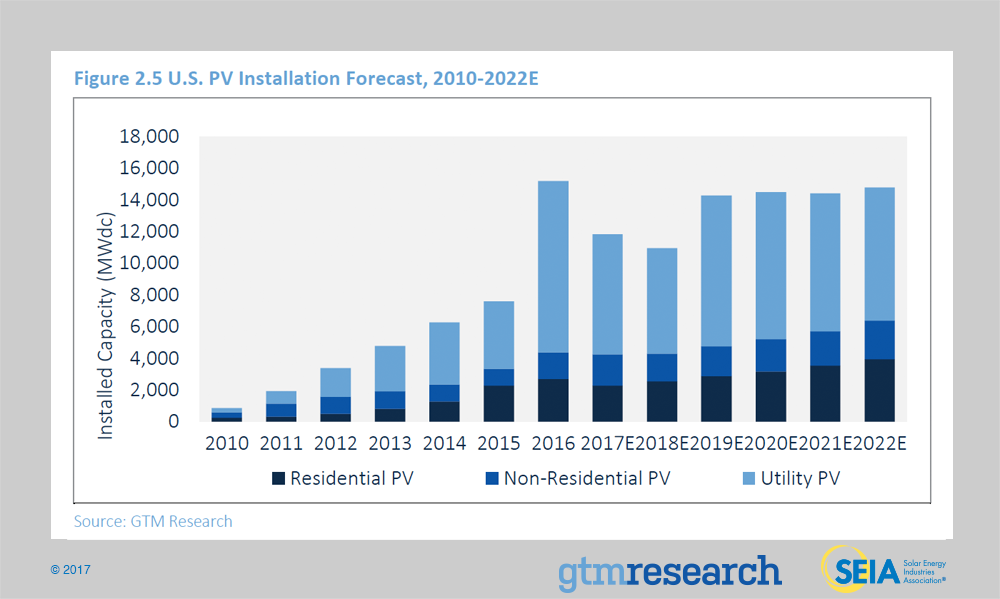
- GTM Research forecasts that 11.8 GWdc of new PV installations will come on-line in 2017, down 22% from a record-breaking 2016. Our forecast has been adjusted downward from 12.4 GWdc last quarter to reflect continued challenges in the residential market and a push back in utility-scale completion timelines due to uncertainties surrounding the trade case.
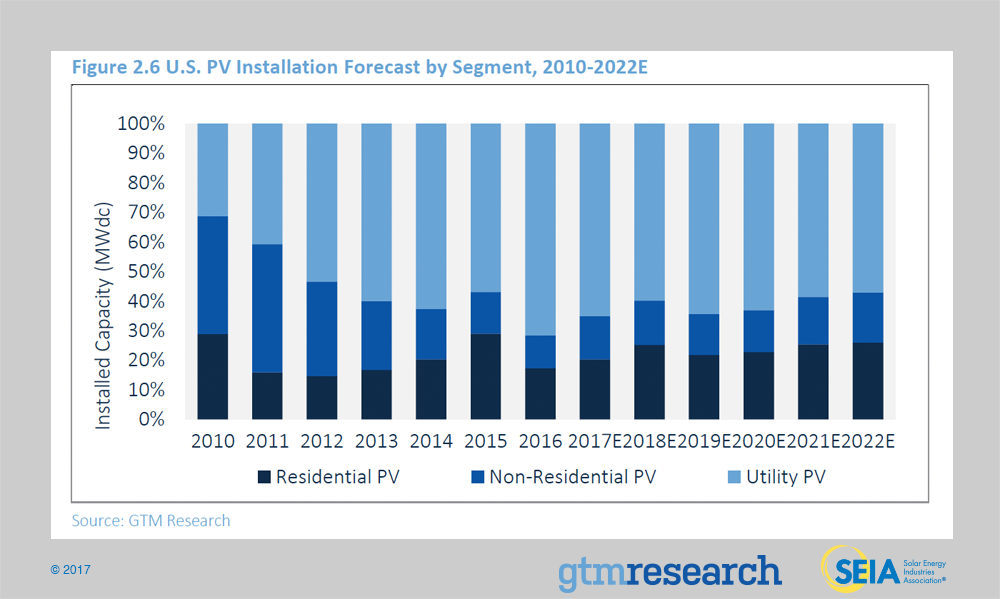
- Total installed U.S. PV capacity is expected to more than double over the next five years and by 2022, nearly 15 GW of PV capacity will be installed annually.
1. Introduction
In Q3 2017, the U.S. solar market installed 2,031 megawatts direct current (MWdc). Of that total, 51% came from the utility PV segment, which added more than 1 GWdc for the eighth consecutive quarter.
For all of 2017, non-residential PV is the only segment expected to grow on annual basis. The segment’s growth comes from projects rushing to install before rate and incentive structures changes in select markets, along with the continued emergence of community solar, which is on track to grow by more than 50% year-over-year.
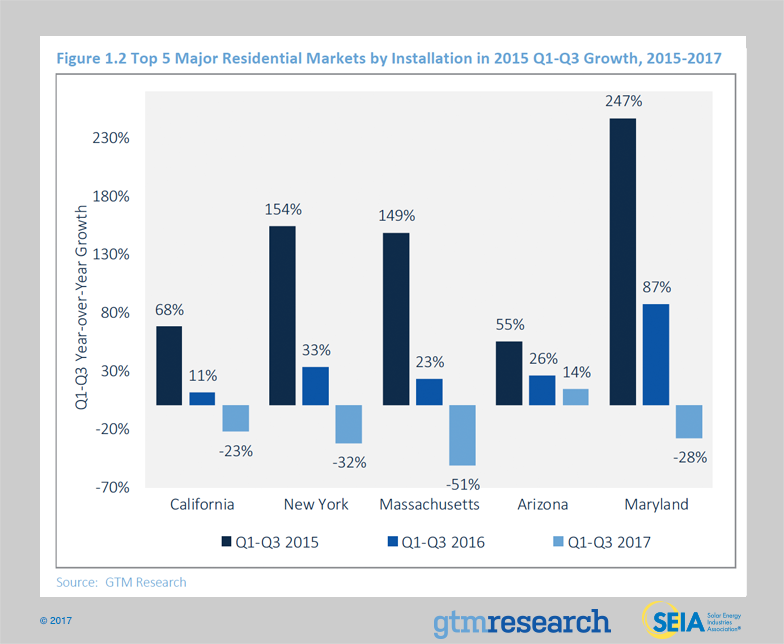
Meanwhile, residential PV is still expected to fall year-over-year for the first time ever. This downturn is happening even though more than half of all states in the U.S. have now surpassed grid parity . Rather, the downturn has more to do with two major competitive landscape constraints. First, segment-wide customer-acquisition challenges are constraining growth in major state markets. Between Q1 and Q3 2017, the top 10 states still drove more than 80% of the market, but fell 16% year-over-year. Second, national residential solar companies have slowed operations and pursued more profitable sales channels by pulling back on less-scalable channels such as door-to-door sales, which has come at the expense of growth.
Meanwhile, the year-over-year downturn for utility PV in 2017 has been softened by projects that pushed out their completion dates from 2016 as a result of the 30% federal Investment Tax Credit extension. These projects that have spilled over into 2017 represent more than 50% of this year’s utility PV forecast. While Q3 was a relatively soft quarter for utility-scale, Q4 is expected to yield 3.9 GWdc of new installations.
Under GTM Research’s base-case outlook, U.S. solar is expected to fall year-over-year again in 2018 before rebounding in 2019, in large part due to trends in utility PV procurement. During the first half of this year, most utility solicitations have focused on projects that can come on-line with a 30% federal ITC in 2019 or later by leveraging commence-construction rules. Utility PV’s recovery is also driven by procurement outside renewable portfolio standards, with more than 75% of the current pipeline coming from voluntary procurement, PURPA, off-site corporate procurement, and California-based community choice aggregators.
Within the distributed PV market, residential solar is expected to resume 10% to 15% annual growth between 2018 and 2022, as customer-acquisition challenges are incrementally addressed and the market’s growth becomes less reliant on a small handful of national installers. Meanwhile, non-residential PV is expected to fall in 2018 due to the aforementioned revisions to state incentive programs, virtual net energy metering rules, and solar-friendly rate structures across major state markets. The segment is expected to resume year-over-year growth in 2019, in large part due to growth in community solar across emerging legislative driven markets, namely New York, Maryland and Illinois.
However, looming over the base-case outlook for U.S. solar are two macro-level risks.
- Corporate tax reform could reduce tax equity demand: Congress is in a hurry to pass tax reform legislation. That legislation features a reduction in the top corporate tax rate from 35% to 20% that will reduce the availability of tax equity financing, which will make it more difficult for developers to monetize the federal Investment Tax Credit. However, another provision in the bill threatens to have an equally large impact on tax equity financing. The Base Erosion Anti-Abuse Tax (BEAT) provision in the Senate Tax Bill would require large companies to pay an additional tax if their tax bill, when adjusted for tax credits, falls below 11% of their U.S. income, adjusted to include certain cross-border payments not previously counted as income. This provision would create less demand for tax equity investment among investors as tax credits could put the investor at risk of falling short of the 11% minimum tax threshold. This is especially problematic as it pertains to the solar Investment Tax Credit as the financial arrangements are negotiated years in advance of when the credit is claimed, before a tax equity investor would know about their potential tax liability. This would result, at minimum, in a tightening of the tax equity market, likely increasing the cost of financing for developers who use tax equity financing. SEIA and others are working to amend this provision in order to mitigate the impact on renewable energy tax credits before a final vote on the bill is taken, likely by December 20th
- Final Outcome of Section 201 Trade Dispute: In April 2017, domestic cell and module manufacturer Suniva filed a petition with the U.S. International Trade Commission (U.S. ITC) under Section 201 of the Trade Act of 1974. Suniva, joined by SolarWorld as a co-petitioner, requested relief against crystalline silicon PV (CSPV) module and cell imports from all countries. On September 22, U.S. ITC voted unanimously that serious injury occurred due to imports. While the commissioners’ remedy recommendations exclude Singapore, Canada and free trade agreement countries except Mexico and Korea, the ultimate remedy decision now lies with President Trump. SEIA strongly opposes this petition and has been leading a coalition effort to defend the U.S. solar market.
The below excerpt provides additional updates about what comes next with the trade dispute, now that the U.S. ITC commissioners have officially outlined their own recommendations for the Trump administration to consider.
Section 201 Update: Petition Scope and Regulatory Timeline
On November 13th the U.S. ITC officially submitted a trade remedy report to the Trump administration on CSPV module and cell imports. In total, the four U.S. ITC commissioners recommended three mutually exclusive recommendations for consideration, each of which was less severe in magnitude from what Suniva and SolarWorld requested. Two of the proposals recommended combinations of tariff-rate quotas on imported cells and a blanket tariff on modules, while one recommended a hard quota for imported cells and modules coupled with a license fee auction. The recommendation in Figure 1.4 below is the only one supported by multiple commissioners. The recommendations per commissioner are as follows:
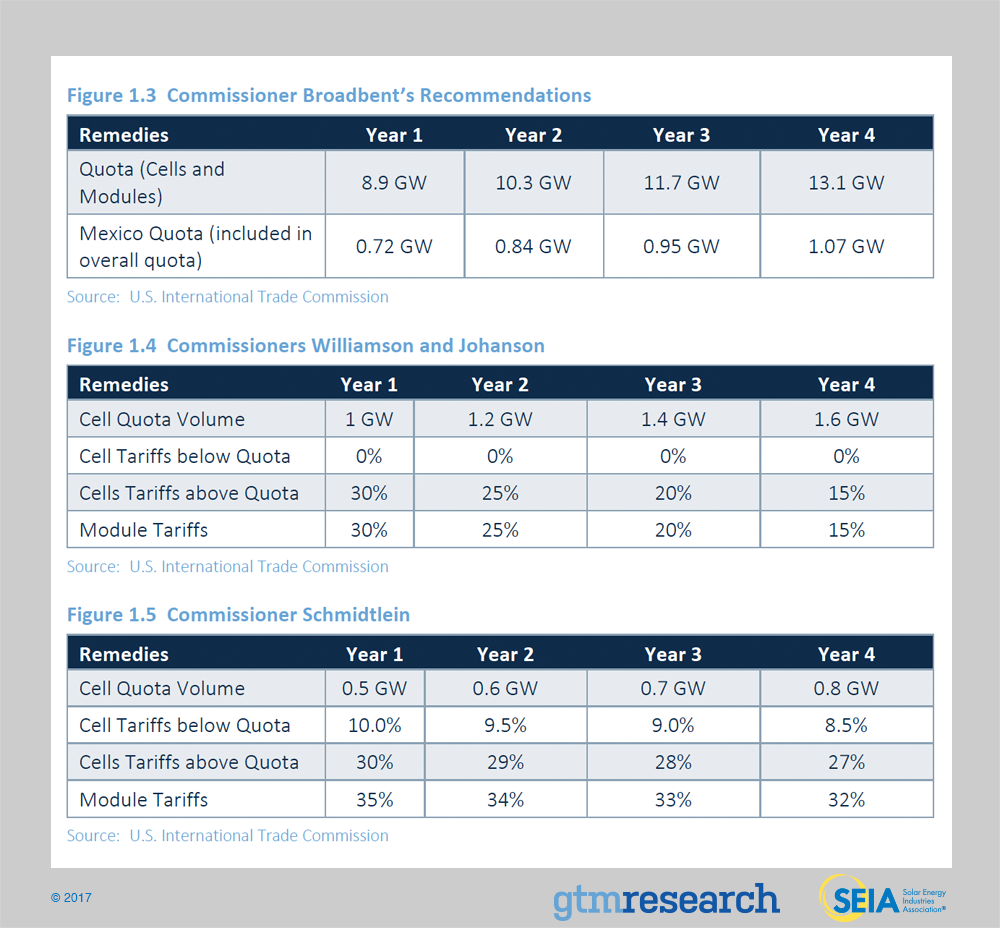
Looking ahead, January 26, 2018 is the latest deadline for President Trump to approve or reject any of the remedies recommended by the U.S. ITC commissioners, or to propose alternative/additional remedies. From there, the remedies would take effect 15 days after President Trump’s decision if the approved remedies are consistent with the U.S. ITC’s recommendations. If the president pursues a negotiated settlement, the deadline for announcement of a remedy and its initiation would be extended another 90 days.
Across the board, the U.S. ITC commissioners’ proposed tariffs are lower than Suniva’s initial request for a $.78/W minimum import price on modules and $.40/W tariff on imported cells in year 1. Instead, the tariffs recommended by the U.S. ITC commissioners are expected to range from $0.10-$0.12/W in year 1. Although the impact would be less severe than under Suniva’s initial proposal, under a year 1 tariff of $0.10 to $0.12/W, GTM Research expects installation volumes to fall compared to the base case outlook. Forthcoming analysis and revised forecasts from GTM Research will go into deeper detail on the scale and magnitude of impact across all three market segments once President Trump makes his final decision. Therefore, our current base-case forecasts do not account for U.S. ITC recommendations.
2. Photovoltaics
2.1. Market Segment Trends
2.1.1. Residential PV
Key Figures
- 517 MWdc installed in Q3 2017
- Down 10% from Q2 2017
- Down 18% from Q3 2016
Q3 2017 marks the third consecutive quarter in which the residential sector experienced year-over-year decline in deployments, primarily driven by continued weakness in established state markets. California’s performance in 2017 to date has heavily influenced the overall national residential market: from Q1-Q3, California – which has accounted for nearly 40% of the residential market in 2017 – saw a 23% reduction in installations relative to 2016, while major northeast markets saw comparable reductions in installation volumes. This decline continues to be driven by national third-party ownership (TPO) providers scaling back operations to more sustainable levels in an effort to prioritize profitability over growth. In contrast to major market slowdowns, Arizona experienced its second consecutive 50 MW quarter as installers rushed to complete installations under favorable grandfathered NEM rules.
But despite relative near-term policy certainty across most major and emerging state markets, growth has been hard to come by in markets of all sizes and maturity in 2017. Only 14 states experienced positive quarterly growth in Q3 (+8 MW) versus 29 states that experienced quarterly contraction (-68 MW). Accordingly, GTM Research forecasts 13% contraction in 2017 as major markets fall and emerging state markets contribute relatively less growth.
2.1.2. Non-Residential PV
Key Figures
- 481 MWdc installed in Q3 2017
- Up 2% from Q2 2017
- Up 22% from Q3 2016
Regulatory demand pull-in was the primary market mover in Q3, leading to the second largest quarter ever for non-residential installations as developers in California, Massachusetts, and New York rushed to install projects to qualify for more favorable time-of-use periods, expiring incentive programs and grandfathering provisions. Meanwhile, Minnesota experienced its largest quarter ever as the build-out of the Xcel Energy’s robust community solar pipeline comes online.
2.1.3. Utility PV
Key Figures
- 1,033 MWdc installed in Q3 2017
- 8th consecutive quarter in which utility PV added over 1 GWdc
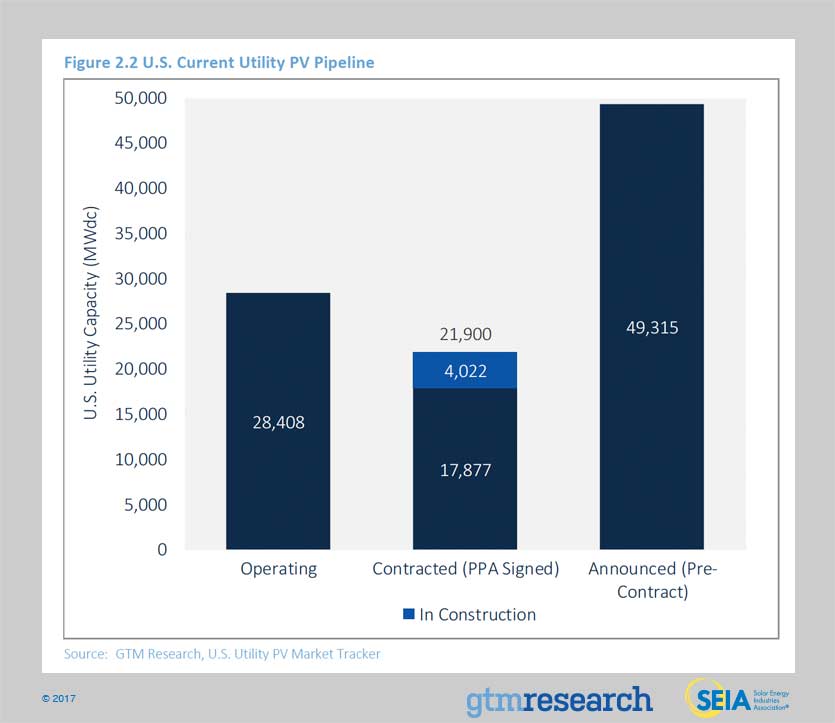
- Contracted utility PV pipeline currently totals 21.9 GWdc
A total of 1.0 GWdc of utility PV projects came on-line in Q3 2017 accounting for 51% of U.S. capacity installed this quarter. A total of 4 GWdc of projects are in construction and GTM Research expects 3.9 GWdc of additional capacity to come on-line during Q4 2017. This would make Q4 2017 the second-largest single quarter for capacity additions in U.S. history, behind only Q4 2016.
Near term, GTM has reduced its 2017 forecast to 7.6 GWdc and increased our 2018 forecast slightly to 6.6 GWdc. Several projects were delayed due to uncertainty around potential impacts of the Section 201 trade case. Many developers reported pushing back target commercial operation dates (CODs) due to module supply tightness that has been exacerbated by uncertainty around potential tariffs or other import restrictions that would affect project economics. Additionally, PURPA projects in various state markets have faced further interconnection delays and are now expected to spill over into 2018. Combined with several new projects targeting 2018 CODs, this has led to a net increase to GTM’s 2018 outlook.
Long term, assuming no trade remedies, our 2019 forecast has increased by 8% to 9.5 GWdc. Several offtakers have either signed additional 2019 PPAs or announced plans to procure projects for 2019. Developers also continue to report targeting 2019 and 2020 to capture the full 30% Investment Tax Credit. Newly announced procurement plans targeting for 2020 and 2021 continue to support GTM’s base-case forecast. Due to several reasons, GTM’s 2022 forecast has been reduced 9% to 8.4 GWdc. One cause is demand pull-in of projects into 2021 or possibly even 2020, which would allow developers to capitalize on higher ITC rates by safe-harboring in an earlier year. The reduction in our 2022 forecast is also due to greater visibility into the long-term procurement plans of emerging state markets where we expect to see only modest growth rates.
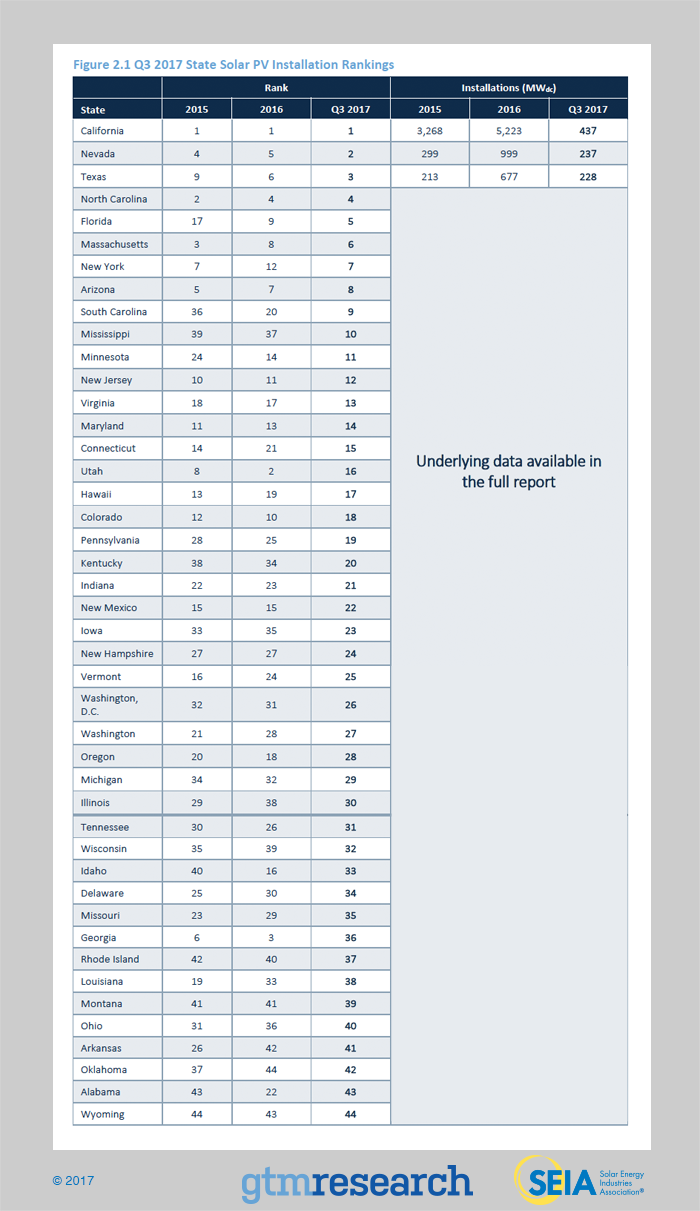
In Q3 2017, project completion barely outpaced new PPAs signed, resulting in a slight decrease to the U.S. utility contracted pipeline. This is partly due to ongoing uncertainty over how the final outcome of the trade dispute will impact developers’ PPA price bids into utility PV solicitations. However, procurement is expected to pick up in 2018 as more utilities aim to begin construction by the end of 2019 to capture the 30% ITC. Florida has now emerged as the No. 2 state market for utility PV after Duke Energy Florida, Tampa Electric Company and Jacksonville Electric Authority announced a combined 2.4 GWdc of solar additions between 2017 and 2022. This further bolsters the forecast in the Southeast, which is expected to see 38% of all cumulative capacity additions between 2017 and 2022.
2.2. National Solar PV System Pricing
We employ a bottom-up modeling methodology to track and report national average PV system pricing for the major market segments. Our bottom-up methodology is based on tracked wholesale pricing of major solar components and data collected from interviews with major installers.
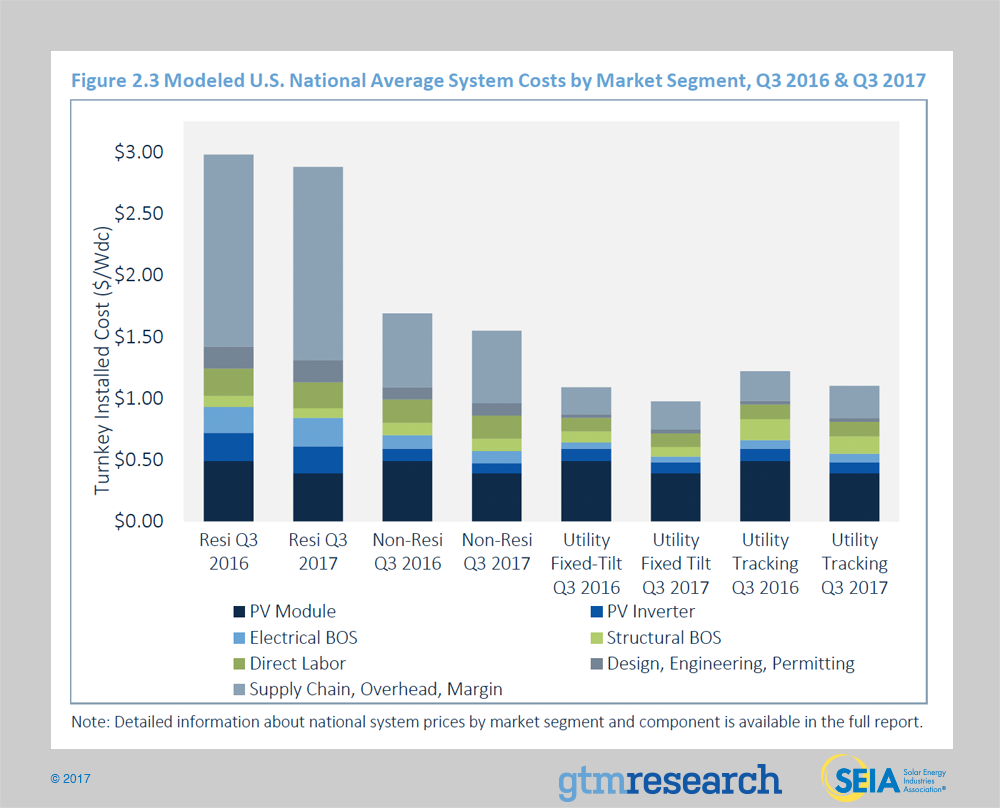
This past quarter saw PV system pricing increase across all market segments. This is the first time this has happened since this report series’ inception in 2010. In Q3 2017 system pricing increased by 1.4%, 1.3%, 2.1% and 1.9% in the residential, non-residential, fixed-tilt utility and single-axis tracking utility markets, respectively. While there have occasionally been quarterly increases in residential system pricing, the U.S. market has never seen increases in either any other market segment.
Fearing the potential negative ruling from the Trump Administration’s final decision on Suniva’s Section 201 case, some EPCs and installers have begun procuring modules for projects in 2018 and beyond. Global tier 1 module capacity (including thin film which is not subject to previous or prospective trade restrictions under the current section 201 case) available to serve the U.S. market is limited and has already been fully allocated for 2017. Looking towards H1 2018, strong global demand coupled with polysilicon and wafer supply tightness is expected to constrain Tier 1 supplier module availability. The rise in module pricing accounts for almost all of the overall system pricing increases, except in the residential market.
Unlike in Q2, when a non-module component price increase mitigated an overall increase in system pricing, the balance-of-system (BOS) markets were mostly static. Although competition among vendors across the BOS hardware landscape is still extremely aggressive, the broader hardware markets stood pat in the face of uncertainty from the Section 201 petition. This translated to little change in BOS hardware pricing in Q3.
2.3. Component Pricing
Price trends varied by component in Q3 2017, differences driven by component-level demand and inventory levels.
2.4. Market Outlook
The near term will see relatively constrained growth in both the utility and distributed generation (DG) sectors compared to previous years as policy uncertainties mount. DG continues to face an everchanging policy and customer-acquisition landscape, while the utility sector continues to reset as it builds out the post-ITC extension pipeline and restarts the origination process. Amidst all of this, the ongoing Section 201 proceeding concerning imported crystalline silicon cells and modules casts uncertainty across all solar PV segments while potential corporate tax reform creates another hurdle for developers using tax equity financing.
Altogether, the overall U.S. solar market is expected to fall 22% on an annual basis in 2017, primarily driven by the decline in utility PV deployment relative to the utility PV pipeline build-out in 2016. DG markets, however, have a slightly different path. Residential PV is expected to fall 16% annually primarily due to weakness across major state markets, many of which are experiencing year-over-year decline for the first time ever. Despite relative near-term policy certainty, the industry is experiencing the impact of national installers scaling back operations to focus on higher margin geographies, in addition to an increasingly challenging customer-acquisition landscape. Conversely, non-residential PV markets are expected to grow 17% as developers seek to complete installations ahead of regulatory changes in California, Massachusetts and New York, while Minnesota’s healthy community solar pipeline comes to fruition. Despite build-out falling on an annual basis, the utility PV segment is still expected to see over 7.6 GWdc in 2017 – nearly double what was installed in 2015 – as ITC spillover drives significant utility PV deployment.
In 2018, residential PV is expected to rebound at a limited pace as major market installers seek to find more efficient means of customer acquisition and large national players reorient their sales strategies, while emerging state markets begin to contribute a growing share of the residential market. However, 2018 marks the year in which the non-residential market will begin to feel the effects of regulatory and policy constraints that will lead to an annual decline in non-residential deployment. Though 2018 will stand as a relatively low installation year for utility PV, project origination will benefit the post-2019 outlook as procurement mechanisms outside of renewable portfolio standards drive an increasing majority of the market.
By 2019, U.S. solar is expected to resume year-over-year growth across all market segments. And by 2022, 29 states in the U.S. will be 100+ MWdc annual solar markets, with 25 of those states being home to more than 1 GWdc of operating solar PV.
However, downside risk looms over the long-term outlook for U.S. solar, due to the trade dispute initiated by the domestic-based cell and module manufacturer Suniva, later joined by SolarWorld. As mentioned, U.S. ITC commissioners have recommended a variety of relief measures that would put non-exempt imports at a premium of $.10 to .12/W in year 1 compared to current baseline price expectations.
Barring the election of pursuing international negotiations, President Trump has until January 26 to make a decision about the type and magnitude of trade remedies, which would become effective 15 days later. If the president chooses to implement a trade-restrictive remedy, we would expect downward revisions in our forecast across all three market segments. GTM Research will continue to monitor the outcome of this petition and its ultimate impact on solar deployment by state and segment.
Forecast details by state (43 states plus Washington, D.C.) and market segment through 2022 are available in the full report.
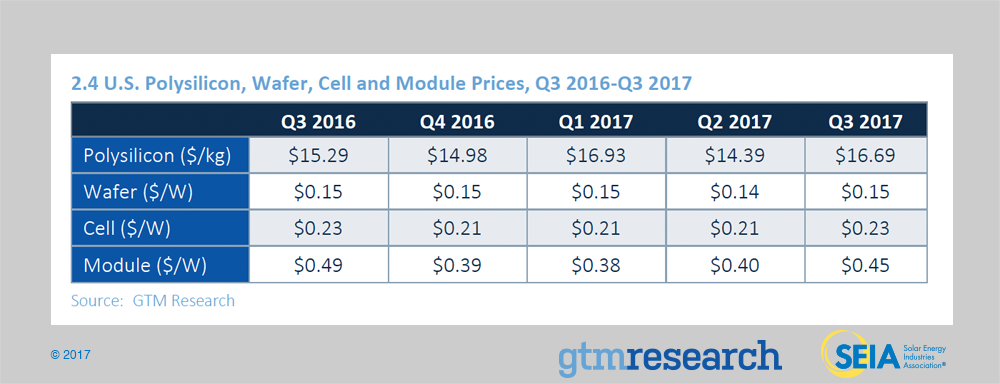
- For polysilicon, the quarterly average price increased 16% quarter-over-quarter to $16.7/kg in Q3 2017. Polysilicon price growth has been driven by low supply as select firms operated at lower utilizations, some undergoing annual maintenance and others undergoing environmental inspections.
- Multi wafer and cell prices were up quarter-over-quarter, to a respective $0.15/W and $0.23/W. Price trends were driven by high input costs, low inventories and steady global demand.
- In the past few years, U.S. module price trends were largely driven by antidumping and countervailing duties on Chinese suppliers. But recently the main driver has shifted; current module price trends are largely a result of supply-demand tightness, with prices increasing to an average of $0.45/W for standard multi modules as buyers seek inventory ahead of the uncertainties regarding the outcome of the Section 201 trade case most likely to go into effect in Q1 2018 if President Trump decides to implement remedies.
About the Report
U.S. Solar Market Insight® is a quarterly publication of Wood Mackenzie, Limited, and the Solar Energy Industries Association (SEIA®). Each quarter, we collect granular data on the U.S. solar market from nearly 200 utilities, state agencies, installers and manufacturers. This data provides the backbone of this U.S. Solar Market Insight® report, in which we identify and analyze trends in U.S. solar demand, manufacturing and pricing by state and market segment. We also use this analysis to look forward and forecast demand over the next five years. All forecasts are from Wood Mackenzie, Limited; SEIA does not predict future pricing, bid terms, costs, deployment or supply.
- References, data, charts and analysis from this executive summary should be attributed to “Wood Mackenzie, Limited/SEIA U.S. Solar Market Insight®.”
- Media inquiries should be directed to Mike Munsell at GTM Research and Alex Hobson at SEIA.
- All figures are sourced from Wood Mackenzie, Limited. For more detail on methodology and sources, visit www.gtmresearch.com/solarinsight.
- GTM Research partners with Clean Power Research to acquire project-level datasets from participating utilities that utilize the PowerClerk product platform. For more information on Clean Power Research’s product offerings, visit www.cleanpower.com.
Our coverage in the U.S. Solar Market Insight reports includes 43 individual states and Washington, D.C. However, the national totals reported include all 50 states, Washington, D.C., and Puerto Rico.
Detailed data and forecasts for 43 states and Washington, D.C. are contained within the full version of this report, available here.
Author’s Note: Revision to U.S. Solar Market Insight report title
GTM Research and SEIA have changed the naming convention for the U.S. Solar Market Insight report series. Starting with the report released in June 2016 onward, the report title will reference the quarter in which the report is released, as opposed to the most recent quarter in which installation figures are tracked. The exception will be our Year in Review publication, which covers the preceding year’s installation volumes despite being released during the first quarter of the current year.
About the Authors
GTM Research | U.S. Research Team
Austin Perea, Solar Analyst (lead author)
Cory Honeyman, Associate Director of U.S. Solar
Allison Mond, Solar Analyst
MJ Shiao, Director of Solar Research
Jade Jones, Senior Solar Analyst
Scott Moskowitz, Senior Solar Analyst
Colin Smith, Solar Analyst
Benjamin Gallagher, Solar Analyst
Solar Energy Industries Association | SEIA
Shawn Rumery, Director of Research
Aaron Holm, Data Engineer
Katie O’Brien, Research Associate
Justin Baca, Vice President of Markets & Research