Solar Market Insight Report 2018 Q4
Other Links: Purchase the Full Report | Press Release
The quarterly SEIA/Wood Mackenzie Power & Renewables U.S. Solar Market InsightTM report shows the major trends in the U.S. solar industry. Learn more about the U.S. Solar Market Insight Report. Released December 13, 2018
Key Figures
- In Q3 2018, the U.S. solar market installed 1.7 GWdc of solar PV, a 15% decrease from Q3 2017 and a 20% decrease from Q2 2018.
- The market stabilization of the residential sector continued this quarter. It was the third consecutive quarter in which residential PV was essentially flat on both a year-over-year and quarter-over-quarter basis after a year in which the market contracted by 15%.
- Non-residential PV grew 6% quarter-over-quarter and declined by 6% year-over-year.
- For the first time since 2015, quarterly additions of utility solar PV fell below 1 GWdc, highlighting the impact of the Section 201 module tariff uncertainty in late 2017 and early 2018.
- Wood Mackenzie expects 3.5 GWdc of utility PV to be installed in Q4, which would make it the largest quarter for utility PV installations since Q4 2016. Many projects that were on hold in the early part of the year due to tariff uncertainty are expected to come online later this year.
- Utility solar procurement has exploded in the aftermath of Section 201 tariff uncertainty. Thus far in 2018, 11.2 GWdc worth of projects have been announced.
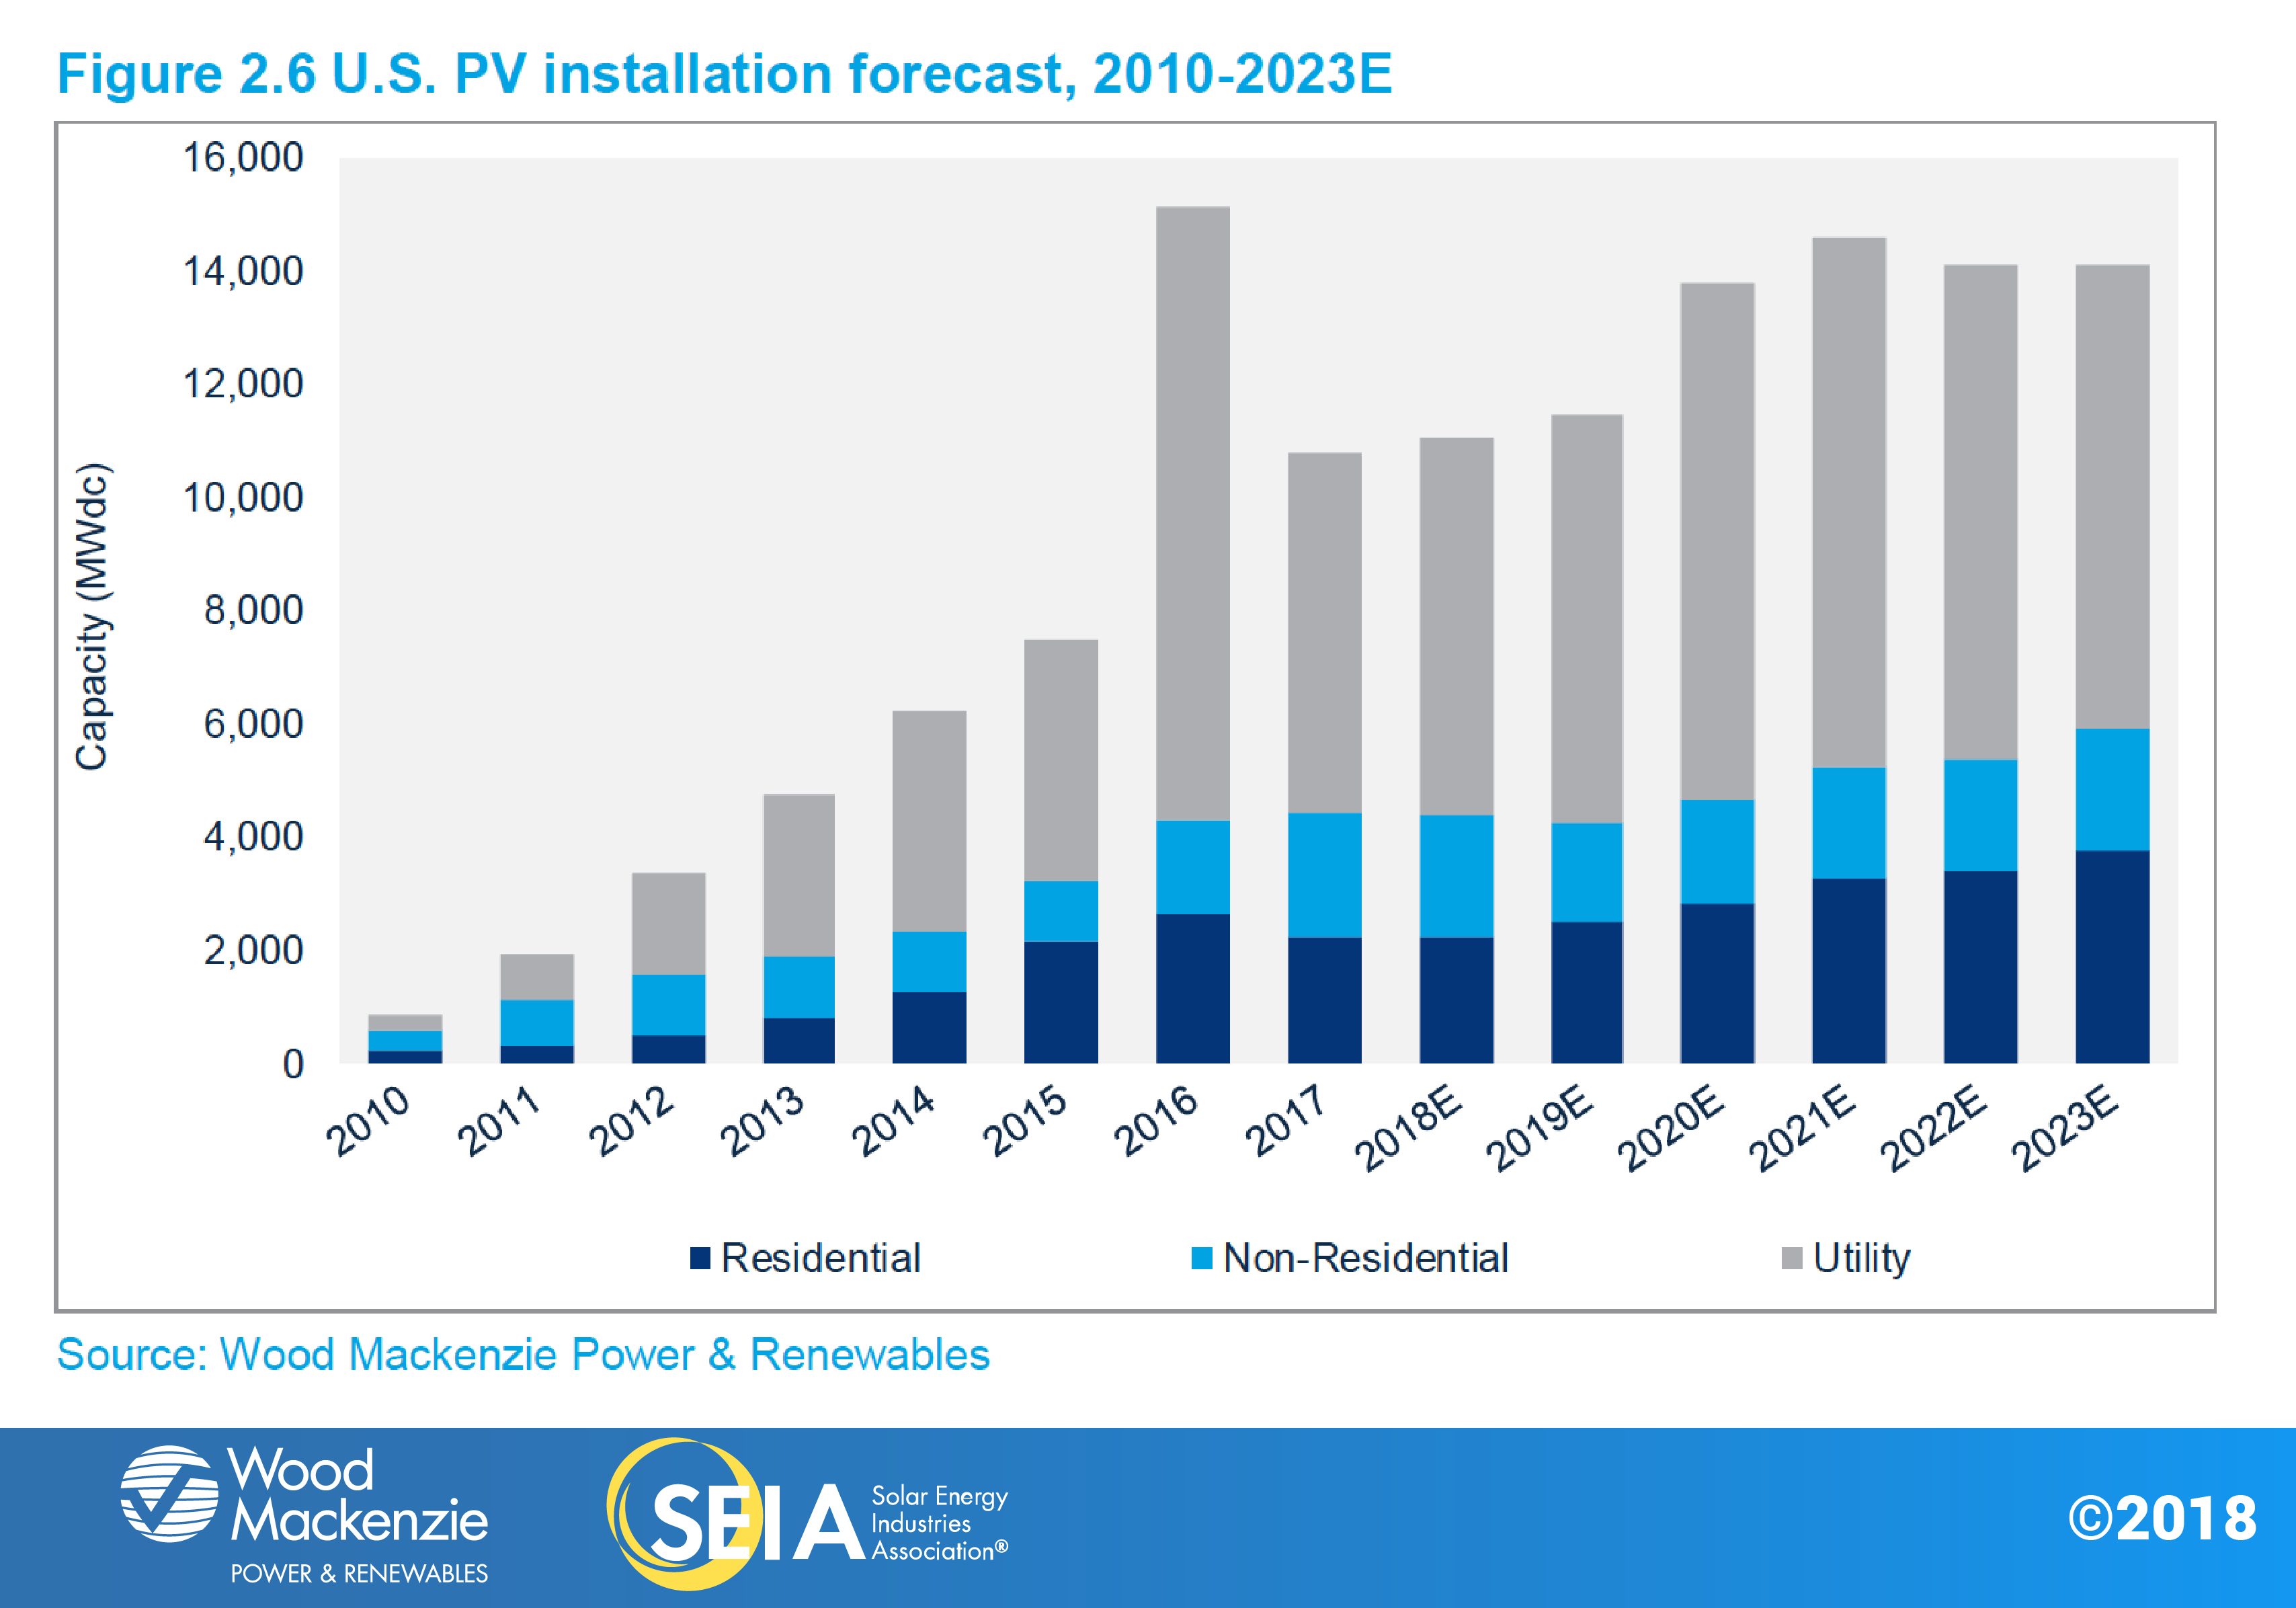
- Wood Mackenzie forecasts virtually flat growth in 2018 vs. 2017, with 11.1 GWdc of new PV installations expected.
- Total installed U.S. PV capacity is expected to more than double over the next five years. By 2023, over 14 GWdc of PV capacity will be installed annually.
1. Introduction
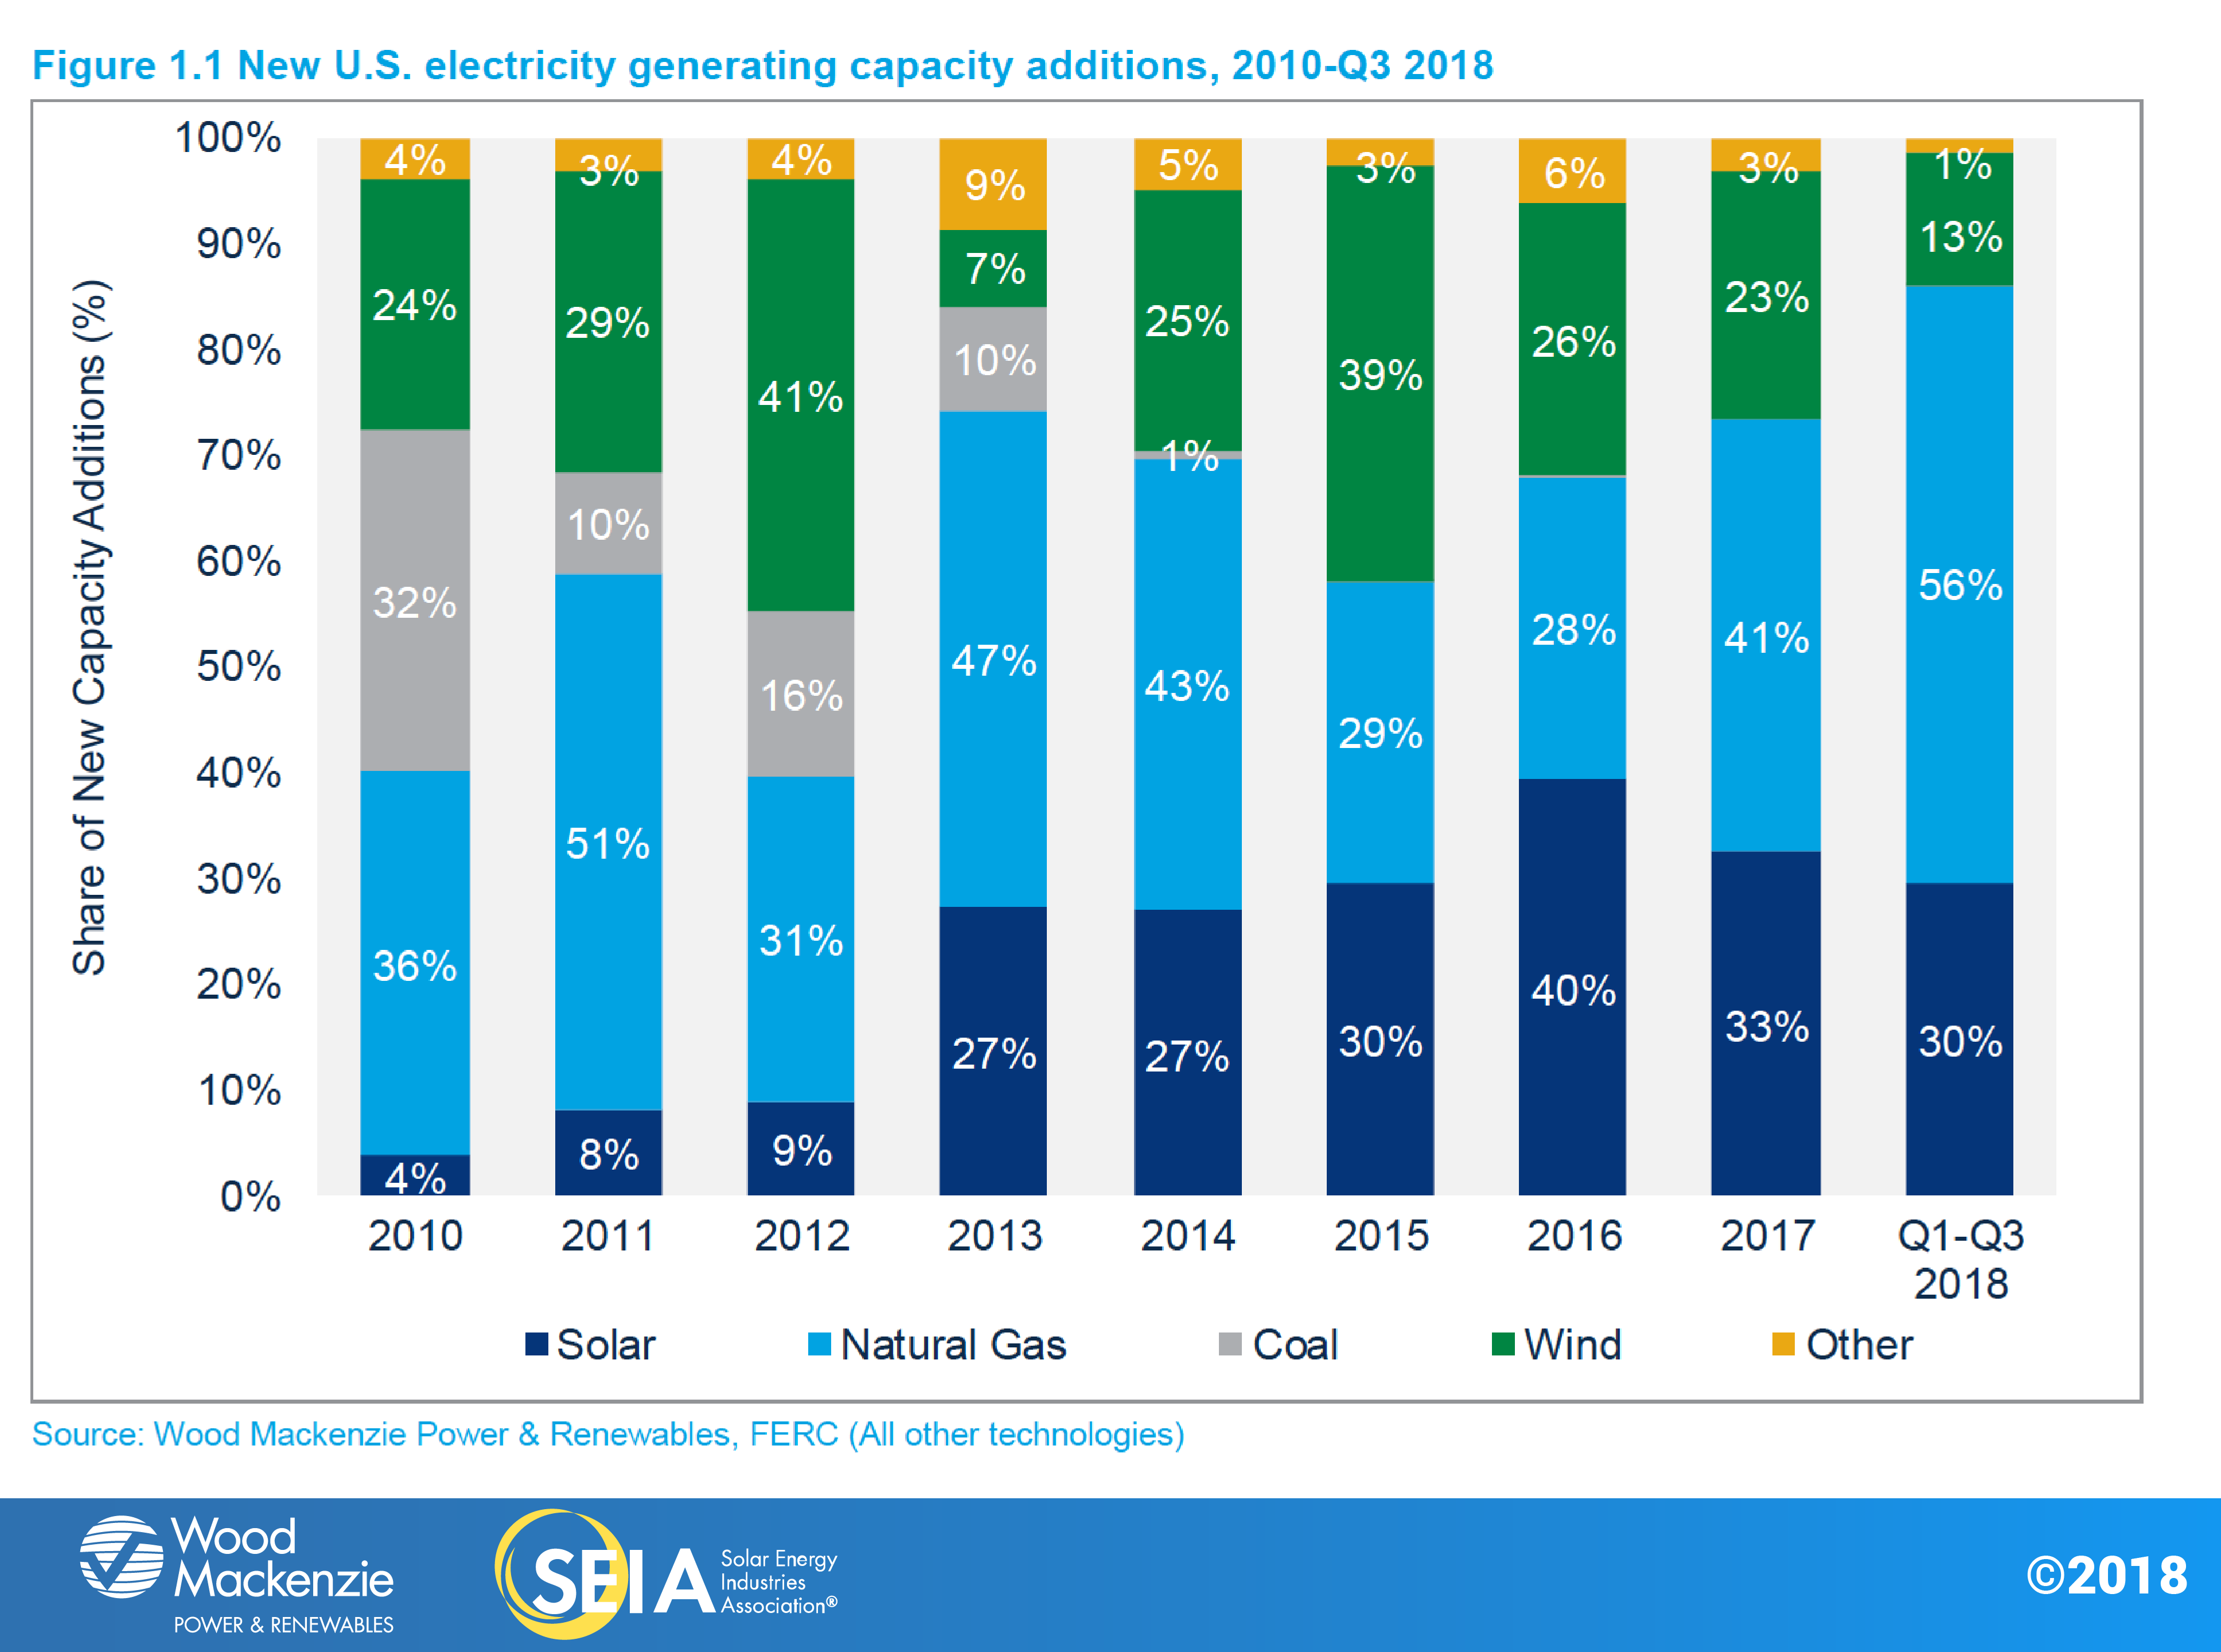
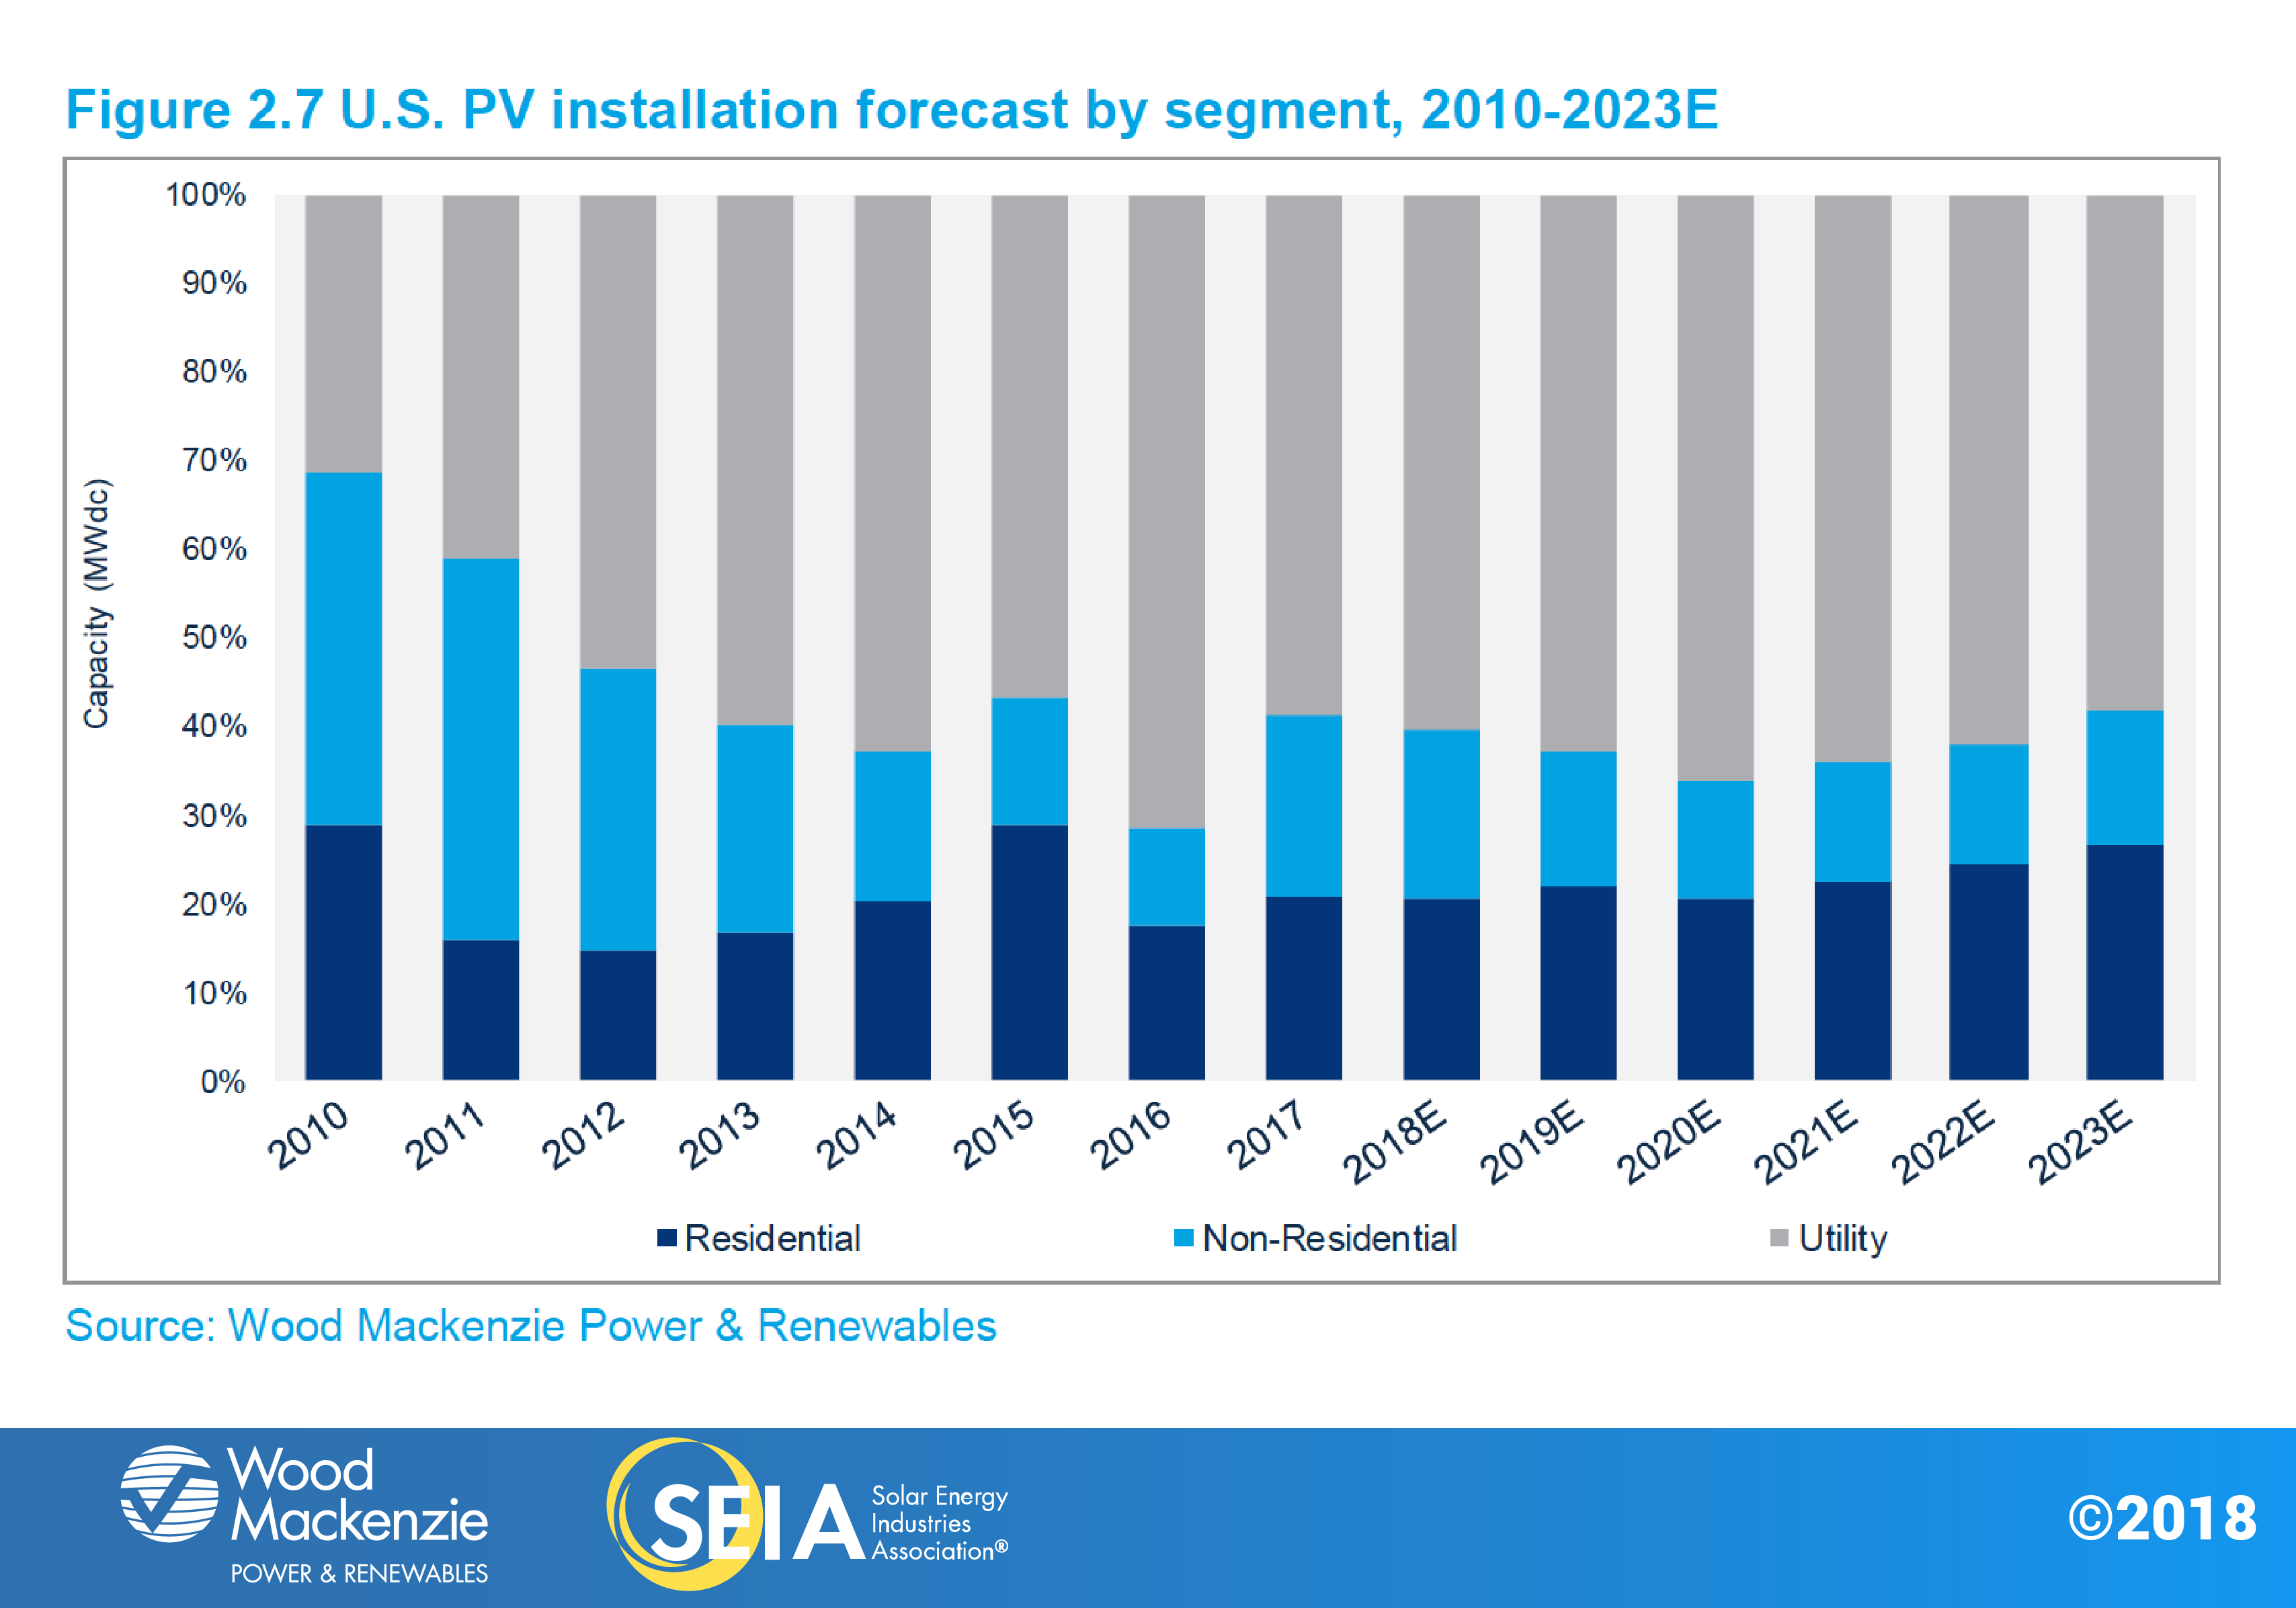
In Q3 2018, the U.S. solar market installed 1.7 gigawatts direct current (GWdc) of solar photovoltaic (PV) capacity. While residential and non-residential installations were flat and slightly up, respectively, utility PV accounted for the lowest share of new solar capacity since Q1 2012 at 39%. Utility solar contracted below 1 GWdc this quarter, demonstrating the impacts of Section 201 tariff uncertainty earlier in the year. Overall, through the first three quarters of the year, solar PV has accounted for 30% of new electricity generating capacity additions – a lower share compared to 2017 because of a surge in new natural-gas plants in 2018.
With 2018 nearly at a close, a major story continues to be the stabilization of residential solar. After a year in which residential PV contracted by 15%, the cadence of quarterly installation volumes has remained steady in 2018. Since Q4 2017, residential installations have not deviated by more than 1% on a quarter-over-quarter basis, demonstrating the steadiness of the sector. Stable installation volumes are an encouraging sign that the national installer slowdown that disproportionately contributed to volume contraction in
2017 has finally bottomed out in 2018. In Q3, national installer market share stopped declining in many major state markets – particularly in California, which is on pace for single-digit-percentage annual growth.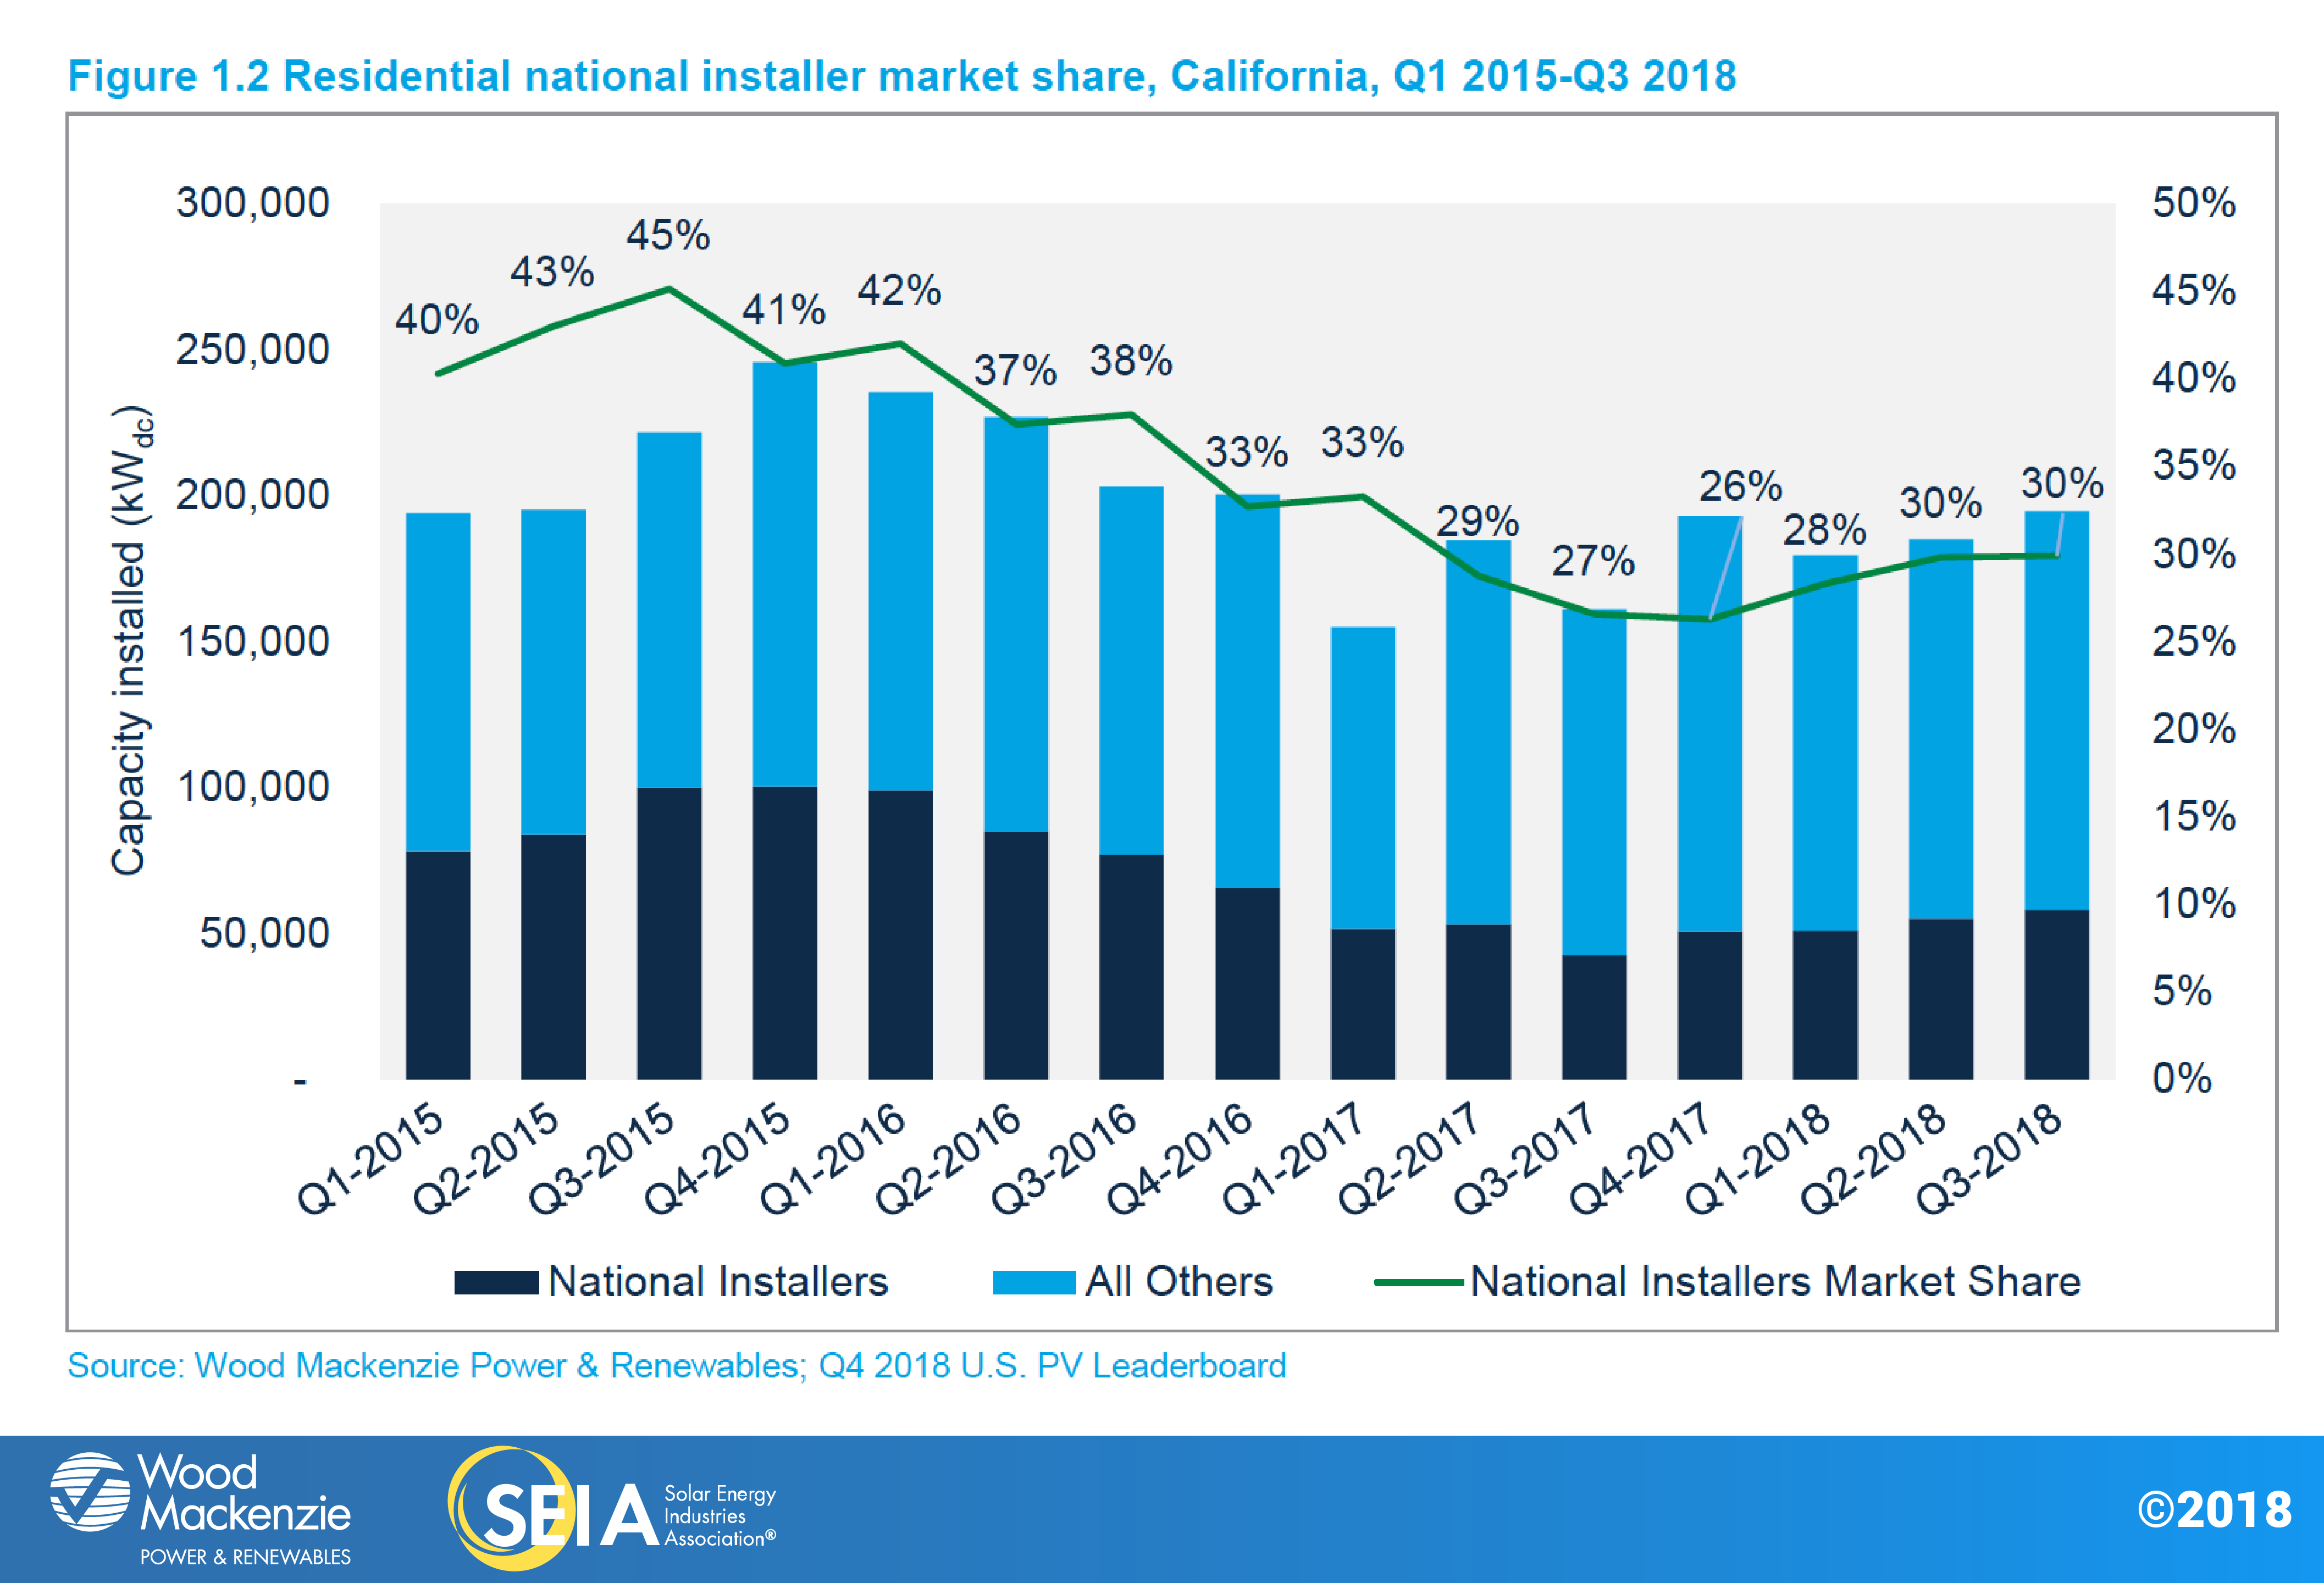 That said, customer-acquisition costs remain high for installers of all sizes, hindering growth. Of the top 10 markets in 2017, eight are expected to fall or remain flat in 2018. However, limited rebound from key major markets – notably California – coupled with emerging market maturity will help to offset major market stagnation, leading to a flat market in 2018.
Q3 was a notable quarter for the non-residential distributed solar segment. New York experienced record installations as a waning pipeline of grandfathered remote net-metering projects were interconnected, despite being constructed in 2017. Meanwhile, community solar continues to be a bright spot in non-residential PV. Primarily led by Minnesota and Massachusetts, well over 400 MW of community solar have been installed through Q3 of this year, with buildout expected to continue in core and emerging state markets.
Regulatory cliffs and policy reform have led to a decline in non-residential build-out in the major markets of California and Massachusetts. However, this decline – primarily in California – is not expected to be as severe as previously anticipated. In California, the viability of the pipeline of projects grandfathered in under solar-friendly time-of-use rates has been higher than previously assumed. But in Massachusetts, there’s been a significant year-over-year decline in projects as the industry awaits the start of the Solar Massachusetts Renewable Target (SMART) program. Overall, we still expect the non-residential segment to fall year-over-year, as growth in other markets is not expected to compensate for these slowdowns in California and Massachusetts.
Despite seeing the lowest quarterly installation volume since 2015, utility PV still accounted for the largest share of U.S. solar capacity installed in Q3. Fully 678 MWdc of utility PV was installed, making up 39% of quarterly capacity additions and bringing the 2018 year-to-date total to 3.1 GWdc. Abnormally low installation volumes appear to be the ripple effects from projects delayed due to uncertainty surrounding module tariffs in 2017. Developers’ uncertainty around the impacts of tariffs on project economics caused Q3 2018 projects to be pushed out to Q4 2018 or Q1 2019. However, with over 40 projects greater than 50 MWdc slated to come online in Q4 2018, Wood Mackenzie expects 3.5 GWdc of utility PV to be installed in Q4, which would make it the largest quarter since Q4 2016.
Remarkably, procurement of U.S. utility solar has exploded in 2018, with a total of 11.2 GWdc of projects announced over that timeframe. The uptick in procurement can be attributed to projects put on hold in early 2017 while developers waited for clarity on the Section 201 tariffs. However, declines in module costs due to a shift in Chinese feed-in tariff policy is driving additional procurement. We have also seen a rise in announcements for additional solar procurement including Consumers Energy’s (Michigan) plan to procure 5.0 GWac by 2030 and Entergy Arkansas’ plan to procure 800 MWac of renewables by 2027. The increase in project announcements and procurement plans has increased Wood Makenzie’s 2018-2023 forecast by 1.7 GWdc.
2. Photovoltaics
2.1. Market Segment Trends
2.1.1. Residential PV
Key Figures
- 581 MWdc installed in Q3 2018
- Up 1.2% quarter-over-quarter
- Up 11% year-over-year
For the third consecutive quarter of 2018, residential solar PV remained flat. Third quarter performance reinforces the narrative of 2018 as a year of stabilization for the segment after a year in which the market saw 15% contraction. Though growth has been minimal, installation numbers over the first three quarters of the year show promising signs that the slowdown from national installers has largely abated, even as segmentwide customer-acquisition challenges remain.
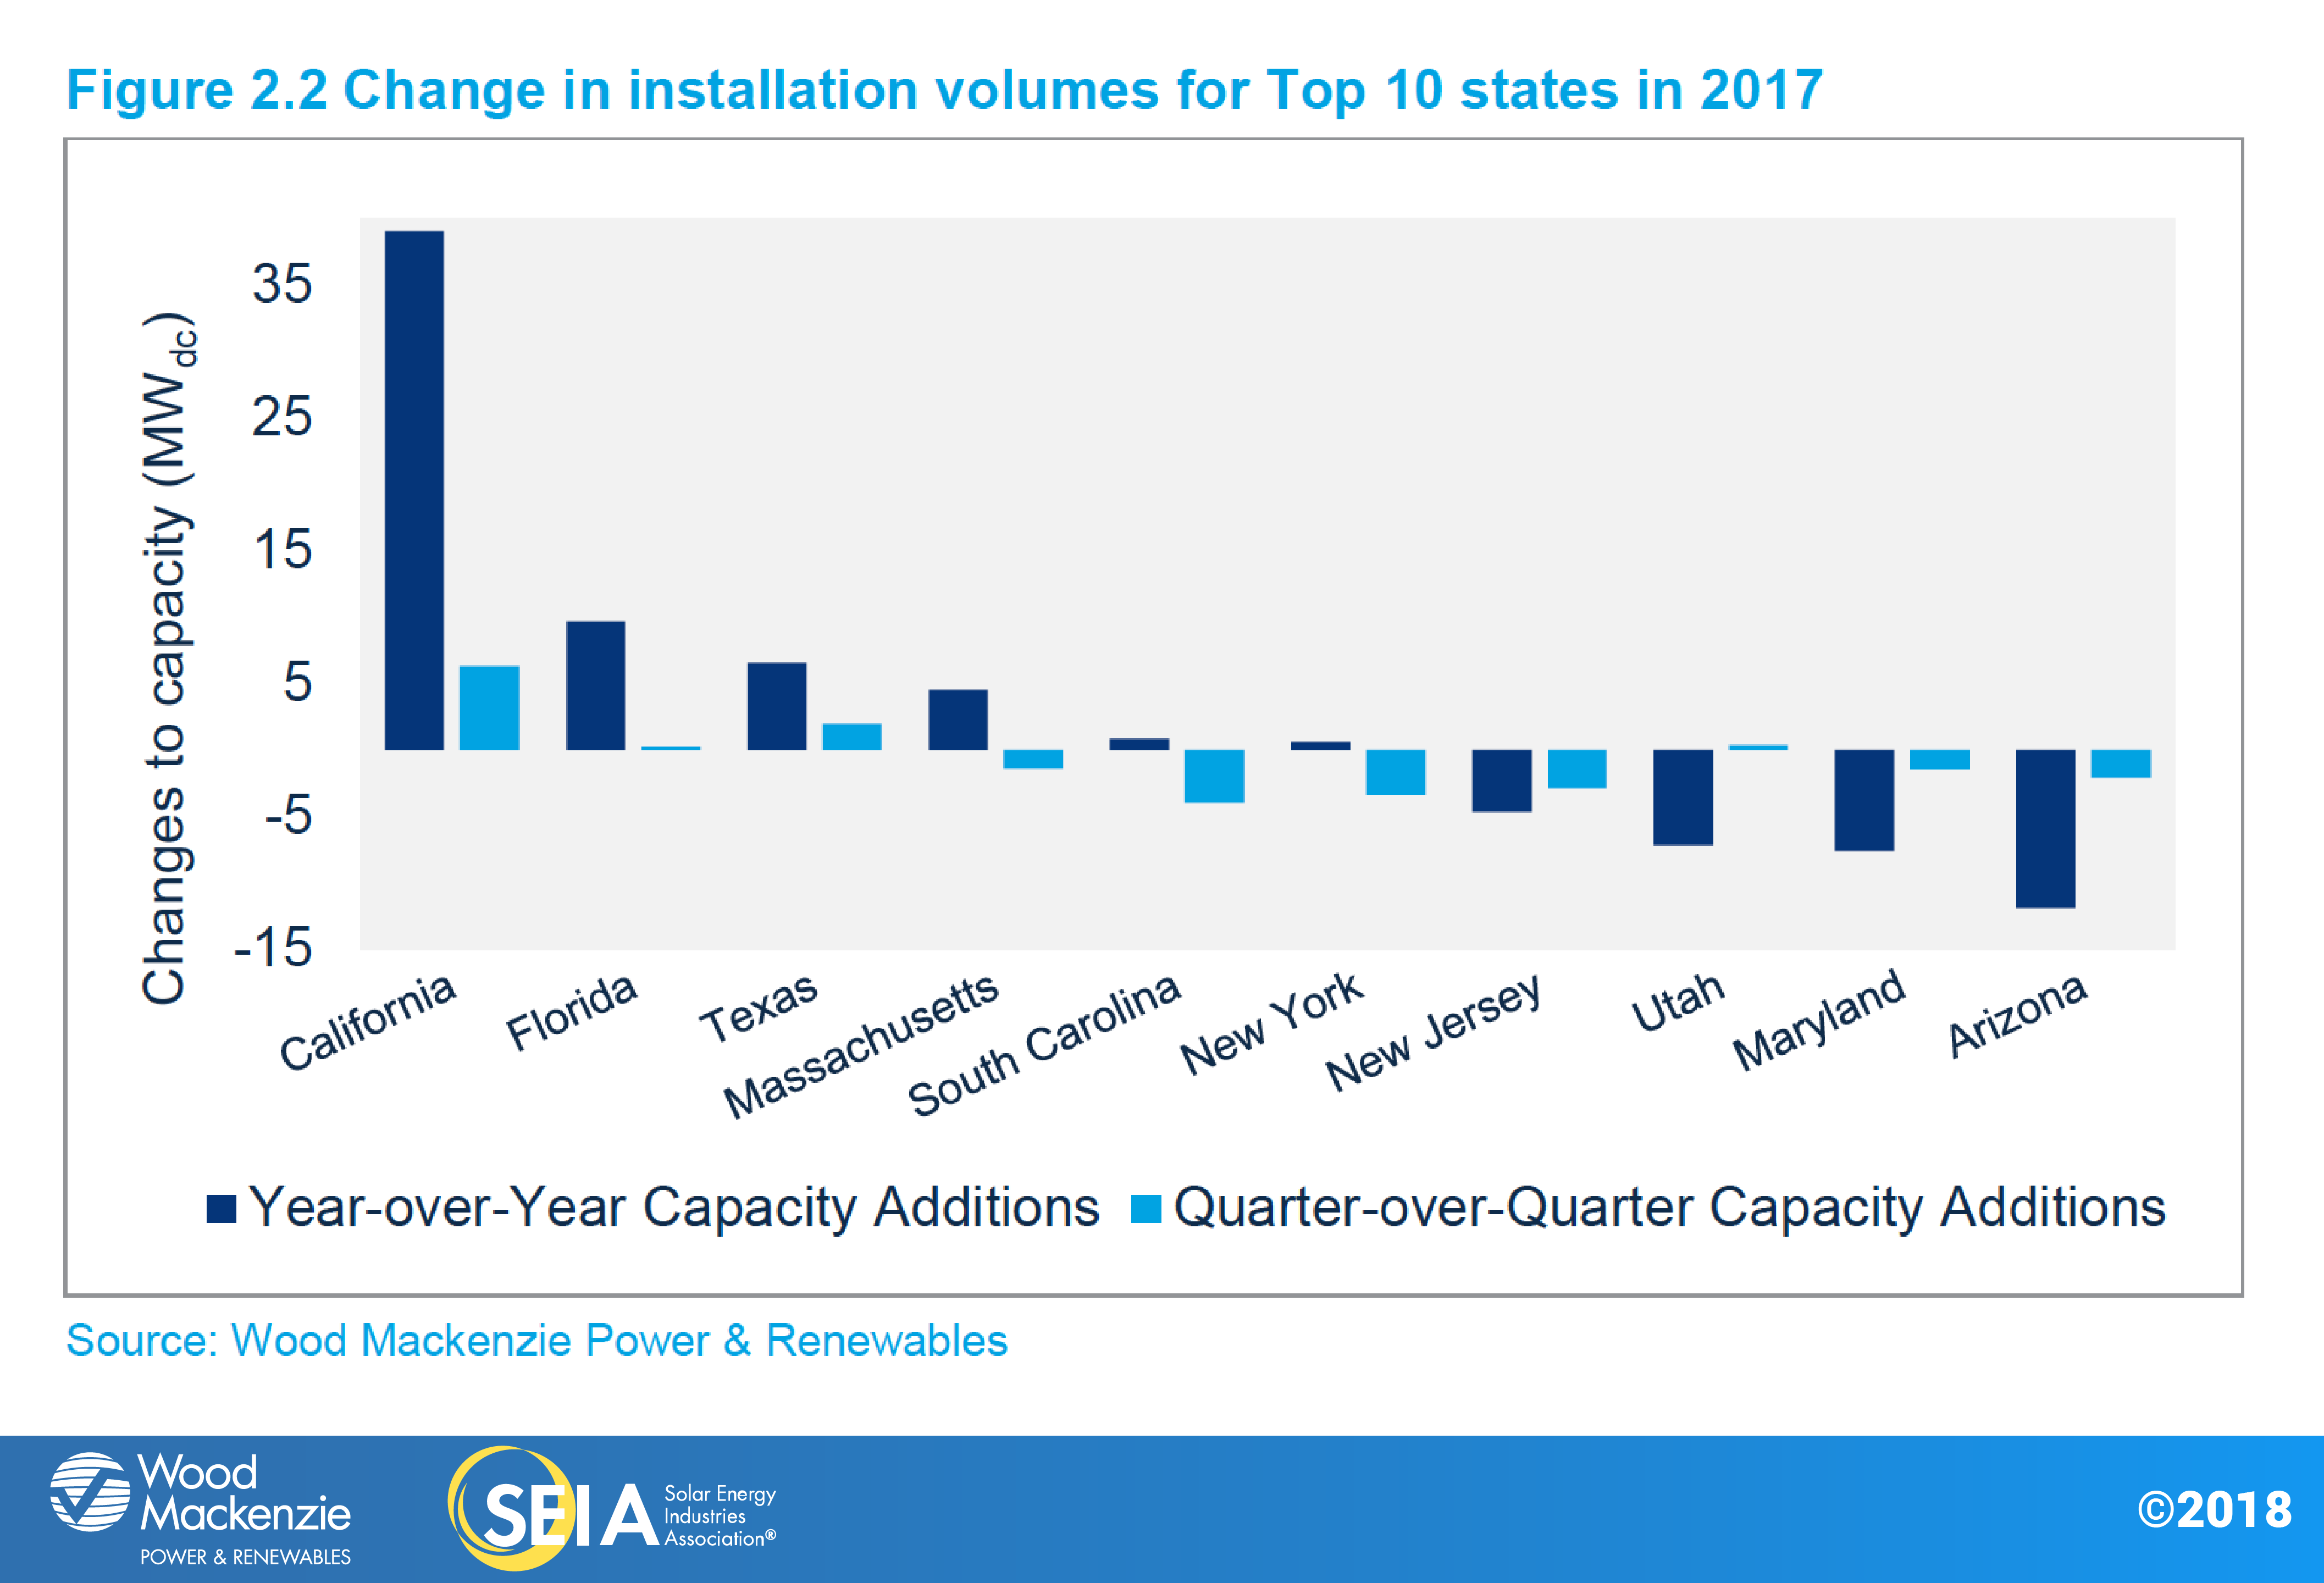
Despite some stabilization in 2018, major markets continue to exhibit signs of stagnation. All but one of the top 10 markets of 2017 (in chart below) saw flat or declining installation volumes on a quarter-over-quarter basis, as the lingering effects of national installer pullback and customer-acquisition issues continue to constrain growth. One exception is Nevada, which is still experiencing steady installation growth as national installers reap the rewards of re-establishing sales operations since net metering was reinstated in mid-2017. Meanwhile, California – the first state to experience weakness in 2016 – is also the first major market to experience recovery. Limited recovery in California combined with emerging market growth will lead to a flat 2018.
2.1.1. Non-residential PV
Key Figures
- 492 MWdc installed in Q3 2018
- Up 6% from Q2 2018
- Down 6% from Q3 2017
The non-residential sector continues to benefit from a robust pipeline of projects grandfathered in under more favorable policies. California is experiencing commercial solar build-out in 2018 stemming from developers rushing to install projects to meet a (since-lifted) deadline to be grandfathered in under solar-friendly time-of-use rates. Meanwhile, New York saw a record-breaking quarter as the remnants of a waning pipeline of remote net-metering projects was built out. Additionally, the build-out of Xcel Energy’s robust community solar pipeline in Minnesota still accounts for a significant share of non-residential growth, with over 230 MWdc built out over the first half of the year. In total, over 400 MW of community solar has been built out in the first three quarters of 2018.
2.1.1. Utility PV
Key Figures
- 678 MWdc installed in Q3 2018
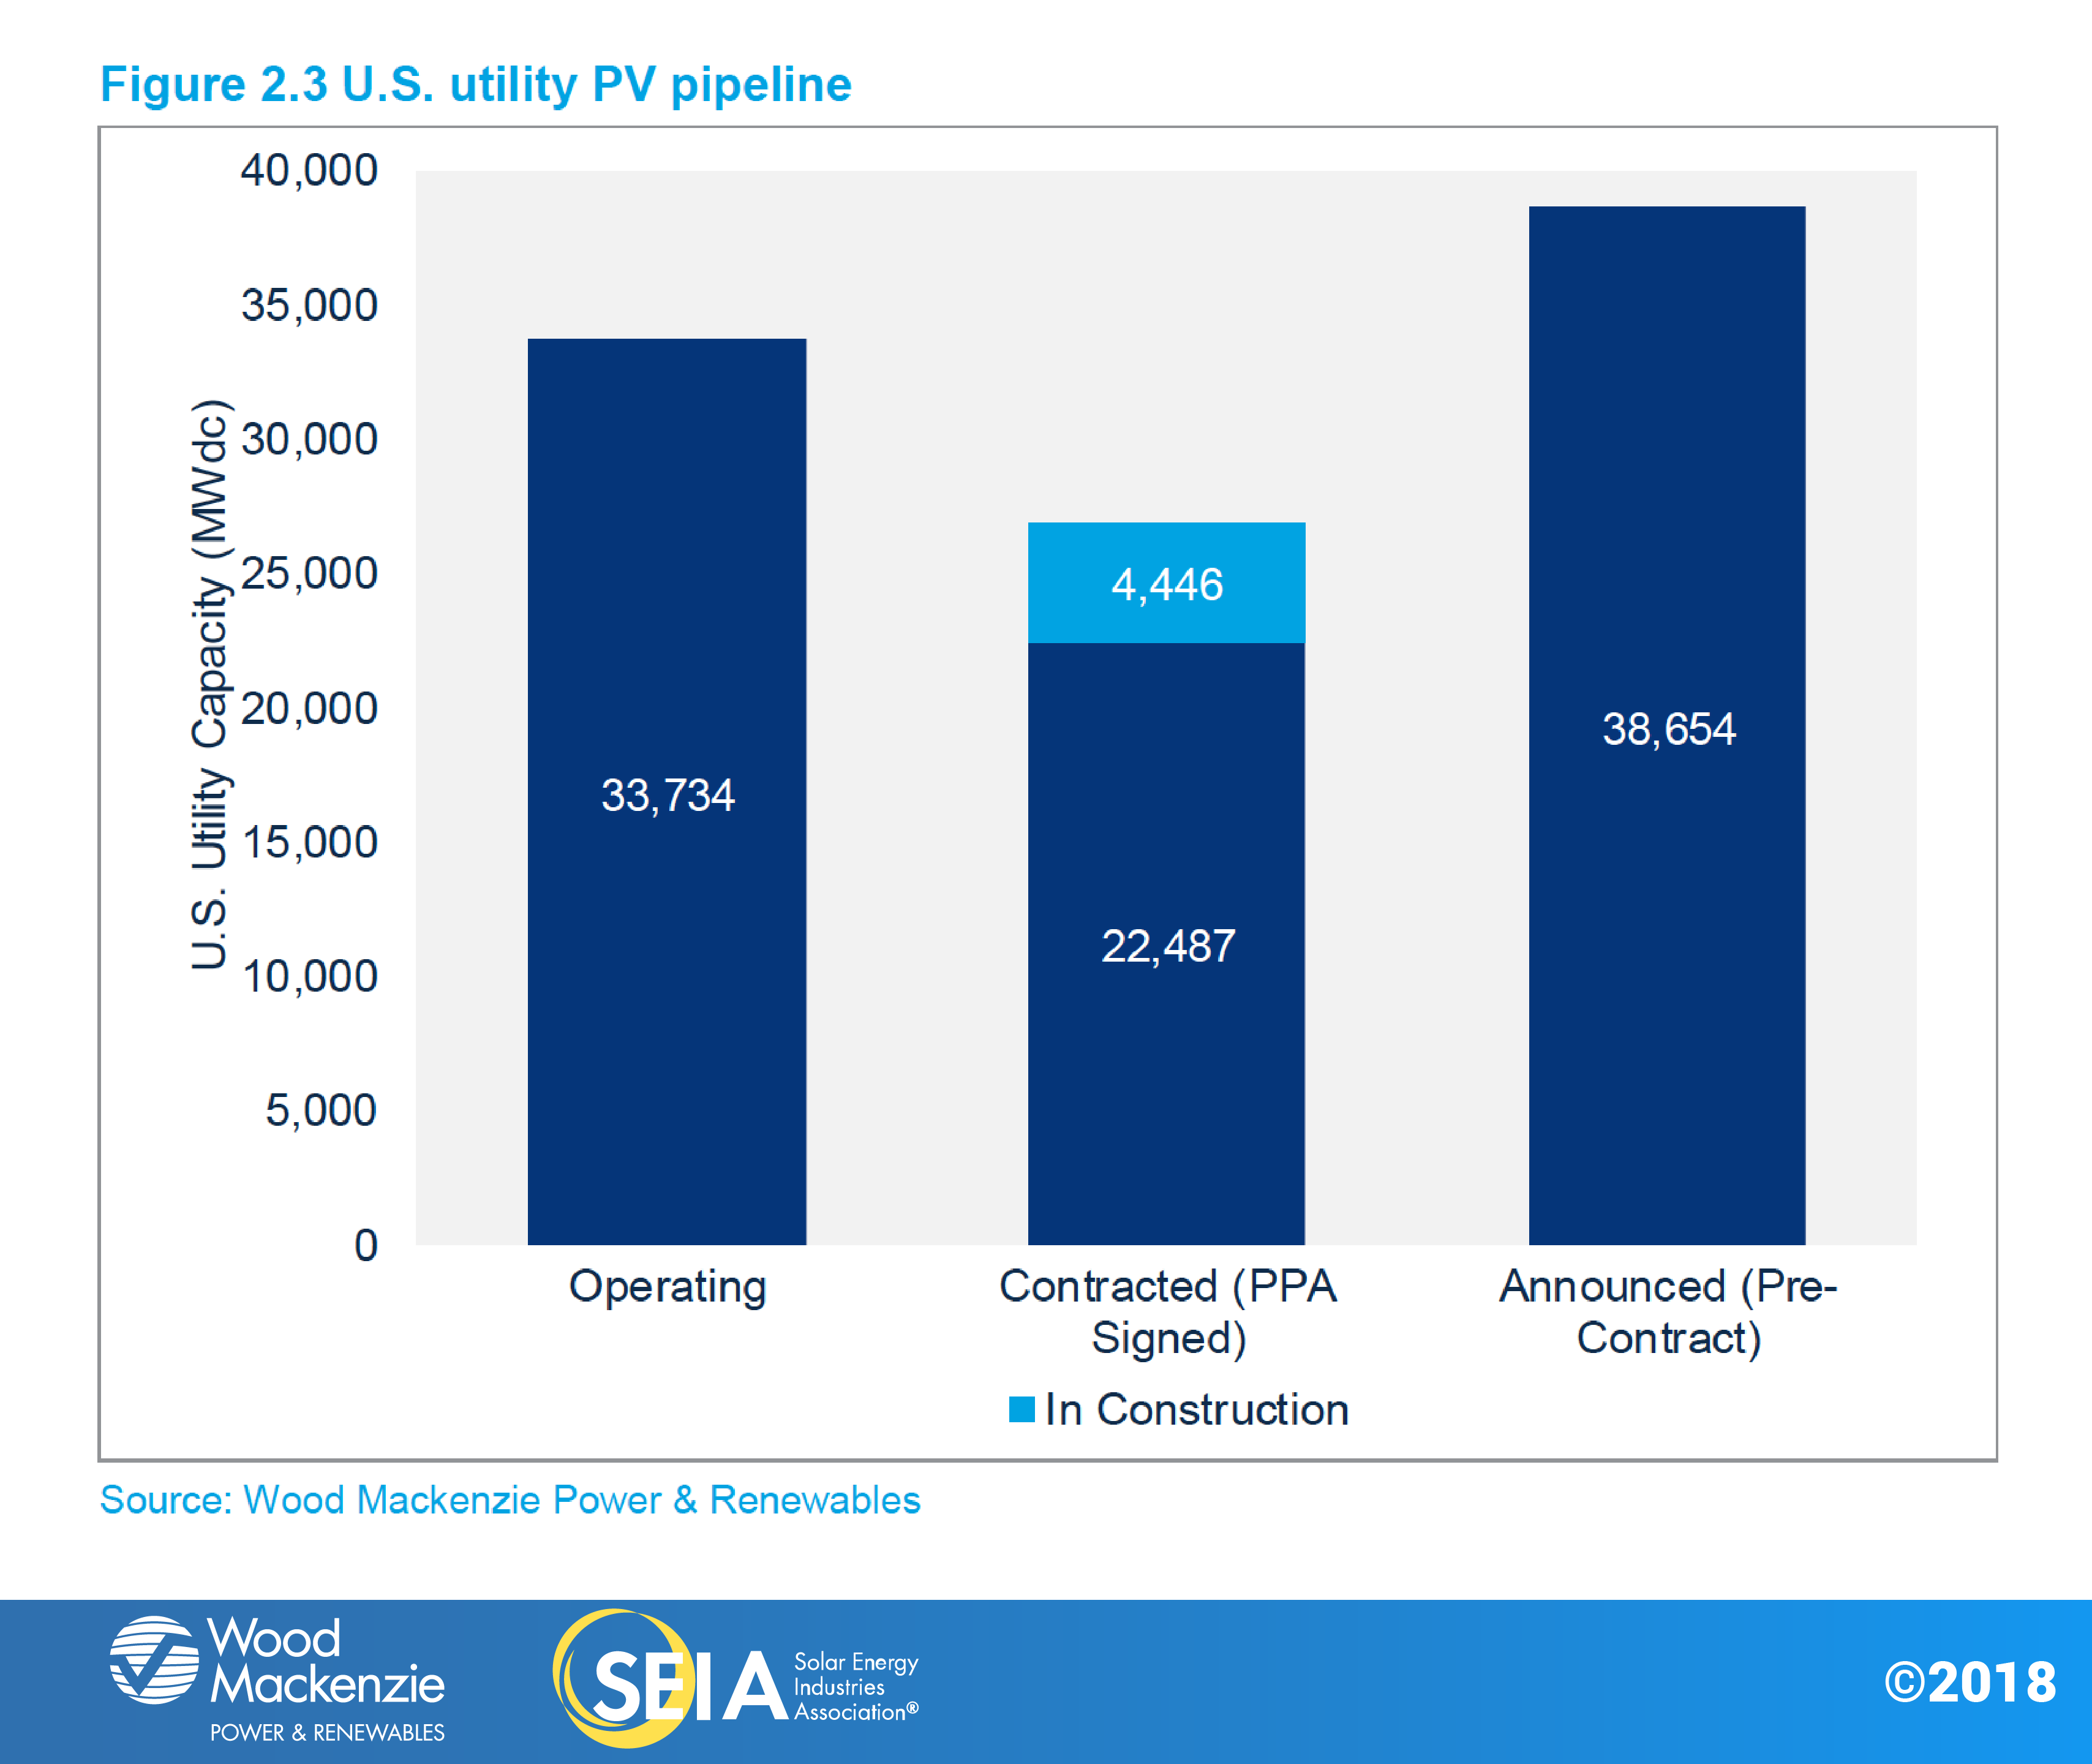
- Contracted utility PV pipeline currently totals 26.5 GWdc
- First quarter since Q3 2015 with less than 1.0 GWdc of new capacity additions
This is the first quarter that utility solar additions dipped below 1 GWdc. Section 201 module tariff uncertainty caused developers to delay projects to Q4 2018 or Q1 2019 since project economics were unclear. But the dip in installation volumes now is expected to be matched with high installation volumes later. With over 40 projects greater than 50 MWdc planned to come online in Q4 2018, Wood Mackenzie expects 3.5 GWdc of utility PV to be installed in Q4, which would make it the largest quarter since Q4 2016.
Utility solar procurement has continued to grow substantially in 2018. There were 2.7 GWdc worth of PPAs signed in Q3 2018, bringing the total volume of new procurement in 2018 to 11.2 GWdc. As mentioned, the uptick in procurement can be attributed to projects put on hold in early 2017 while developers waited for clarity on the Section 201 tariffs. At the same time, the decline in module costs has driven additional procurement. We have also seen a rise in announcements for additional solar procurement including Consumers Energy’s (Michigan) plan to procure 5.0 GWac by 2030 and Entergy Arkansas plan to procure 800 MWac of renewables by 2027. The increase in project announcements and procurement plans has increased Wood Mackenzie’s 2018-2023 forecast by 1.7 GWdc.
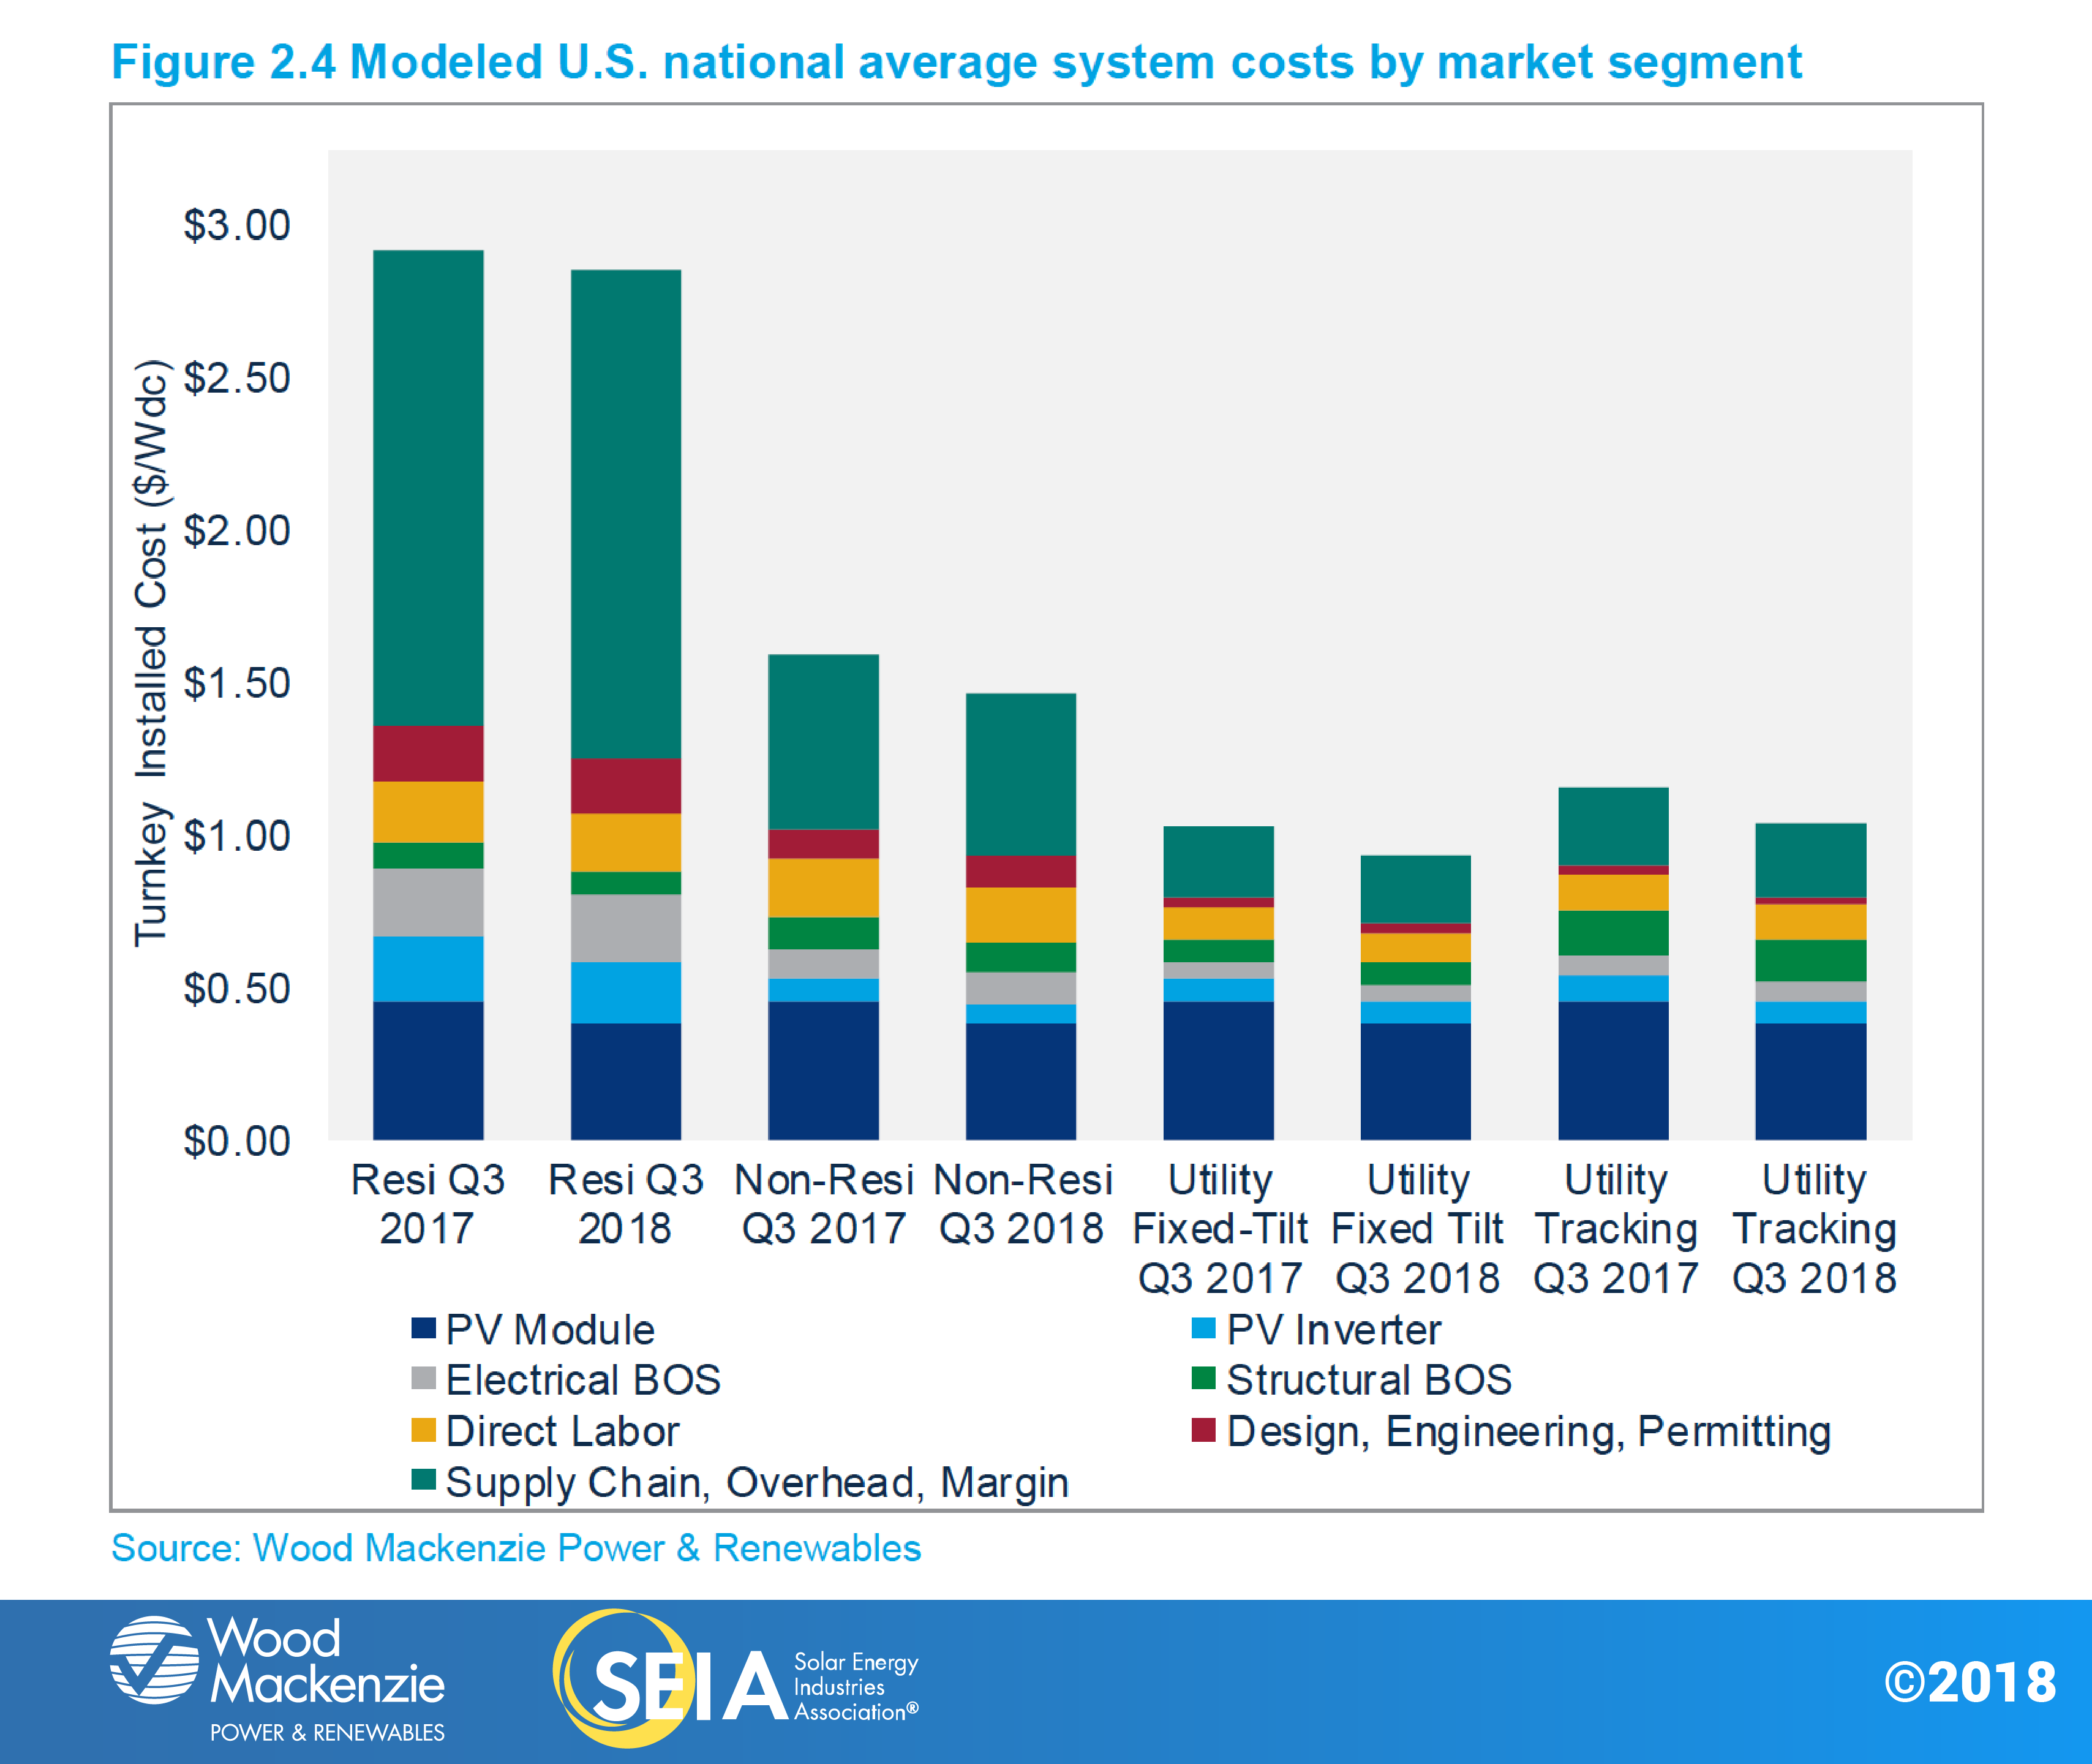
2.2. National Solar PV System Pricing
We employ a bottom-up modeling methodology to track and report national average PV system pricing for the major market segments. This methodology is based on tracked wholesale pricing of major solar components and data collected from interviews with major installers.
Note: Detailed information about national system prices by market segment and component is available in the full report.
In Q3 2018, for the second quarter in a row, system pricing fell in all market segments. System pricing fell by 1.1%, 2.1%, 3.3% and 2.9% in the residential, non-residential, utility fixed-tilt and utility single-axis tracking markets, respectively. Prices across market segments are now all at historic lows despite tariffs on modules, inverters, aluminum and steel: $2.85/Wdc, $1.47/Wdc, $0.93/Wdc and $1.04/Wdc for residential, non-residential, utility fixed-tilt and utility single-axis tracking systems, respectively. Almost all of the changes in system pricing this quarter were due to the fall in module pricing. For distributed solar, the pre-Section 201 norms are back in place. Hyper-aggressive module pricing has absorbed the downstream impact of higher customer-acquisition costs. Ultimately, this resulted in flat balance-of-system (BOS) component prices quarter-over-quarter.
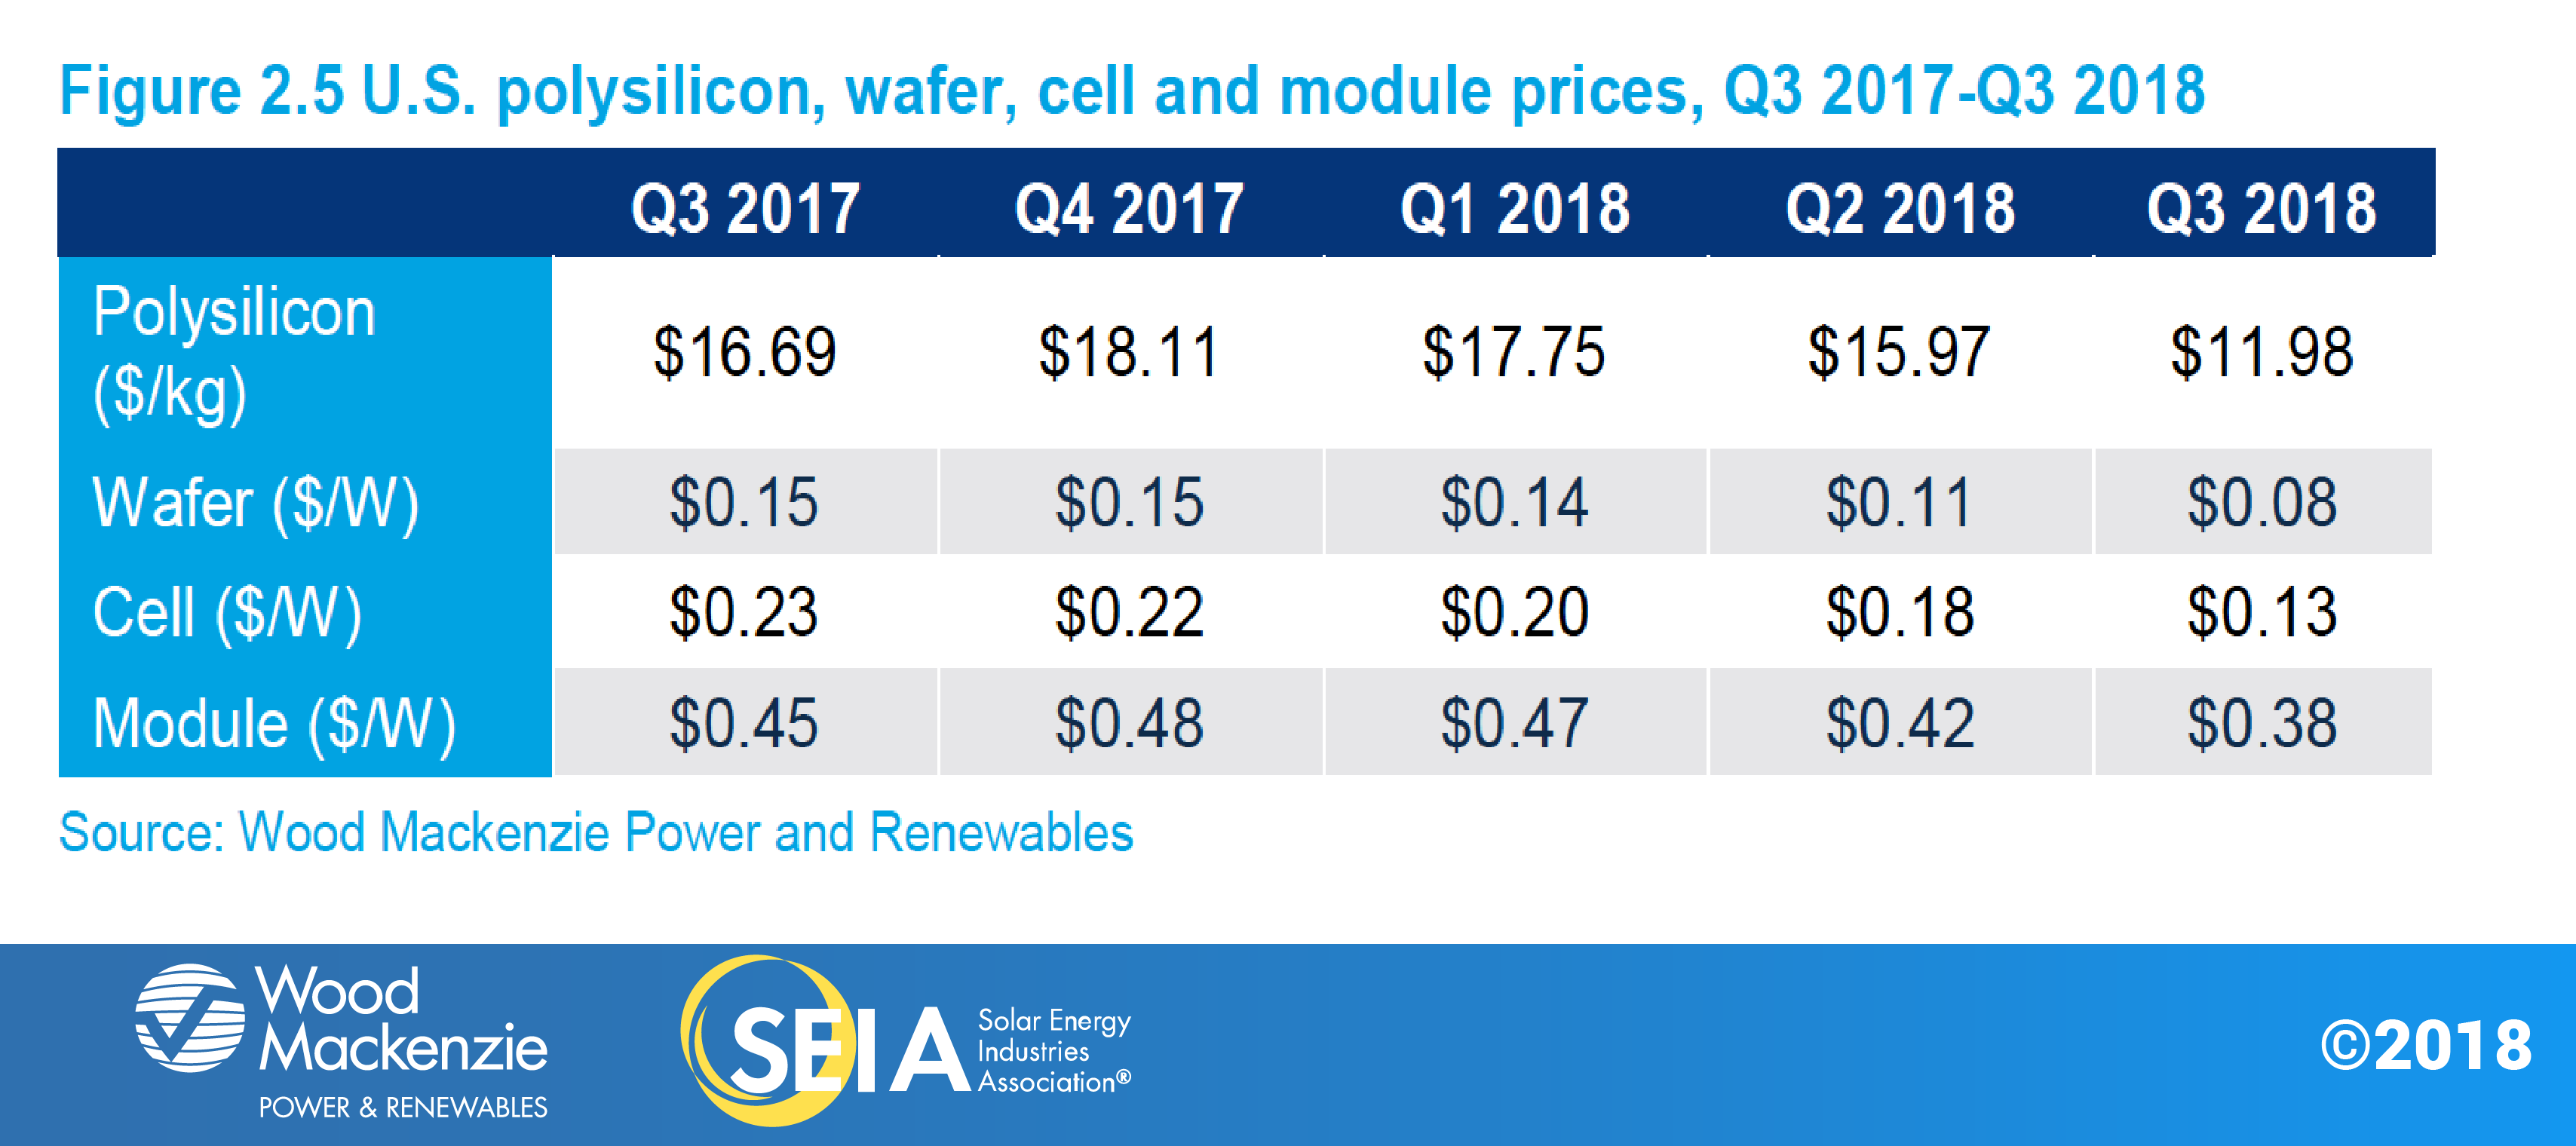
2.3. Component Pricing
Component prices fell in Q3 2018 as the market entered a global supply glut.
- Polysilicon, wafer and cell price declines were severe. For polysilicon producers, the quarterly average price fell 25% quarter-over-quarter to $11.98/kg in Q3 2018. Polysilicon prices fell in response to buyer pressure, lower demand and increased inventory. Multi wafer and cell prices fell 30% to $0.08/W and 25% to $0.13/W, respectively. Price trends were driven by a massive drop in demand and high inventory levels.
- Module prices in the U.S. fell in response to weak demand and competitive bidding as the global market fell into another oversupply cycle. Multi module prices averaged around $0.38/W in Q3 2018 and mono PERC prices averaged around $0.41/W.
2.4. Market Outlook
Wood Mackenzie forecasts a flat U.S. solar market in 2018. Utility PV is expected to grow 5% as most projects targeting 2018 completion were able to secure tariff-free module supply (either thin-film modules not subject to tariffs, imports from countries exempt from tariffs, or domestic product or modules imported before the new tariffs went into effect). Meanwhile, the non-residential market is forecasted to see limited decline. The pipeline of projects grandfathered in under a more favorable policy and incentive environment is waning despite a record-breaking year for community solar expected in 2018. Though most major residential markets are expected to contract again in 2018, emerging market growth in states like Florida and Nevada, combined with limited rebound in California, will help to offset major market weakness, ultimately resulting in a flat 2018 for that market segment.
We’ve decreased our 2018 utility solar forecast from 6.8 to 6.6 GWdc as we’ve become less confident in projects’ ability to come online before January. Several projects still show signs of spillover into 2019, creating downside risk for new capacity in Q4 but upside potential for additional projects in Q1 2019. Consequently, 2019 has been increased from 6.9 to 7.2 GWdc as some projects have already pushed out target completion dates.
2019 will be the year most heavily impacted by tariffs. Wood Mackenzie believes this is both a result of projects originally slated for 2019 pushing out target completion dates and developers looking to anchor projects to a 30% Investment Tax Credit in 2019 but procuring modules at a lower tariff rate in 2020. Over 30% of projects announced this year are targeting 2020 commercial operation dates (CODs), causing our outlook for 2020 to grow by 0.9 GWdc. Due to the ITC stepping down and the fear that interest rates may rise, several corporations have suggested that 2020 and 2021 may be the optimal time to sign a large offtake agreement.
The 2021-2023 utility solar forecast has seen a 1.3 GWdc combined increase. The year 2021 is now expected to be the peak year for U.S. utility solar, second only to 2016, at 9.4 GWdc, with mild stepdowns in 2022 and 2023 to 8.7 and 8.2 GWdc, respectively. Xcel Energy (Colo.) and NV Energy (Nevada) have stated they aim to bring the bulk of their utility solar projects online in 2021. A combined 2.2 GWdc from only two utilities is a large contributing factor to our 2021 forecast exceeding that for 2022.
After examining the risks of advanced procurement, many project developers now seem more open to anchoring projects in 2019 to claim the 30% ITC and bringing them online in 2021 or later. Several developers have suggested they will assess each project on a case-by-case basis, but overall they seem more willing to take on the risks of advance procurement. Wood Mackenzie expects to see at least half of 2023 capacity additions leverage a 22% or higher ITC.
For residential PV, a flat 2018 allows for a more robust rebound in 2019 as the market aligns to the growth expectations of small and medium-sized installers leveraging less expensive customer-acquisition channels. National growth rates will exceed 10% from 2019-2021 as emerging states scale. In the early years of the next decade, growth will be bolstered by the California mandate for nearly all new residential housing to include solar, as well as Illinois’ new Adjustable Block Program incentive. Together with Florida, these three states will account for 60% of residential capacity additions between 2018 and 2023.
Meanwhile, the non-residential PV market is on track for two consecutive down years as the grandfathered-project pipeline wanes in 2018 and the market acclimates to a reduced incentive environment across major state markets in 2019. However, this will be incrementally offset starting in 2020 as the next wave of states with robust community solar mandates – New York, Maryland, Illinois – begin to see the realization of those pipelines. Increasing solar-plus-storage viability will also begin to have an impact on non-residential demand. By 2023, we expect that roughly 30% of non-residential PV will come from community solar, and 20% or so will come from solar-plus-storage projects.
By 2020, 28 states in the U.S. are expected to be 100+ MWdc annual solar markets, with 25 of those states being home to more than 1 GWdc of operating solar PV. This compares to only two states with 100+ MWdc annual solar markets in 2010.
Forecast details by state (43 states plus Washington, D.C.) and market segment through 2023 are available in the full report.
About the Report
U.S. solar market insight® is a quarterly publication of Wood Mackenzie Power & Renewables, Inc. d/b/a Greentech Media and the Solar Energy Industries Association (SEIA)®. Each quarter, we collect granular data on the U.S. solar market from nearly 200 utilities, state agencies, installers and manufacturers. This data provides the backbone of this U.S. solar market insight® report, in which we identify and analyze trends in U.S. solar demand, manufacturing and pricing by state and market segment. We also use this analysis to look forward and forecast demand over the next five years. All forecasts are from Wood Mackenzie, Limited; SEIA does not predict future pricing, bid terms, costs, deployment or supply.
- References, data, charts and analysis from this executive summary should be attributed to “Wood Mackenzie/SEIA U.S. solar market insight®.”
- Media inquiries should be directed to Wood Mackenzie’s PR team ([email protected]) and Morgan Lyons ([email protected]) at SEIA.
- All figures are sourced from Wood Mackenzie. For more detail on methodology and sources, click here.
- Wood Mackenzie Power and Renewables (WM P&R) partners with Clean Power Research to acquire project-level datasets from participating utilities that utilize the PowerClerk product platform. For more information on Clean Power Research’s product offerings, visit https://www.cleanpower.com/
Our coverage in the U.S. solar market insight reports includes 43 individual states and Washington, D.C. However, the national totals reported include all 50 states, Washington, D.C. and Puerto Rico.
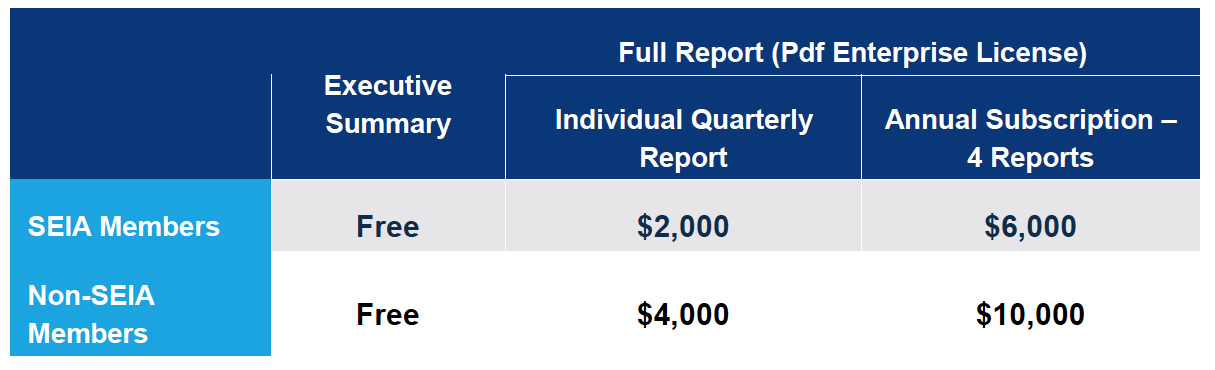
Our coverage in these reports includes 43 individual states and Washington, D.C. However, the national totals reported include all 50 states, Washington, D.C. and Puerto Rico. The U.S. solar market insight® is offered in two versions – the Executive Summary and the Full Report. The Executive Summary is free, and the Full Report is available individually each quarter or as part of an annual subscription. Detailed data and forecasts by state are available in the Full Report. To find out more, click here.
Note on U.S. solar market insight report title: WM P&R and SEIA have changed the naming convention for the U.S. solar market insight report series. Starting with the report released in June 2016 onward, the report title will reference the quarter in which the report is released, as opposed to the most recent quarter in which installation figures are tracked. The exception will be our year in review publication, which covers the preceding year’s installation volumes despite being released during the first quarter of the current year.
About the Authors
Wood Mackenzie Power & Renewables | U.S. Research Team
Austin Perea, Senior Solar Analyst (lead author)
Colin Smith, Senior Solar Analyst
Michelle Davis, Senior Solar Analyst
Allison Mond, Senior Solar Analst
Benjamin Gallagher, Senior Solar Analyst
Cory Honeyman, Director of Global Solar Research
Solar Energy Industries Association | SEIA
Shawn Rumery, Director of Research
Aaron Holm, Data Engineer
Rachel Goldstein, Research Analyst
Justin Baca, Vice President of Markets & Research