
Other Links: Purchase the Full Report | Press Release
The quarterly SEIA/Wood Mackenzie Power & Renewables U.S. Solar Market InsightTM report shows the major trends in the U.S. solar industry. Learn more about the U.S. Solar Market Insight Report. Released September 17, 2019.
Key Figures
- In Q2 2019, the U.S. solar market installed 2.1 GWdc of solar PV, representing a 7% decline from Q2 2018.
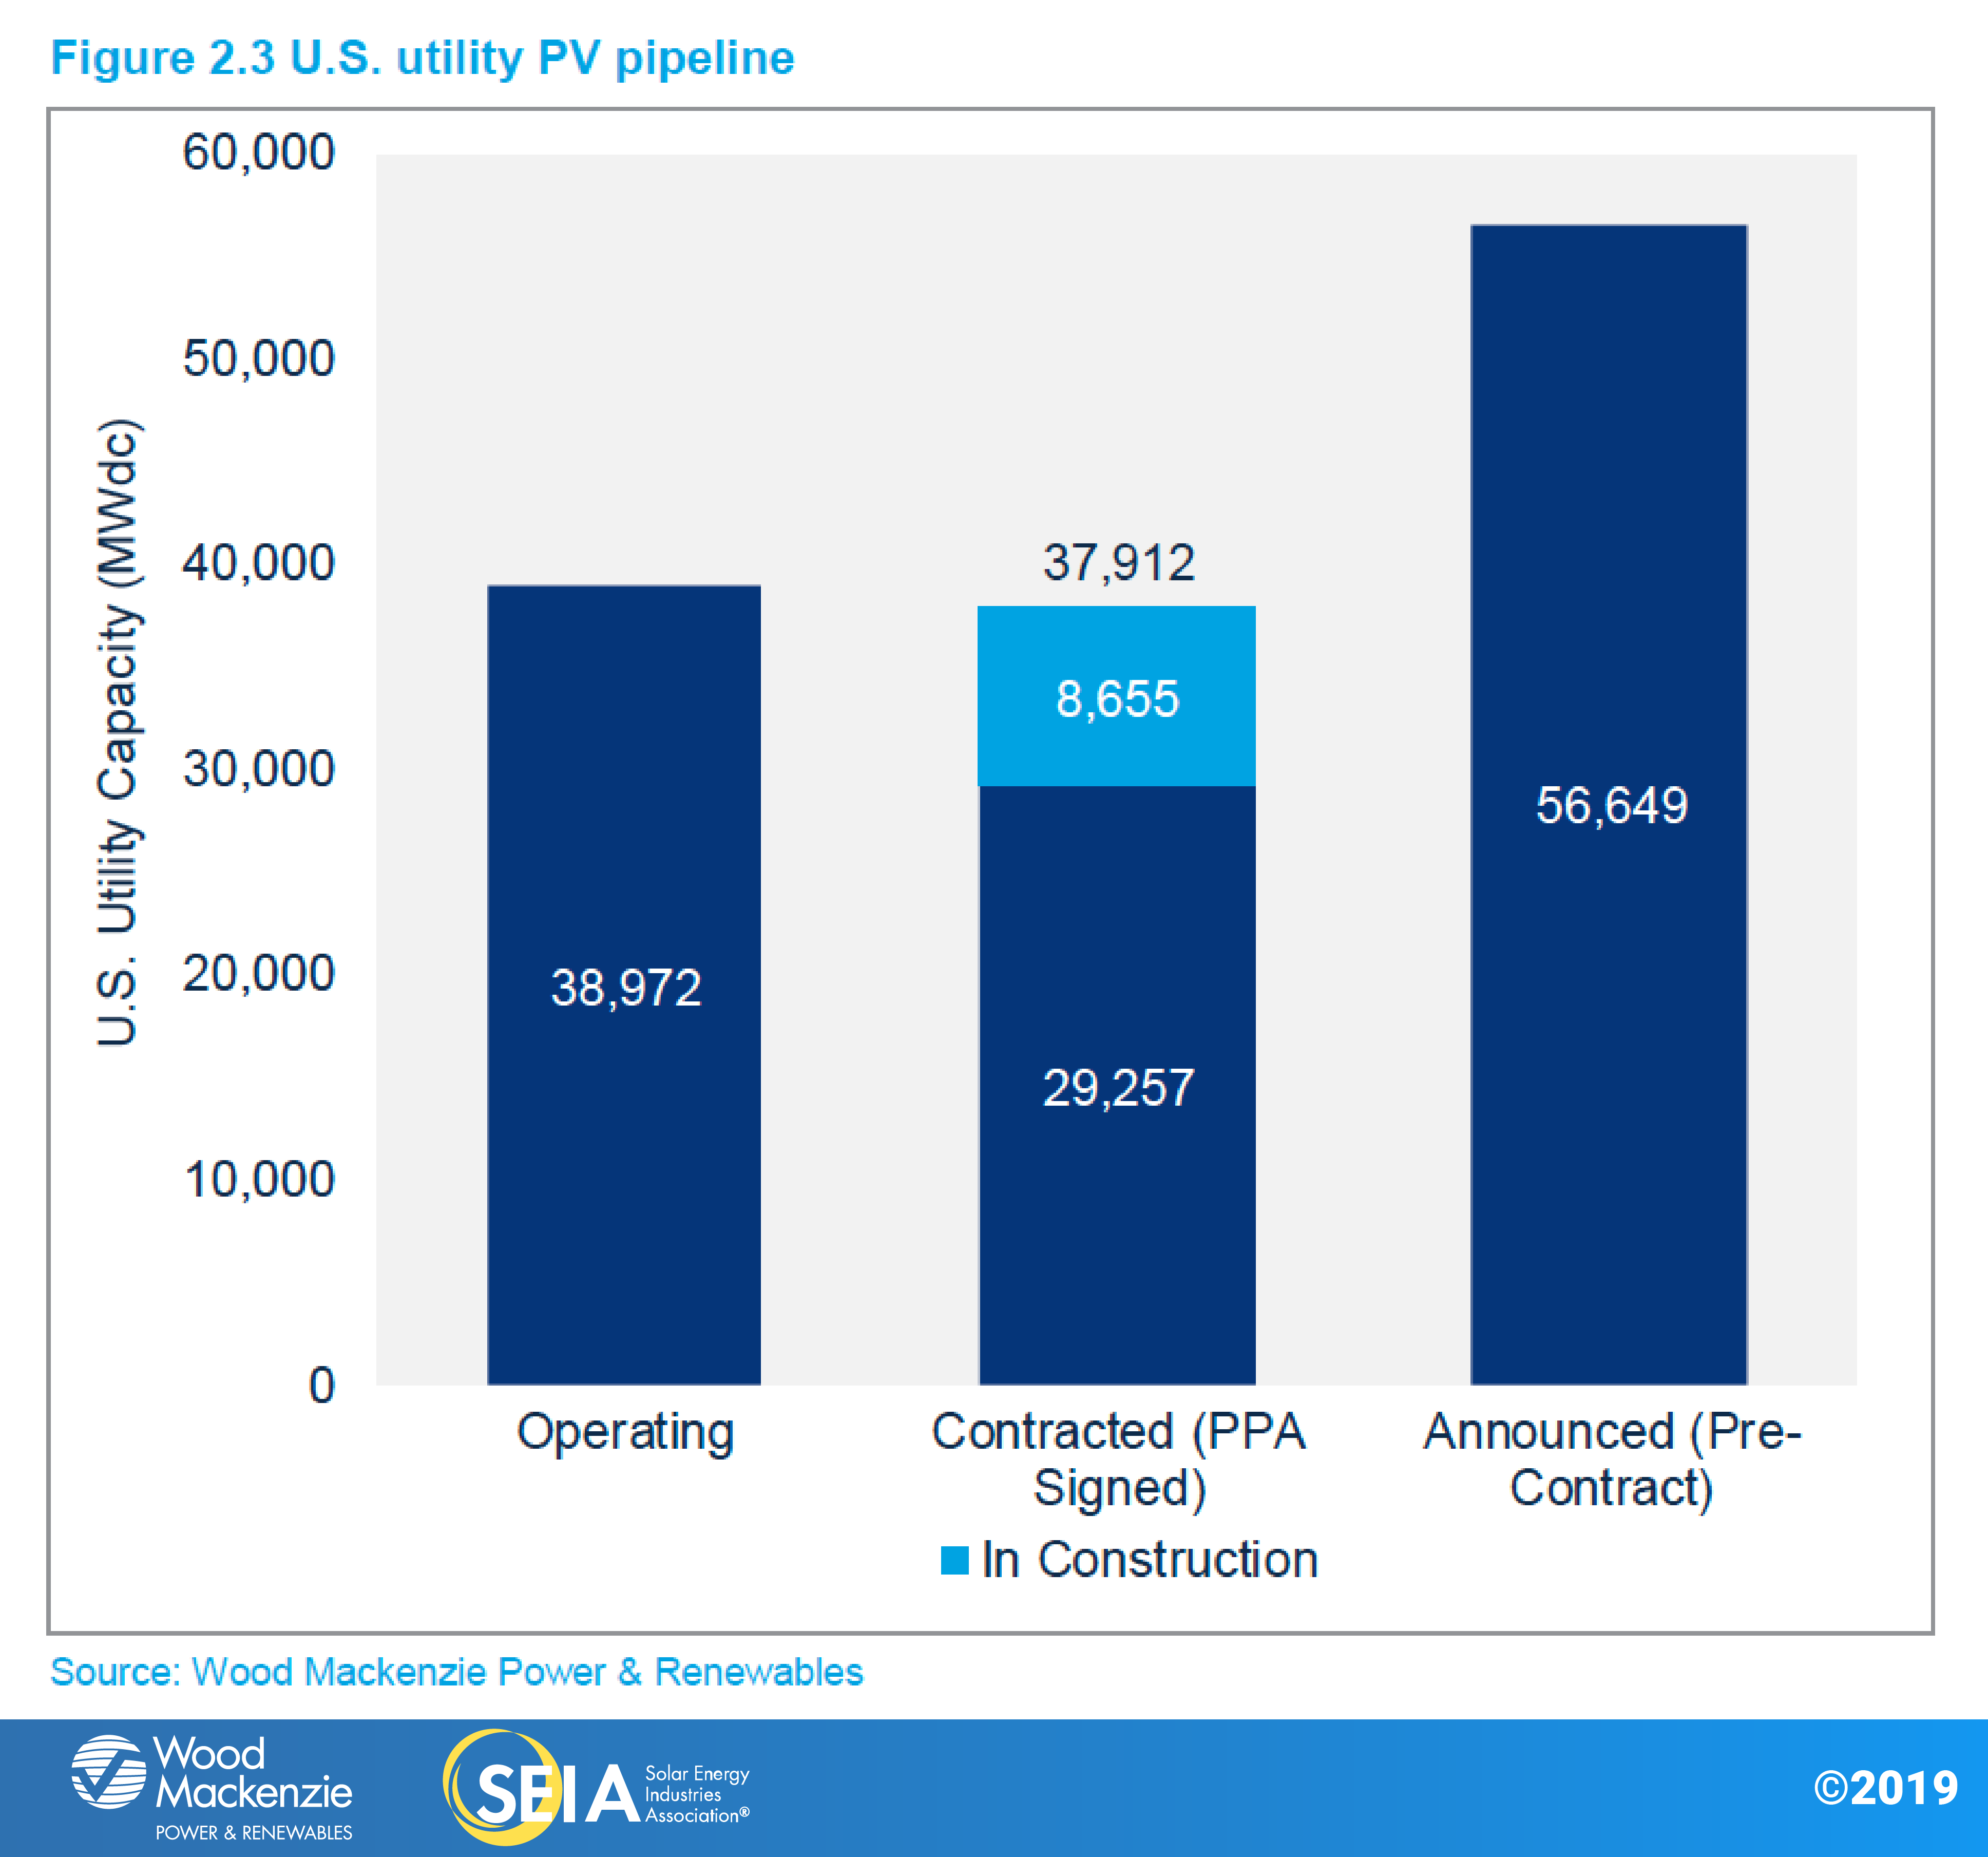
- U.S. utility PV has seen 11.2 GWdc of new projects announced in the first half of 2019, bringing the utility PV pipeline to a historic high of 37.9 GWdc.
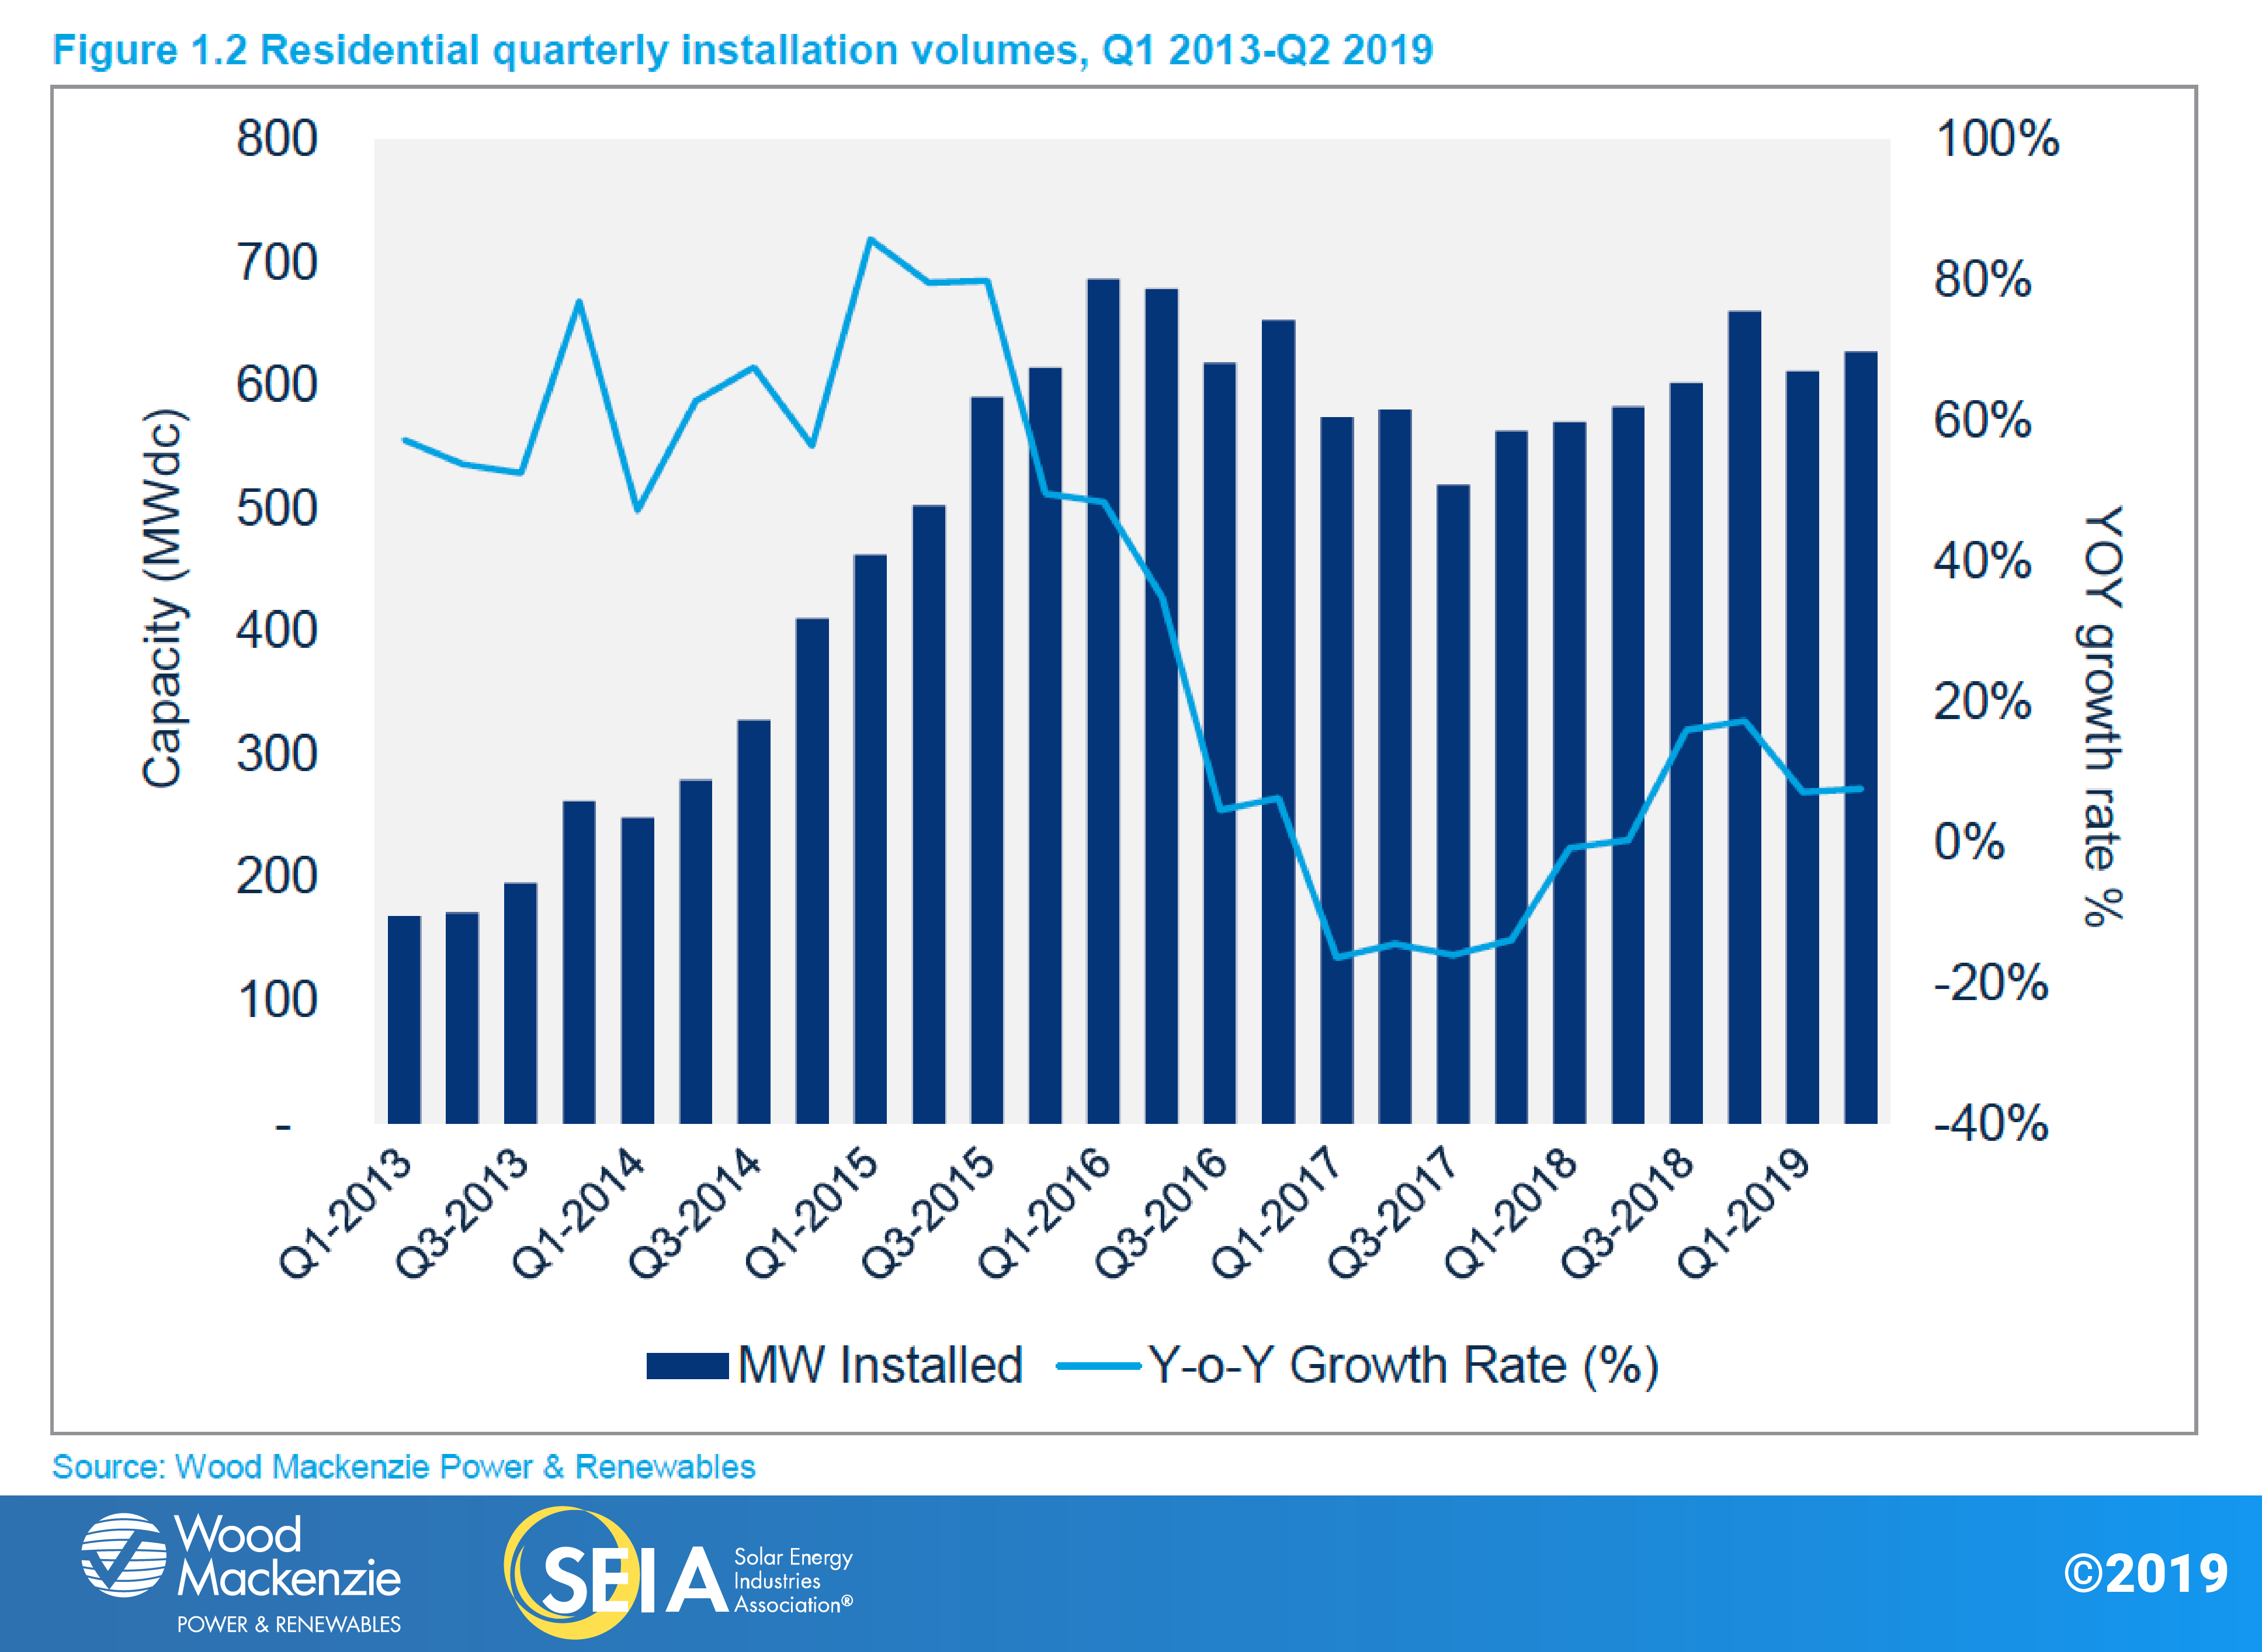
- Residential solar continues its rebound, growing 3% quarter-over-quarter and 8% year-over-year. Q2 2019 was the fourth consecutive quarter of more than 600 MWdc of installed residential capacity.
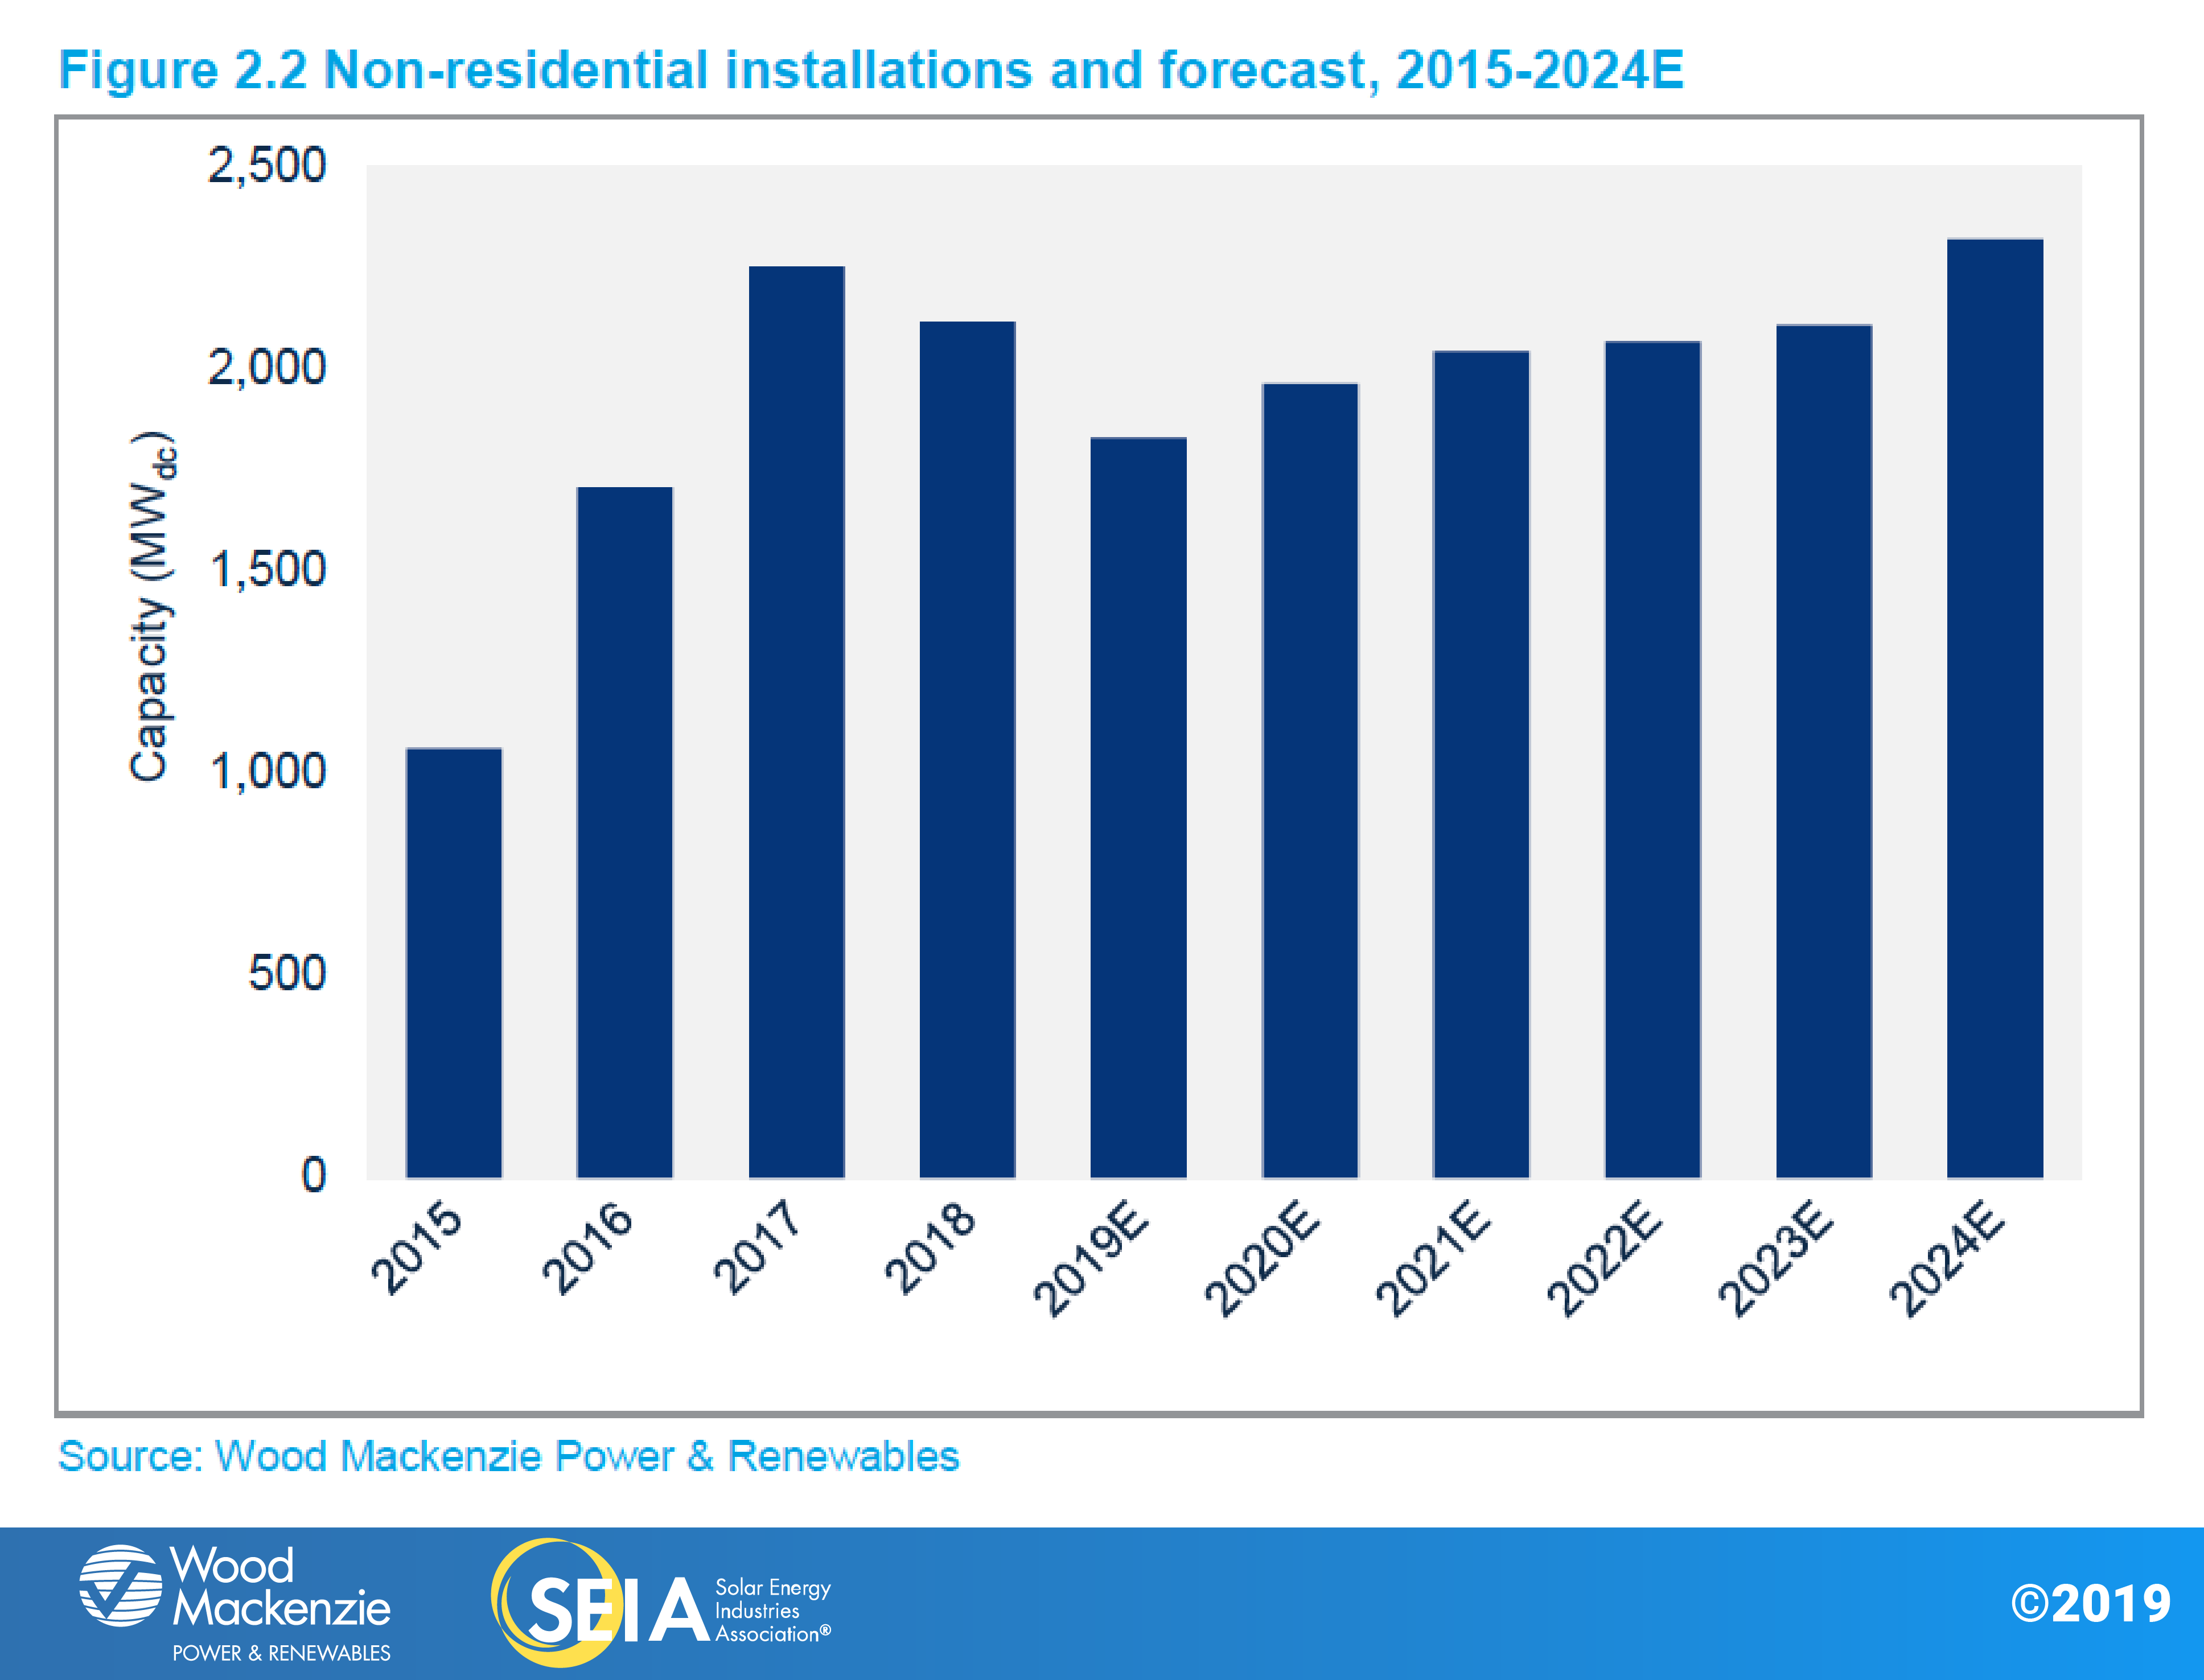
- Non-residential PV saw 426 MWdc installed – a decline from Q1 – as policy shifts in states including California, Massachusetts and Minnesota continue to impact growth.
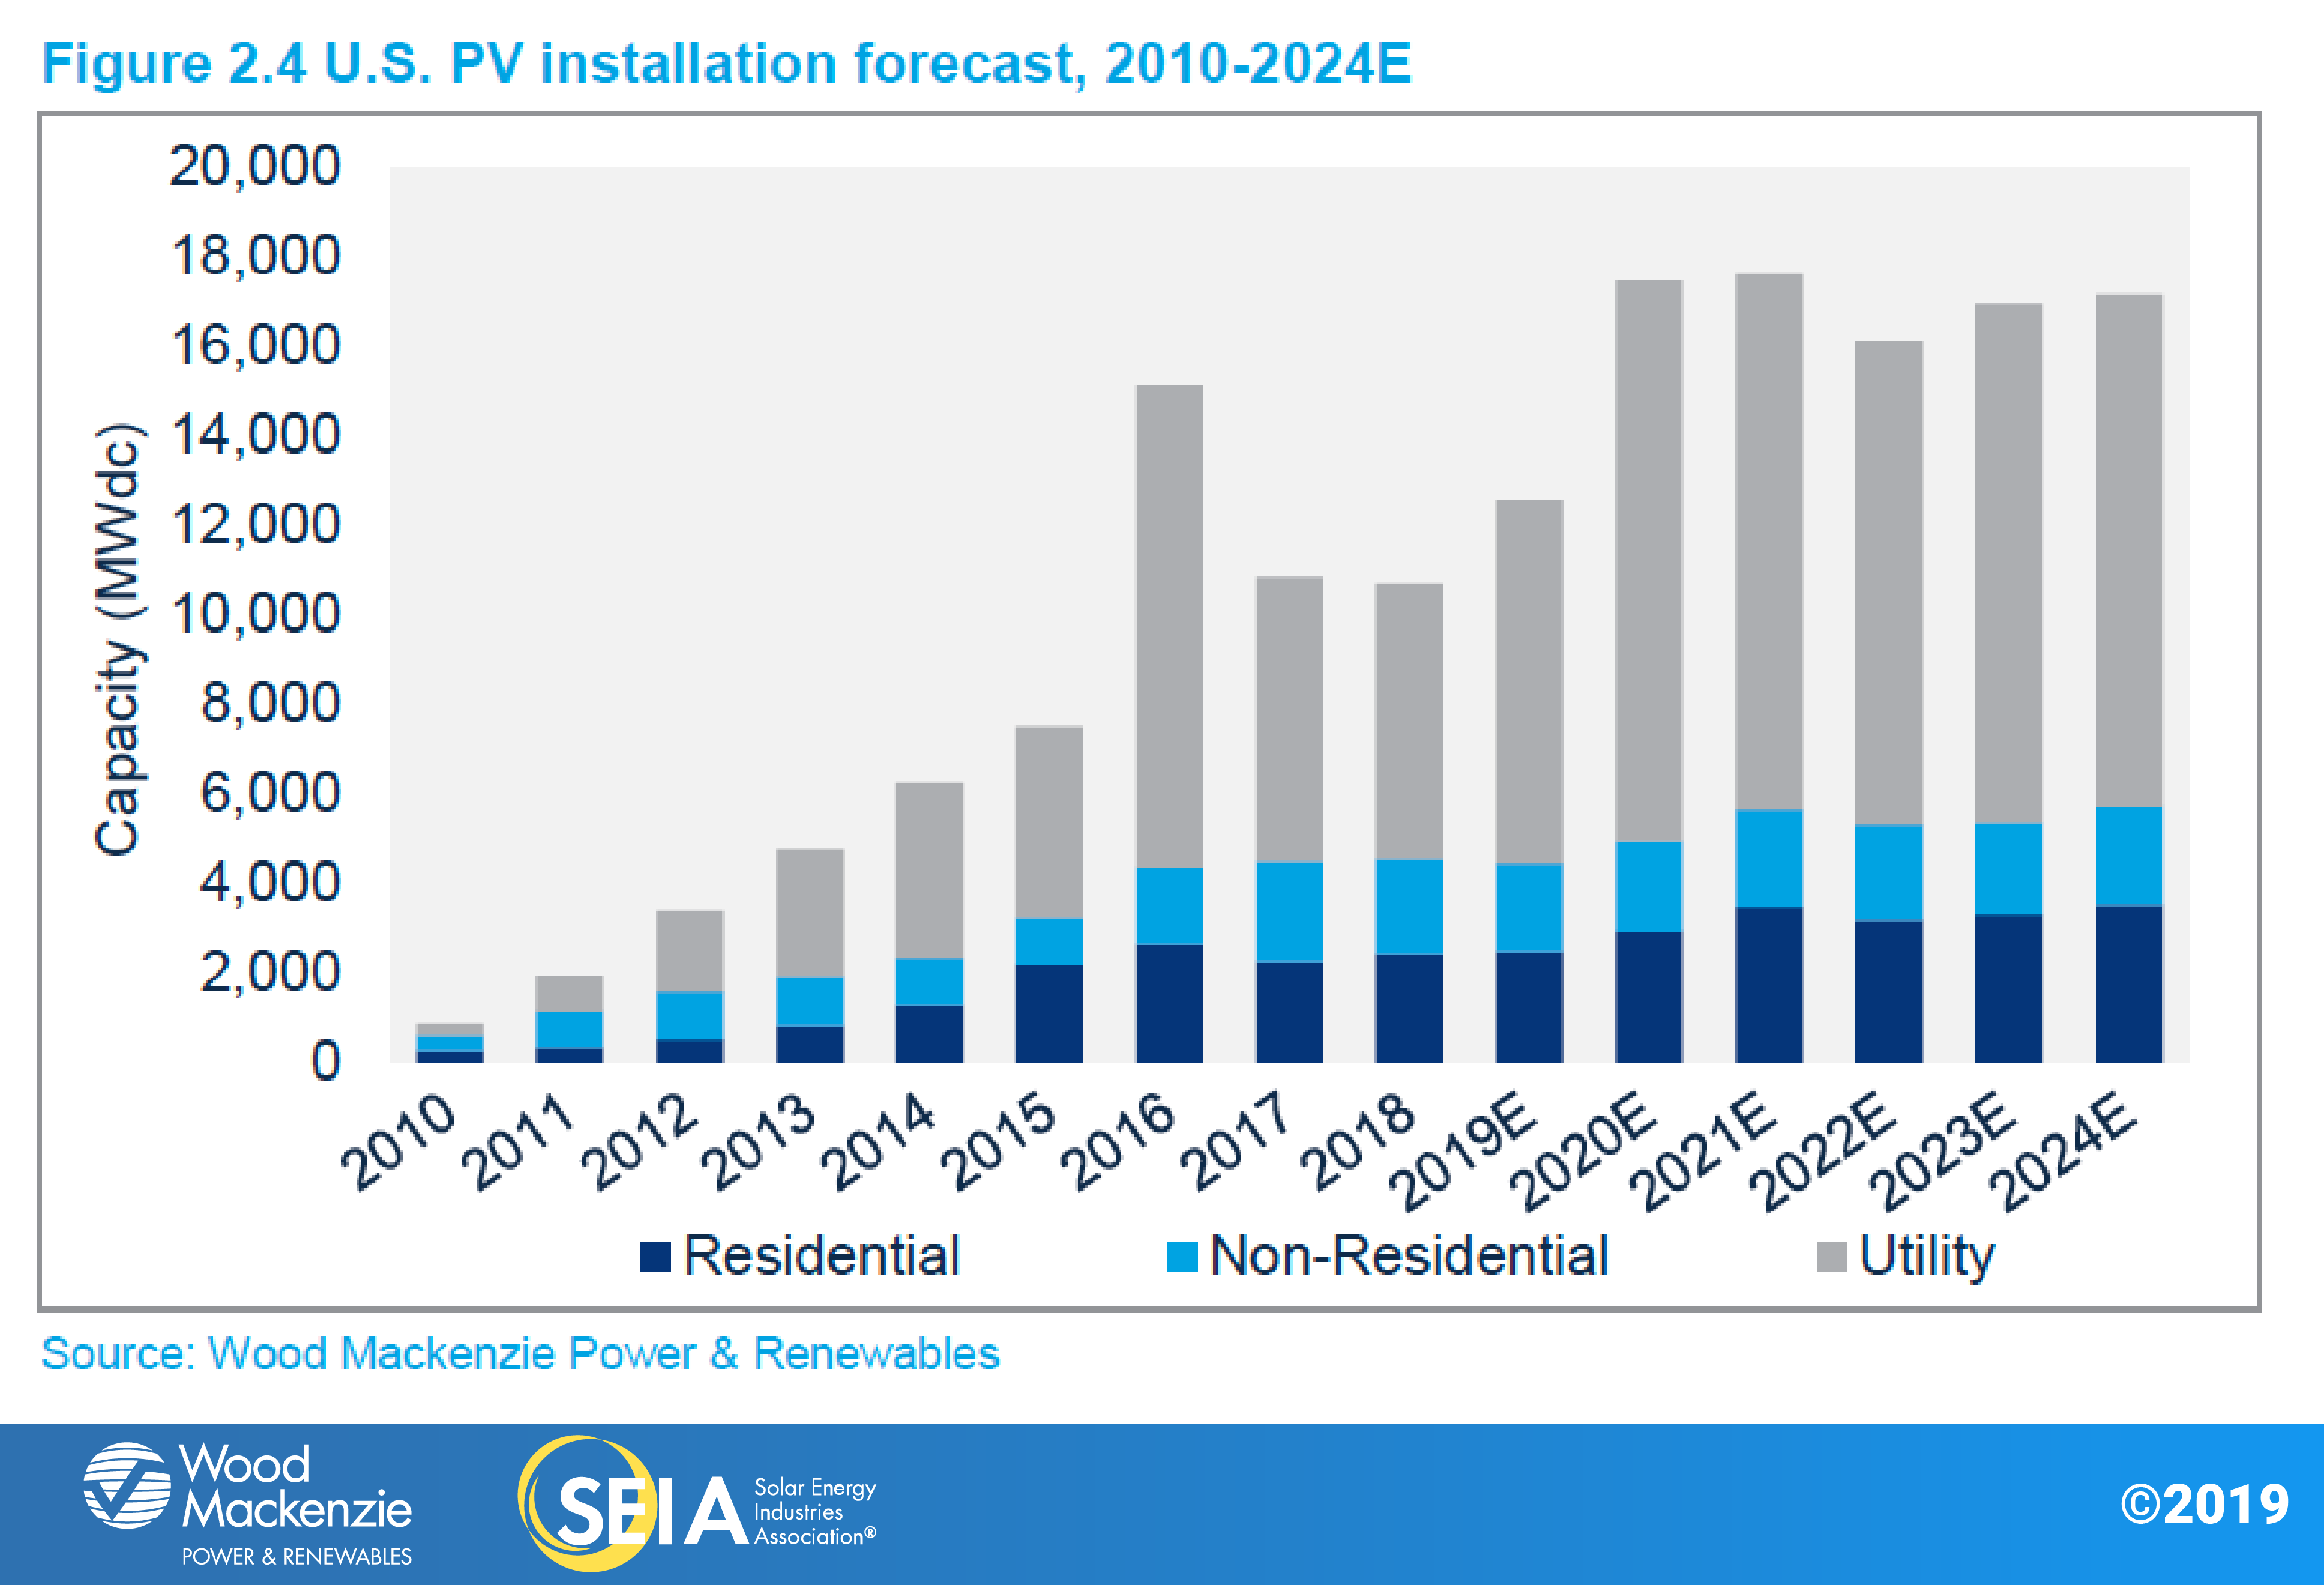
- Wood Mackenzie forecasts 17% year-over-year growth in 2019, with 12.6 GWdc of installations expected. In total, more than 6 GW were added to the five-year forecast since last quarter to account for new utility-scale procurement.
- Total installed U.S. PV capacity will more than double over the next five years, with annual installations reaching 17.6 GWdc in 2021 prior to the expiration of the federal Investment Tax Credit (ITC) for residential systems and a drop in the commercial tax credit to 10% for projects not yet under construction.
1. Introduction
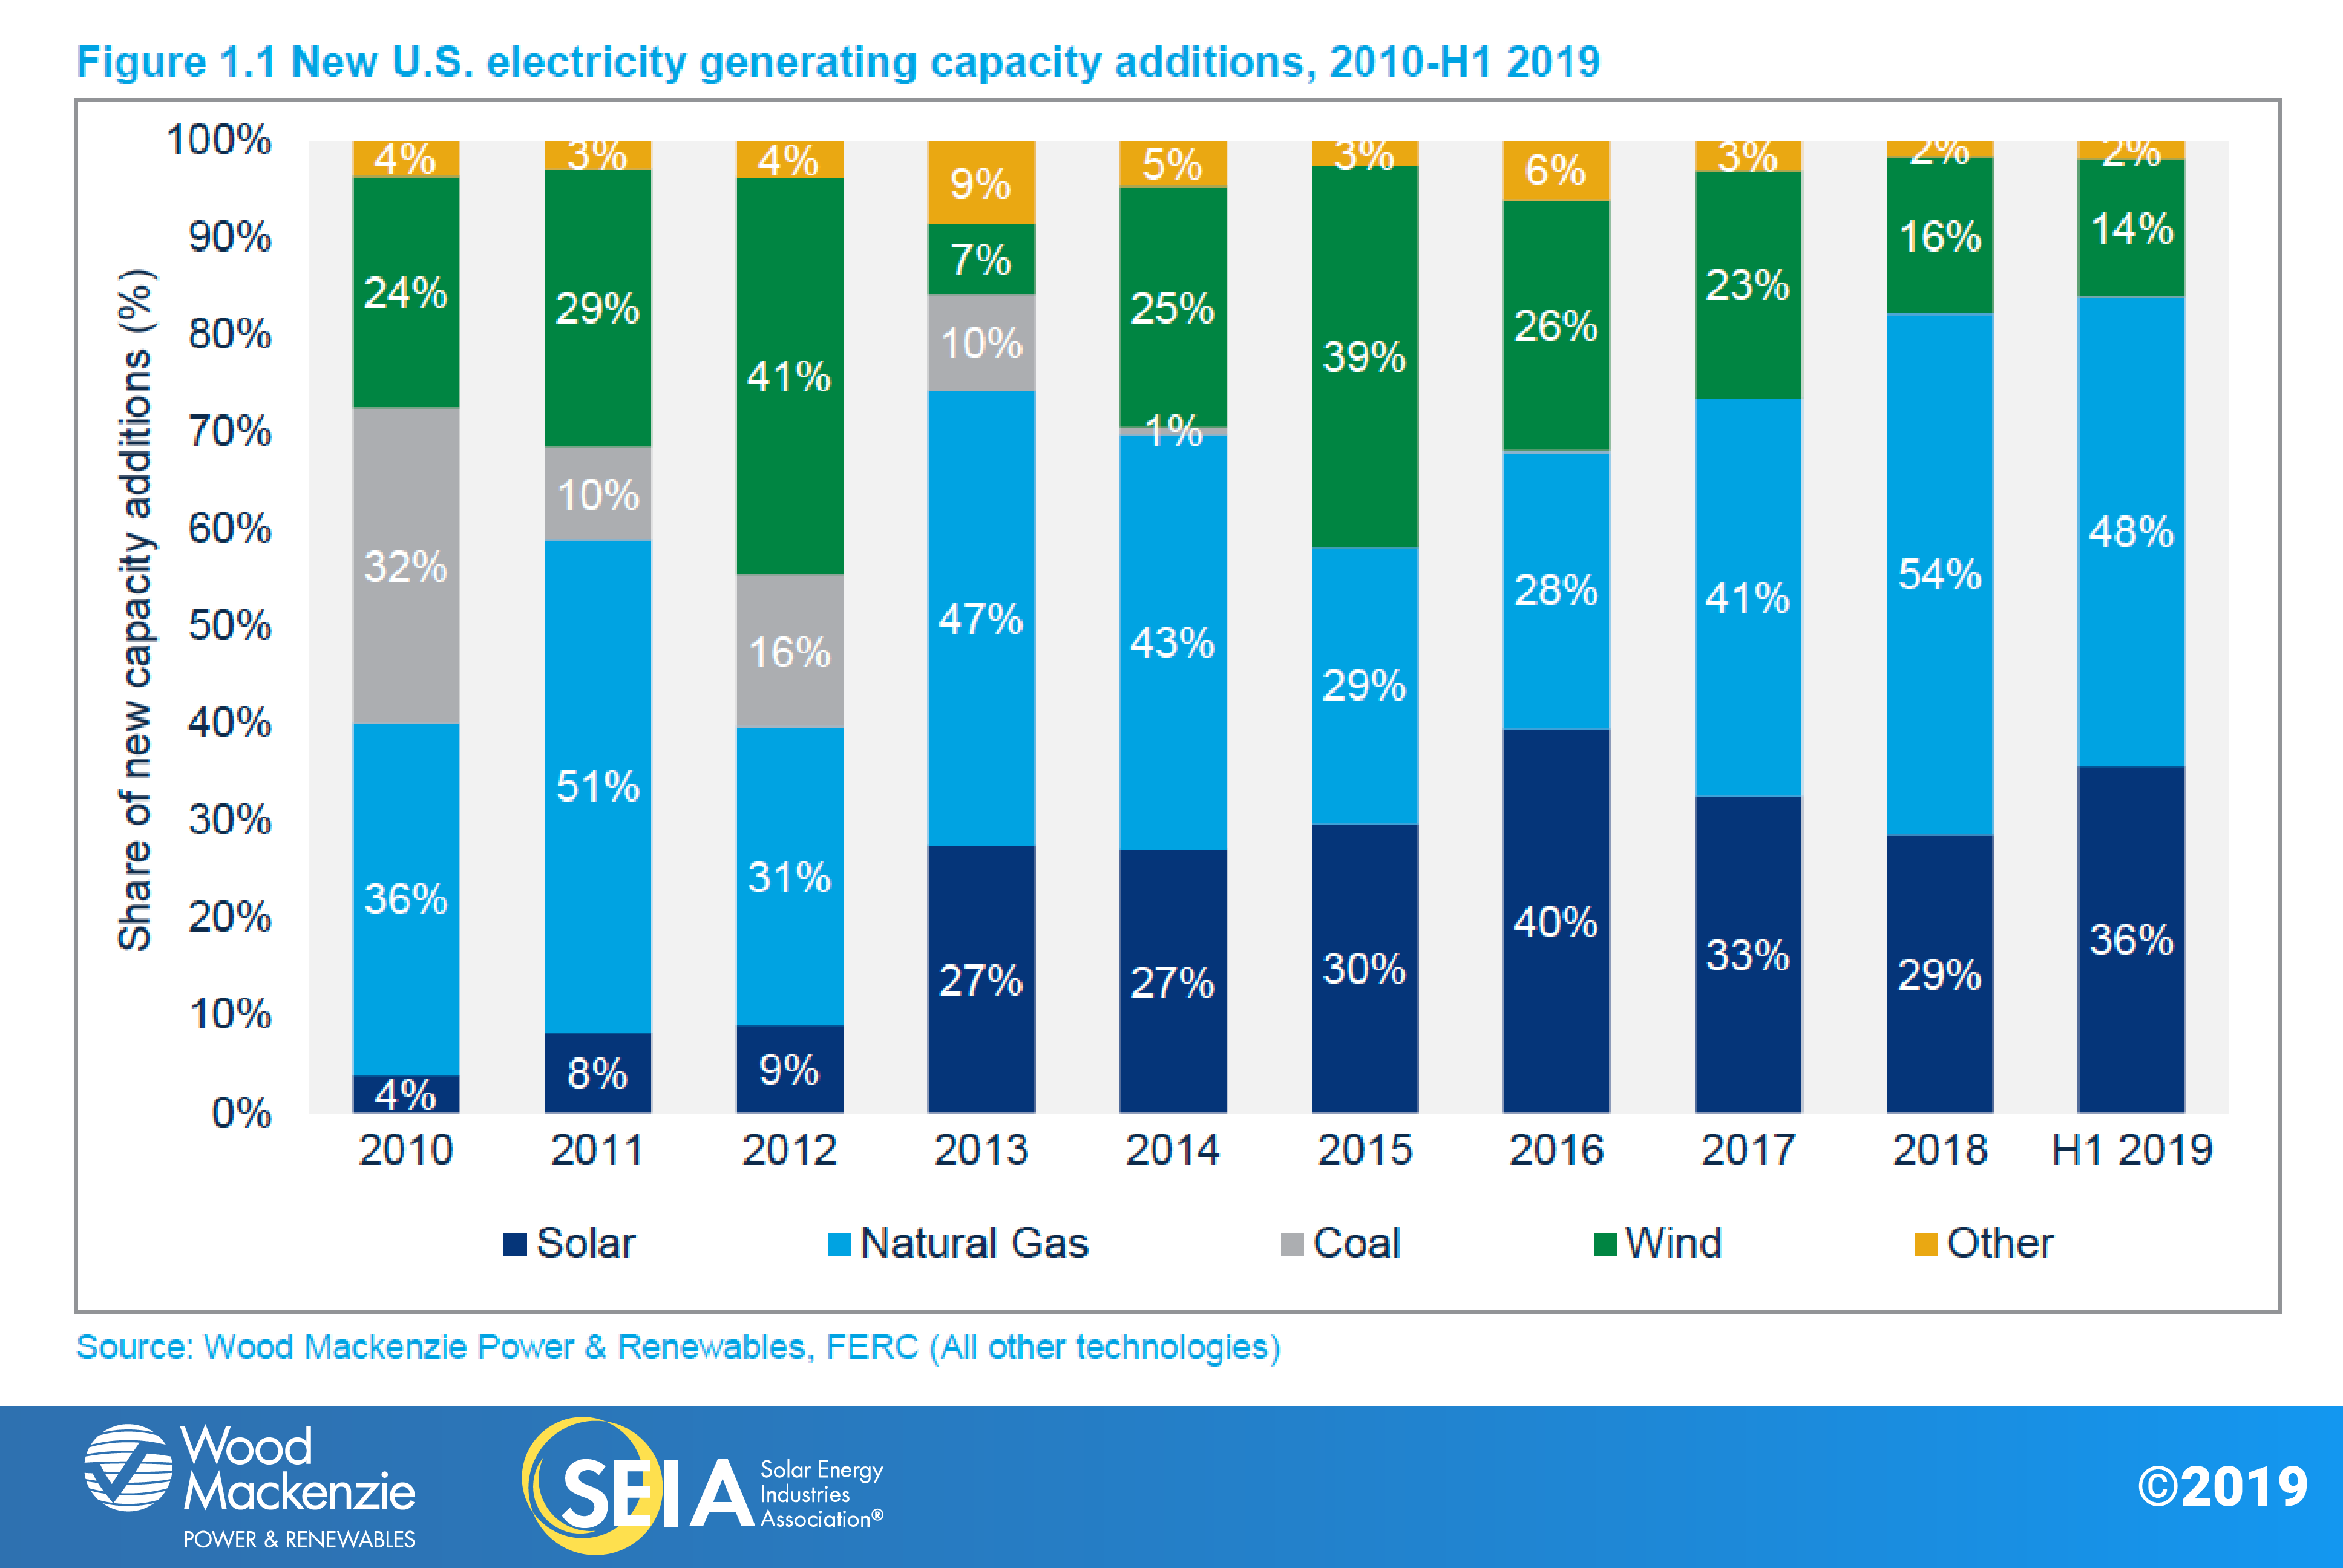
In Q2 2019, the U.S. solar market installed 2.1 gigawatts direct current (GWdc) of solar photovoltaic (PV) capacity, a 7% decrease year-over-year. After residential solar grew 8% in 2018, the sector has continued to stabilize in the first half of this year, with 8% year-over-year growth in Q2 following 7% year-over-year growth in Q1. Conversely, non-residential PV suffered both quarterly and annual declines due to policy transitions and persistent interconnection issues in key commercial markets. The quarter saw 1 GWdc of utility-scale installations – slightly lower than average – but with new project procurement growing the contracted pipeline to a record high of 37.9 GWdc. Across all market segments, solar PV accounted for 36% of all new electricity generating capacity additions in the first half of 2019.
Modest residential growth continues in Q2 2019
After growing 8 percent in 2018, the residential market continued apace over the first half of 2019, with installations trending 7% higher than in the same period last year. This level of growth suggests increased market maturity and a more sustainable growth profile. National installers hold a lower collective market share than in years past and are now operating alongside a mix of local and regional installers, resulting in increased competition. Mature markets continue to see modest to flat growth rates despite consistent volumes, owing to increased challenges in customer acquisition at higher penetration levels. The continued emergence of new markets has helped to sustain steady installation volumes on a national basis.
Non-residential PV enters a second consecutive year of annual decline
Unlike the residential market, a handful of state-specific regulatory cliffs and policy reforms that took effect in 2018 continued to impact non-residential installations in H1 2019. Major policy reforms continued to hamper development in the core non-residential markets of California, Massachusetts and Minnesota. In the case of California, installations were flat on both a year-over-year and quarter-over-quarter basis, which suggests that installation declines stemming from the transition to new time-of-use rates are abating. In Massachusetts, non-residential deployment numbers continue to be impacted by interconnection delays, despite a pipeline of projects sitting mechanically complete. This has resulted in market declines on both a year-over-year and quarter-over-quarter basis.
That being said, positive policy developments in New York, Maryland, Maine and New Jersey in H1 2019 will collectively allow the market to grow in the period 2020-2022 before it declines in 2023 in response to the step-down of the solar Investment Tax Credit under current federal law.
New utility procurement breaks records while 100% renewables targets and offsite corporate demand boost long-term outlook
Utility PV maintained the largest share of installed capacity in the U.S. solar market this quarter. A total of 1.1 GWdc of utility PV capacity came online in Q2 2019, representing 49% of quarterly capacity additions. With a record-high 8.7 GWdc of projects under construction, 2019 is on track to be a strong year for utility-scale installations. An additional 29 GW of contracted projects are scheduled to come online over the next several years. This pipeline positions 2020 to be the largest year on record for utility-scale installations, with 12.6 GWdc expected to come online.
After record-high procurement of 15 GWdc in 2018, procurement has surged to 11.2 GWdc in the first half of 2019, with 6.2 GWdc in Q2 alone. The contracted pipeline has ballooned to 37.9 GWdc, the highest it has ever been in the history of U.S. utility solar. Several utilities, including Duke Energy, NV Energy, Clean Power Alliance and East Bay Community Energy, have announced large solar procurements, and announcements from corporate offtakers such as Starbucks, Microsoft and Anheuser-Busch have also increased.
With the increased demand from corporate offtakers, offsite corporate procurement now ranks as the main driver of 17% of all new projects announced in 2019. As more companies commit to 100% renewable power, offsite corporate procurement is expected to drive more than 20% of new capacity additions from 2019 through 2024. The procurement needed to fulfill the many renewable-energy and zero-carbon commitments recently made by cities, states and utilities is just starting to occur, with significant additional procurement driven by renewable portfolio standards expected in the near to medium term. However, voluntary procurement of utility PV based on its economic competitiveness continues to be the primary driver of projects announced in 2019, accounting for 55% of total announcements. This procurement has been driven by the low cost of utility PV, with recently signed PPA prices ranging from $18 to $35/MWh.
2. Market Segment Outlooks
2.1. Residential PV
Key Figures
- 628 MWdc installed in Q2 2019
- Up 8% from Q2 2018
- Up 3% from Q1 2019
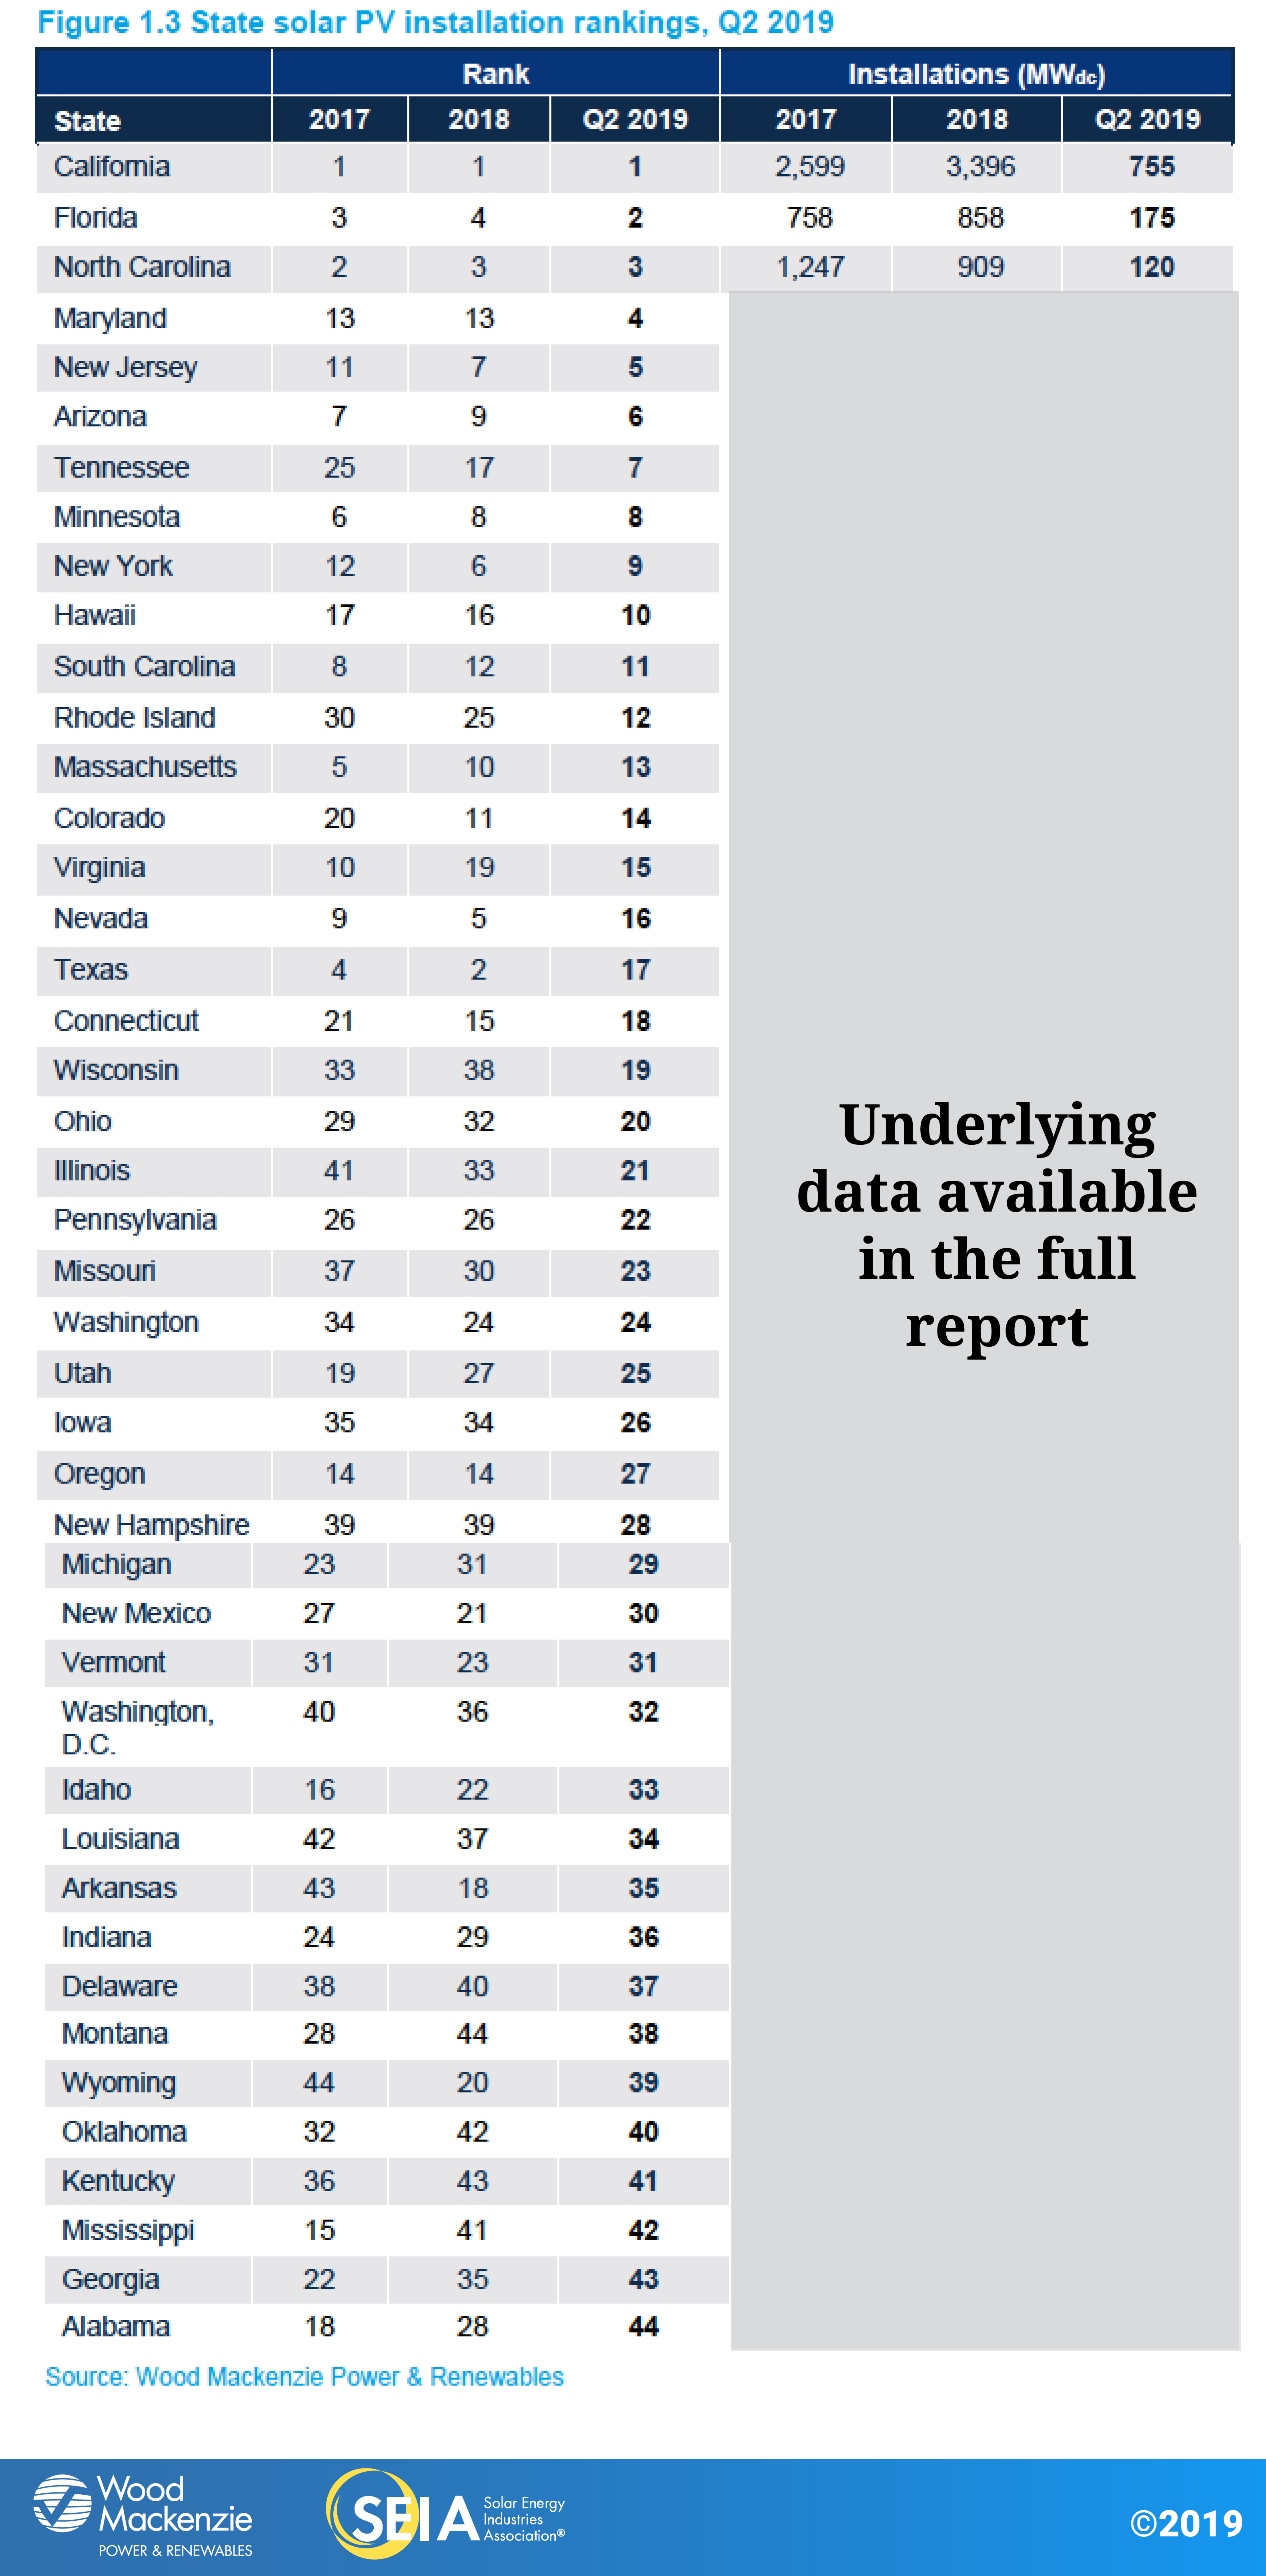
Modest growth in the residential segment over the past several quarters has been led by emerging state markets. In Q2 2019, one-fourth of all residential installations came from state markets outside the top 10, representing the highest total in industry history. These emerging markets are helping to offset low to flat growth in many legacy state markets, which up until recently were the major drivers of residential segment growth. As these states continue to grow past early-adopter consumers, higher costs of customer acquisition will challenge the industry to innovate product offerings and continue to diversify geographically.
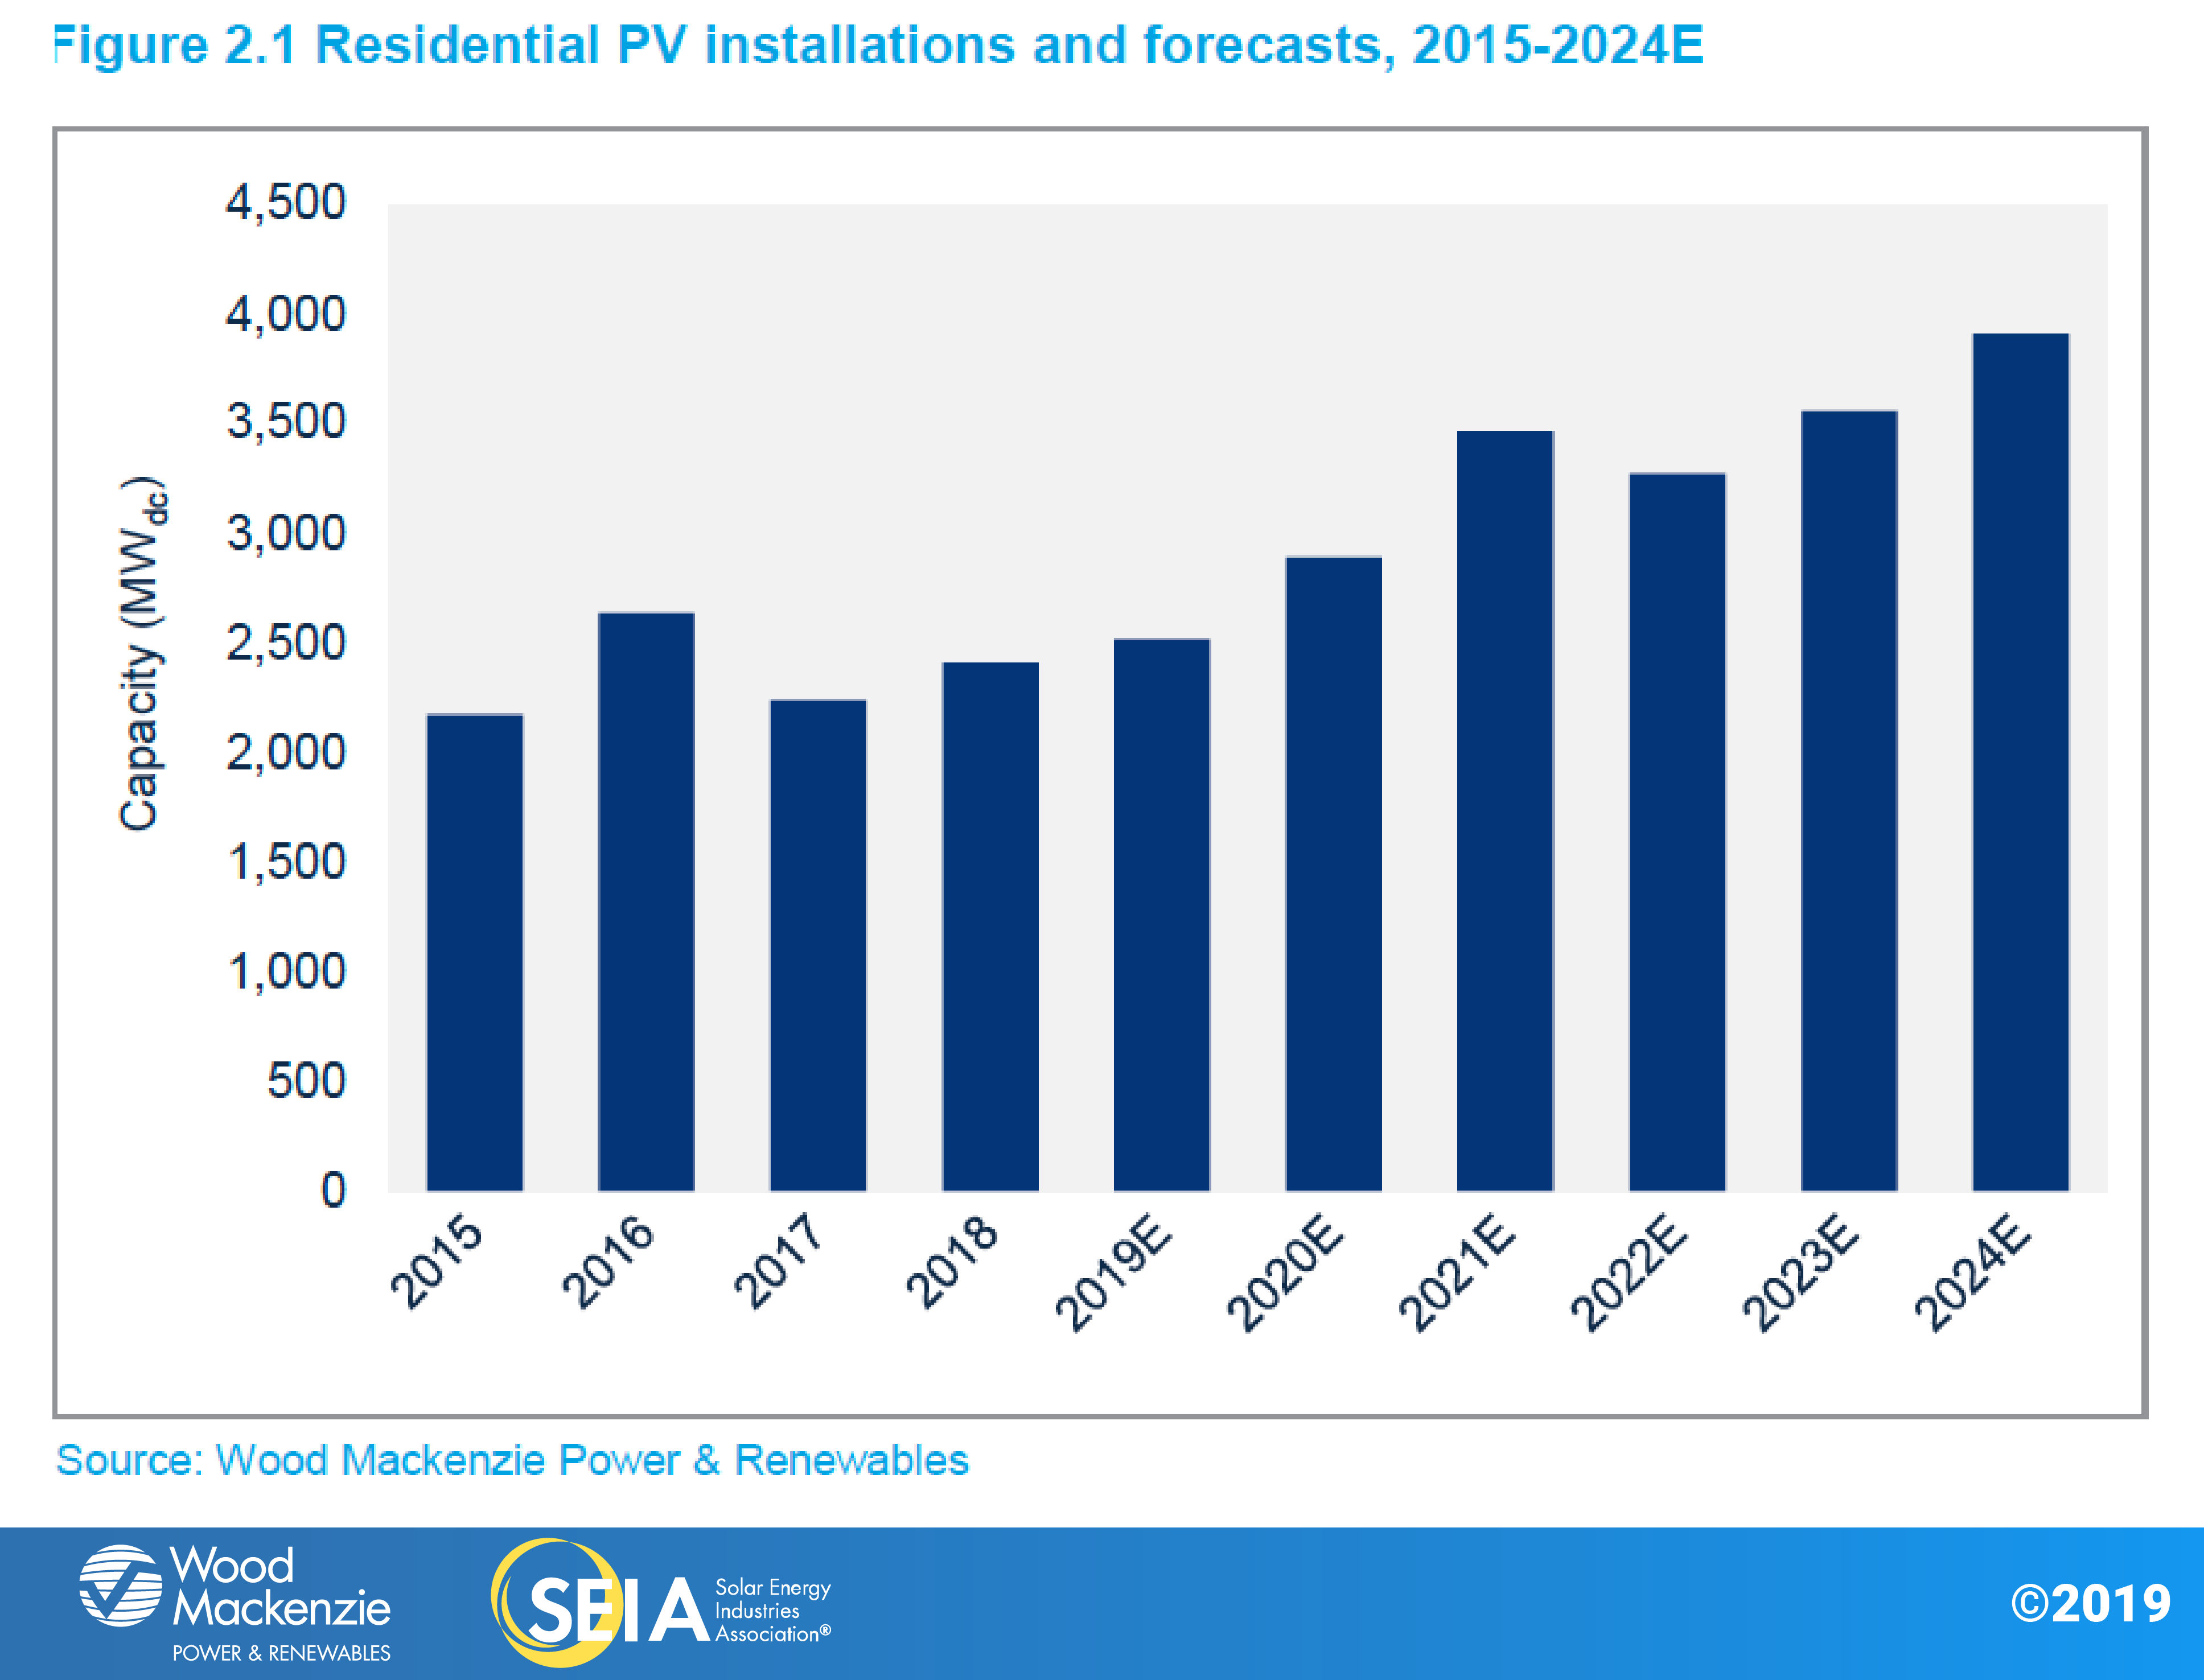
From 2019-2021, residential growth will range from 2% to 19% due to both emerging markets with strong resource fundamentals like Florida and Texas, and markets where recent policy developments have increased our near-term forecasts. Maryland’s recent renewable portfolio standard (RPS) increase, the removal of South Carolina’s net metering cap, and new incentive programs such as Illinois’ Adjustable Block Program will provide significant upside and growth to our residential forecasts over the next few years. Meanwhile, California’s new home solar mandate will also help to offset market penetration challenges beginning in 2020.
In the long term, the ITC step-down is expected to pull in demand in both legacy and emerging markets before expiring in 2022 for customer-owned systems. Modest growth resumes in 2023 and continues into 2024 based on economic fundamentals as the market adjusts to less attractive post-ITC market conditions. That said, long-term growth in a post-ITC world will be contingent on geographic diversification outside of legacy state markets, as well as technological and business-model innovation to improve product offerings in the solar-plus-storage space.
2.2. Non-residential PV
Key Figures
- 426 MWdc installed in Q2 2019
- Down 2% from Q1 2019
- Down 16% from Q2 2018
Non-residential installation totals in Q2 2019 were the weakest since Q3 2016. California and Massachusetts continue to see declining volumes due to state-level policy reforms and interconnection delays that limit development opportunities. Overall, the non-residential PV market is on track for another down year as the segment acclimates to a reduced incentive environment across major state markets. However, this will be incrementally offset starting in 2020 as the next wave of states with robust community solar mandates – New York, Maryland, Illinois and New Jersey – experience growth.
Recent policy developments in the Northeast will ultimately spur growth in our long-term outlook. Significant revisions to the Value of Distributed Energy Resources (VDER) docket in New York have bolstered our long-term forecasts for both commercial and community solar. Meanwhile, Maryland and Maine have both passed more aggressive RPS policies, which are expected to boost lagging REC markets. Maine went even further to create a commercial solar tariff and community solar program.
Increasing solar-plus-storage viability will also begin to have an impact on non-residential demand as policymakers and business leaders increasingly consider energy storage in their decisions. New York’s recent development of the Bridge Incentive increases our long-term solar-plus-storage forecasts with further potential upside. By 2023, roughly 30% of total non-residential PV capacity will come from community solar, and 20% of all non-residential capacity is expected to have storage attached.
2.3. Utility PV
Key Figures
- 1,023 MWdc installed in Q2 2019
- Utility PV pipeline currently totals 37.9 GWdc
The U.S. utility solar forecast for 2019-2024 has grown by 6.7 GWdc since last quarter thanks to unprecedented levels of procurement. New project announcements are exceeding projects completed as developers and utilities are working to safe-harbor as much capacity as possible before the ITC steps down. We have also seen more utility solar in long-term resource plans and requests for proposals from utilities such as Tennessee Valley Authority, Appalachian Power, Dominion Energy and Hawaiian Electric.
Since last quarter, the 2019 forecast has decreased slightly to 8.1 GWdc. This decrease is due to a handful of large projects that have pushed out target commercial operation dates (CODs) to 2020. But following this year, the forecasts for 2020 and 2021 have been increased by 2.5 and 1.0 GWdc, respectively. While project spillover from 2019 has bolstered the 2020 forecast, the biggest cause of the forecast increase has been new project announcements. There was 6.2 GWdc of new projects announced in Q2 2019, including 2.8 GWdc specifically targeting 2020 COD and 2.3 GWdc targeting 2021 COD.
From 2022-2024, our utility PV forecast has increased by 4.0 GWdc. While a portion of this can be attributed to 2.0 GWdc of newly procured projects with 2022-2024 target CODs, we expect that utility demand for solar will continue to increase. The cost-competitiveness of utility PV has made it the primary resource for utilities seeking additional energy capacity, as well as those looking to meet more stringent RPS targets. This is in part due to utility PV becoming increasingly cost-competitive with wind. As the wind-focused federal Production Tax Credit steps down, solar begins to fall below the cost of wind on a levelized cost of energy basis in many traditional wind states. In states such as Illinois, Iowa, Kansas, Michigan and the Dakotas, solar competes with wind on a cost basis by the mid-2020s, while also providing a complementary production profile.
The low cost of utility PV has also increased demand from corporate offtakers – in the first half of 2019, 2.4 GW of utility-scale solar projects with corporate offtakers were announced. Currently, 3.7 GWdc of the projects expected to come online in 2020 have a corporate offtaker, representing 28% of the 2020 forecast. While a short-term increase in demand could be inflated by corporate offtakers securing low-priced power-purchase agreements before the ITC steps down, we believe offsite corporate demand will continue to grow across the U.S. as more corporate and industrial offtakers pledge to become carbon-neutral or powered by 100% renewables. Consequently, Wood Mackenzie expects that corporate demand will drive over 20% of utility solar development from 2019-2024.
3. National PV System Pricing
We employ a bottom-up modeling methodology to track and report national average PV system pricing for the major market segments. This methodology is based on tracked wholesale pricing of major solar components and data collected from interviews with major installers.
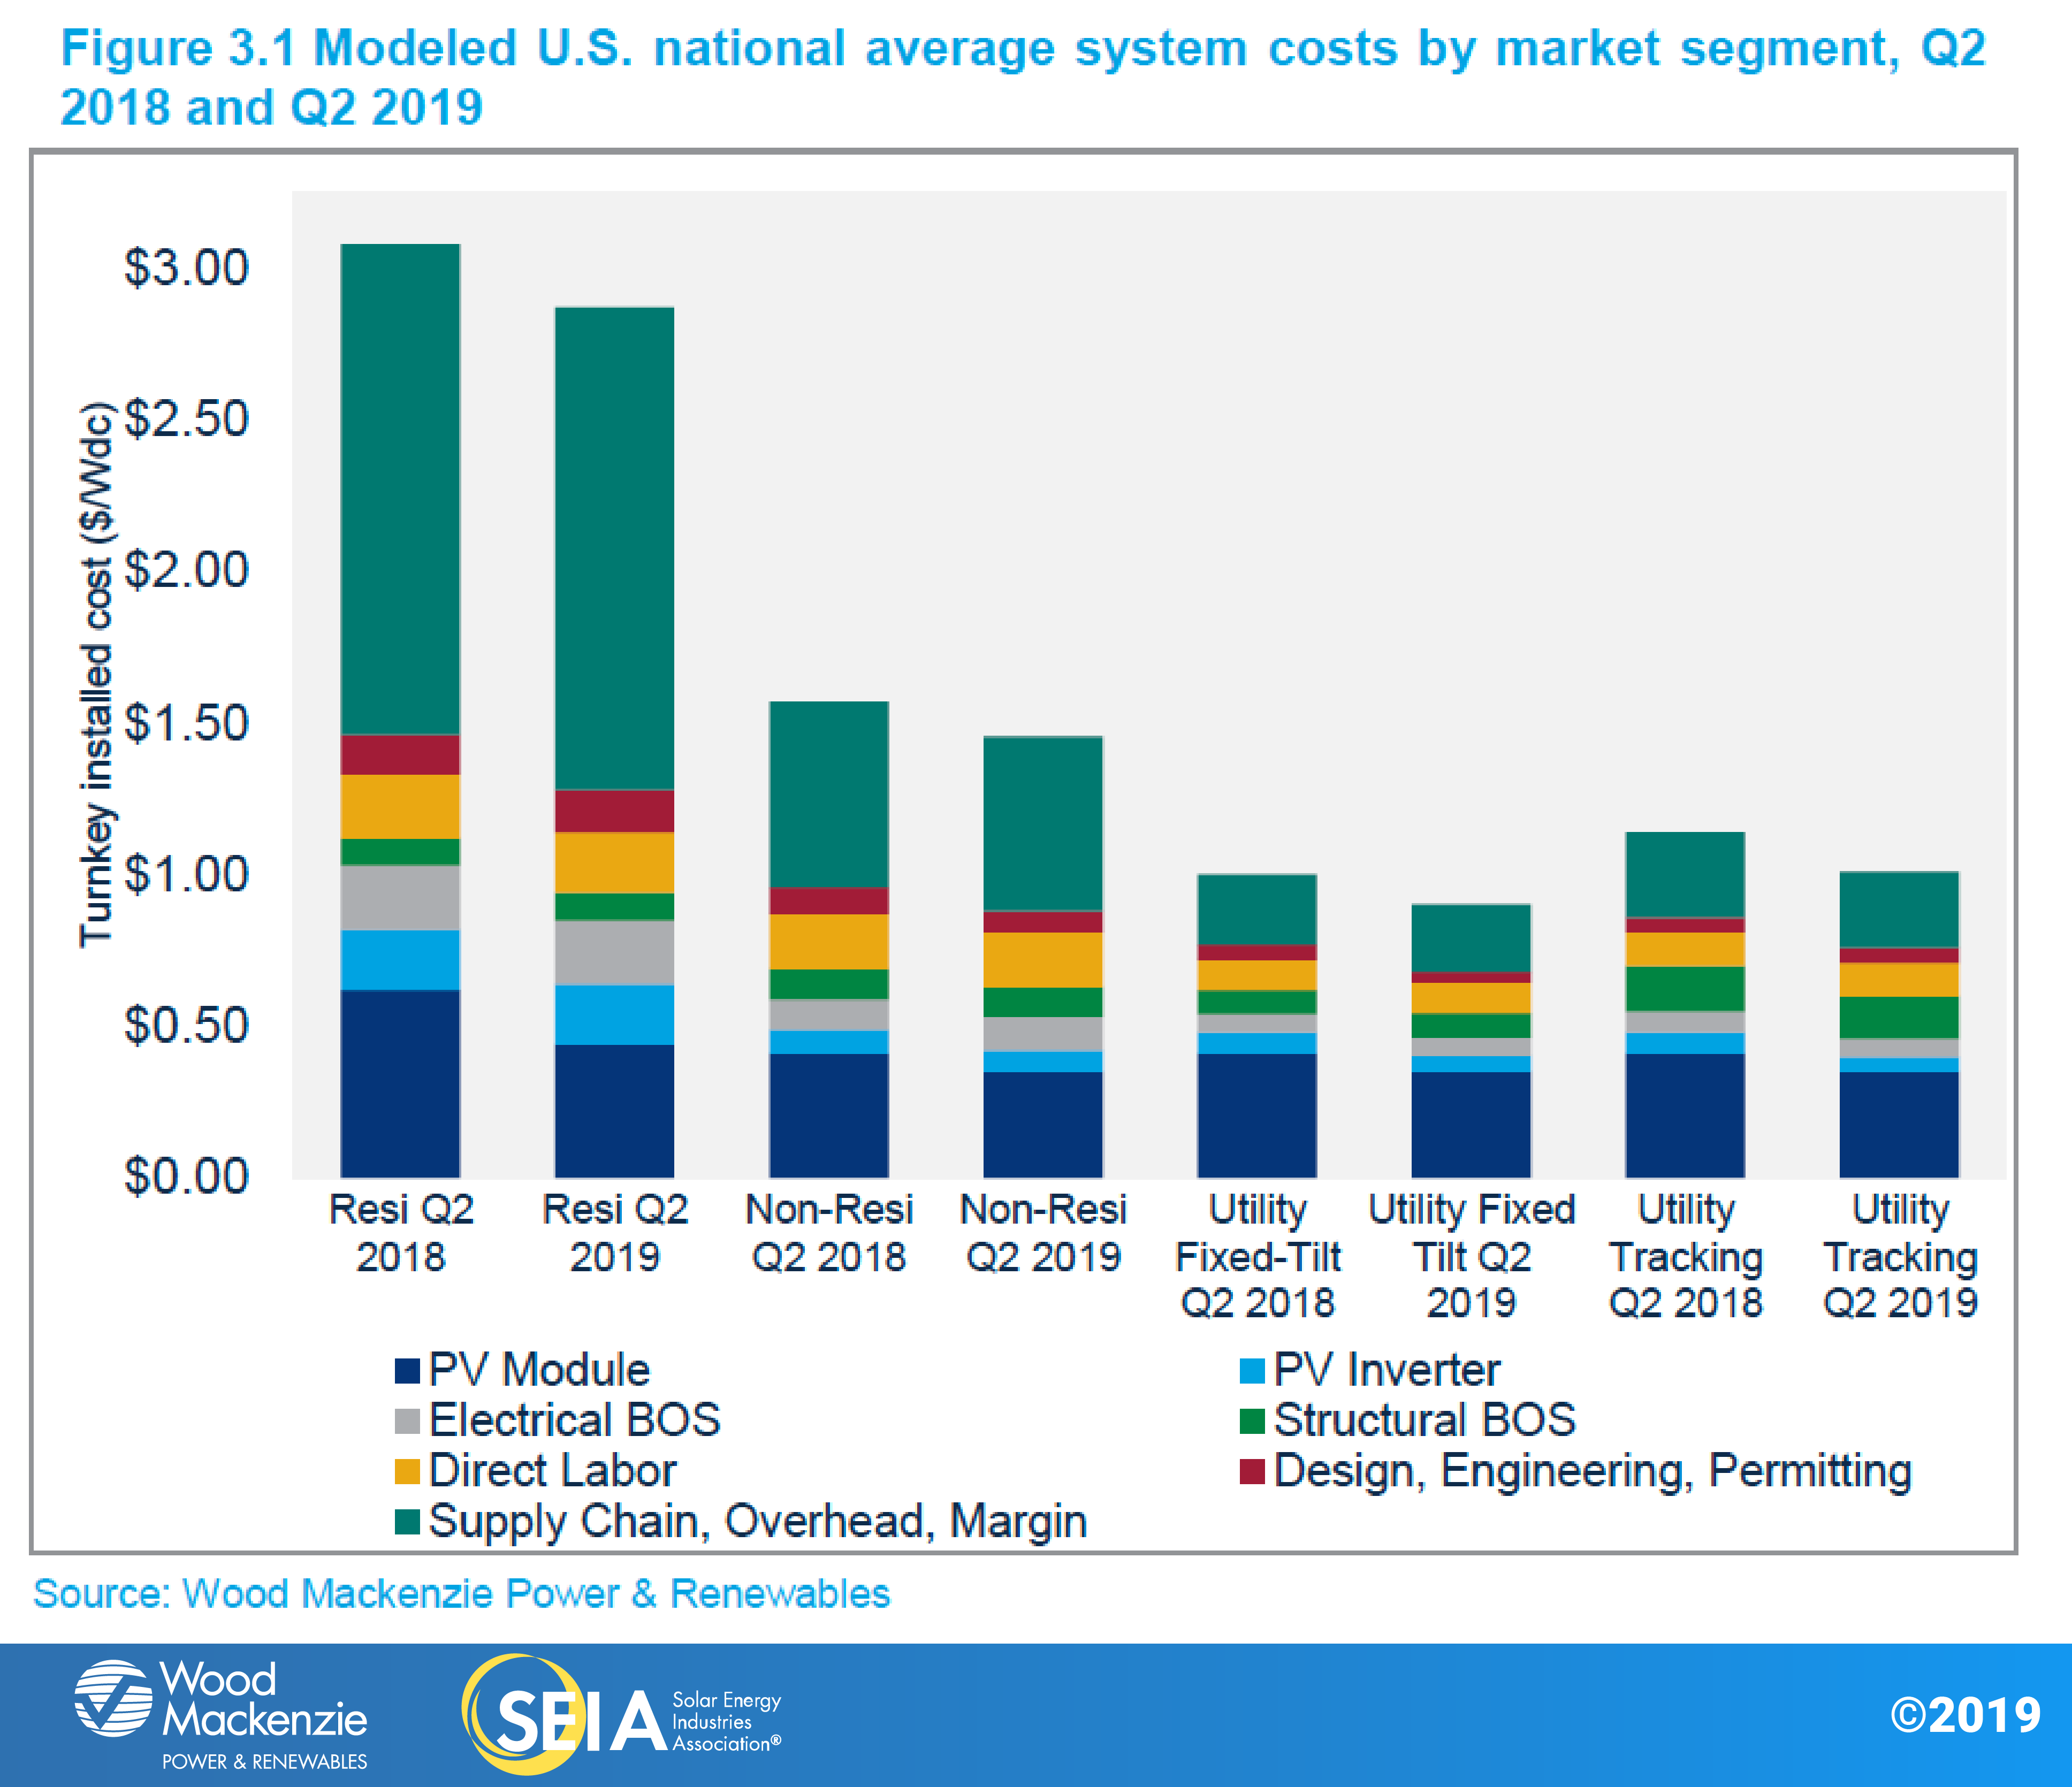
In Q2 2019, system pricing fell across all market segments. System pricing fell quarter-over-quarter by 0.7%, 1.1%, 2.8% and 2.5% in the residential, non-residential, utility fixed-tilt and utility single-axis tracking markets, respectively. Prices across all market segments are now at an all-time low: $2.87/Wdc, $1.45/Wdc, $0.90/Wdc and $1.01/Wdc for residential, non-residential, utility fixed-tilt and utility single-axis tracking systems, respectively. Year-over-year system pricing fell by 6.8%, 7.4%, 10.0% and 11.4% in the residential, non-residential, utility fixed-tilt and utility single-axis tracking markets, respectively.
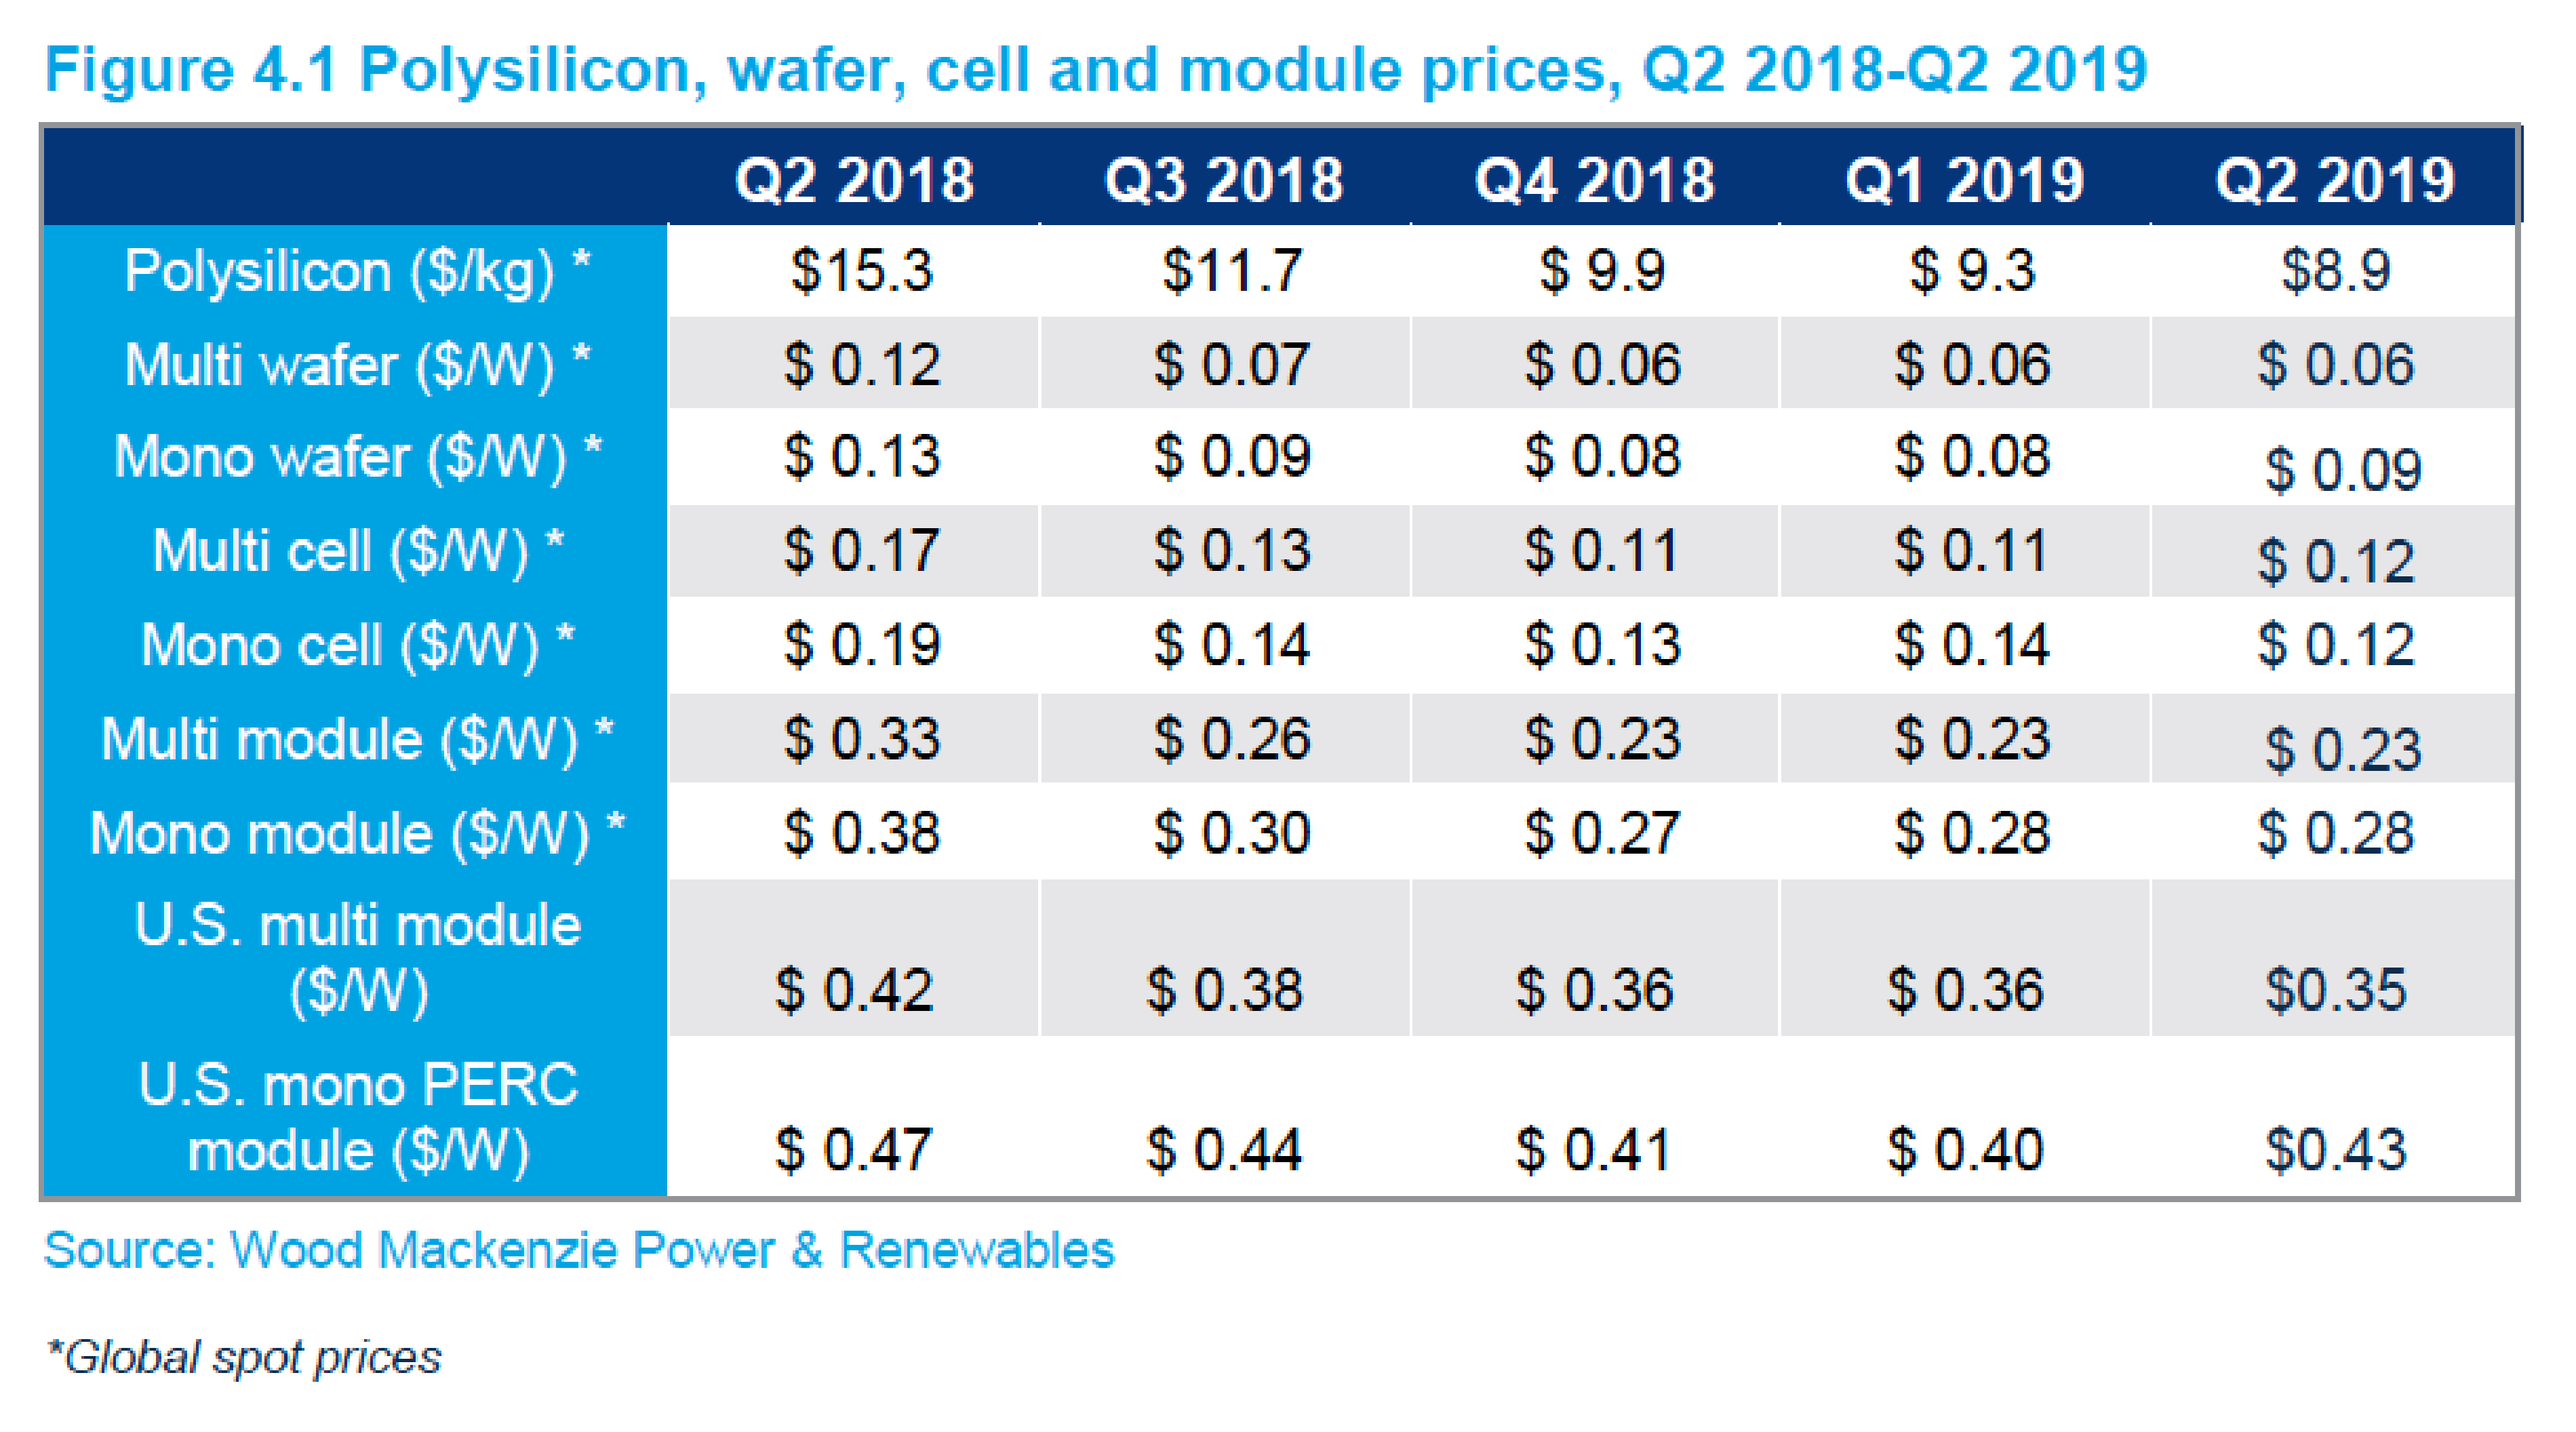
4. Component Pricing
Starting in Q1 2019, the U.S. solar market insight report series expanded its coverage to include pricing information on mono wafers, mono cells and mono modules, in addition to their multi counterparts. In Q2 2019 global spot market pricing for all major components saw little change from the prior quarter except for pricing for polysilicon and mono cells. Polysilicon prices dropped by over 8% in Q2, a continuation of an 18-month-long trend. Mono cell prices also declined, indicating an end to the cell supply shortage. The increased production of mono cells drove up prices for mono wafers by about $0.01/W.
In the U.S., multi-silicon module prices declined slightly to $0.35/W in Q2 2019 from $0.36/W in Q1 2019. Mono PERC module prices increased by nearly three cents to $0.43/W, reflecting strong demand in the U.S. market.
About the Report
U.S. solar market insight® is a quarterly publication of Wood Mackenzie Power & Renewables, Inc. d/b/a Greentech Media and the Solar Energy Industries Association (SEIA)®. Each quarter, we collect granular data on the U.S. solar market from nearly 200 utilities, state agencies, installers and manufacturers. This data provides the backbone of this U.S. solar market insight® report, in which we identify and analyze trends in U.S. solar demand, manufacturing and pricing by state and market segment. We also use this analysis to look forward and forecast demand over the next five years. All forecasts are from Wood Mackenzie, Limited; SEIA does not predict future pricing, bid terms, costs, deployment or supply.
- References, data, charts and analysis from this executive summary should be attributed to “Wood Mackenzie/SEIA U.S. solar market insight®.”
- Media inquiries should be directed to Wood Mackenzie’s PR team ([email protected]) and Morgan Lyons ([email protected]) at SEIA.
- All figures are sourced from Wood Mackenzie. For more detail on methodology and sources, click here.
- Wood Mackenzie Power and Renewables (WM P&R) partners with Clean Power Research to acquire project-level datasets from participating utilities that utilize the PowerClerk product platform. For more information on Clean Power Research’s product offerings, visit https://www.cleanpower.com/
Our coverage in these reports includes 43 individual states and Washington, D.C. However, the national totals reported include all 50 states, Washington, D.C. and Puerto Rico. The U.S. solar market insight® is offered in two versions – the Executive Summary and the Full Report. The Executive Summary is free, and the Full Report is available individually each quarter or as part of an annual subscription. Detailed data and forecasts by state are available in the Full Report. To find out more, click here.

Note on U.S. solar market insight report title: WM P&R and SEIA have changed the naming convention for the U.S. solar market insight report series. Starting with the report released in June 2016 onward, the report title will reference the quarter in which the report is released, as opposed to the most recent quarter in which installation figures are tracked. The exception will be our year in review publication, which covers the preceding year’s installation volumes despite being released during the first quarter of the current year.
About the Authors
Wood Mackenzie Power & Renewables | U.S. Research Team
Austin Perea, Senior Solar Analyst (lead author)
Colin Smith, Senior Solar Analyst
Michelle Davis, Senior Solar Analyst
Lindsay Cherry, Solar Analyst
Xiaojing Sun, Senior Solar Analyst
Solar Energy Industries Association | SEIA
Shawn Rumery, Director of Research
Aaron Holm, Data Engineer
Rachel Goldstein, Research Analyst
Justin Baca, Vice President of Markets & Research

