
Other Links: Purchase the Full Report | Press Release
The quarterly SEIA/Wood Mackenzie Power & Renewables U.S. Solar Market InsightTM report shows the major trends in the U.S. solar industry. Learn more about the U.S. Solar Market Insight Report. Released March 17, 2020.
1. Key Figures
Please note this edition of Solar Market Insight does not account for impacts of the coronavirus outbreak.
At the time of publication, the full impacts of the coronavirus outbreak on the solar industry were still developing. Given the dynamic nature of the outbreak, it is too early to incorporate any changes into our outlooks with enough certainty. Wood Mackenzie’s solar team is tracking industry changes closely as they relate to solar equipment supply chains, component pricing and project development timelines, taking these impacts into consideration for future publications.
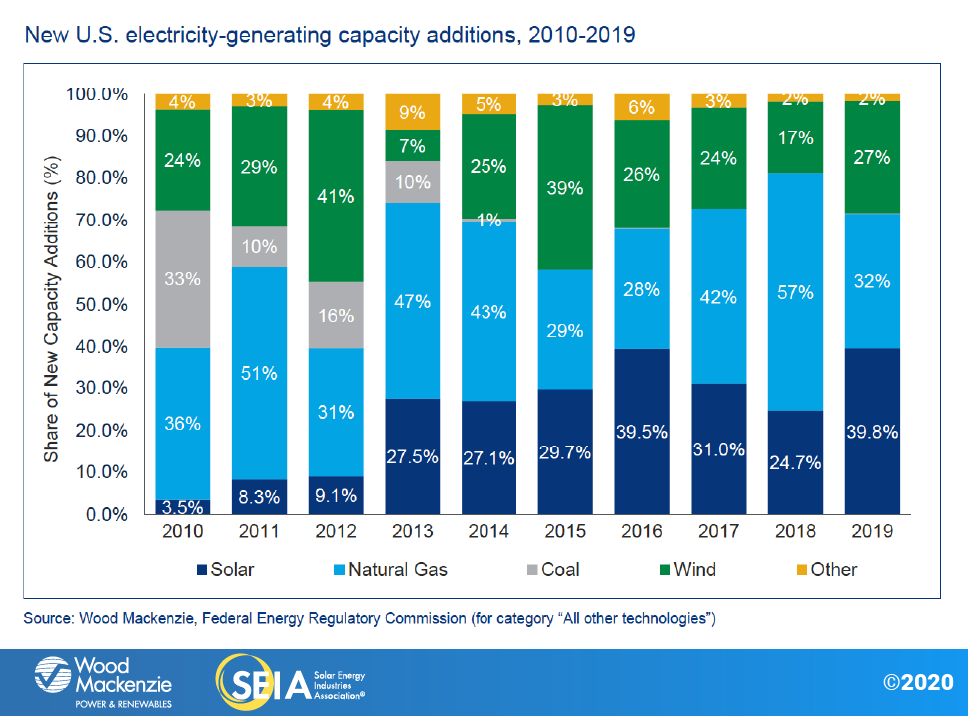
- Solar accounted for nearly 40% of all new electricity generating capacity added in the U.S. in 2019, the largest annual share in the industry’s history.
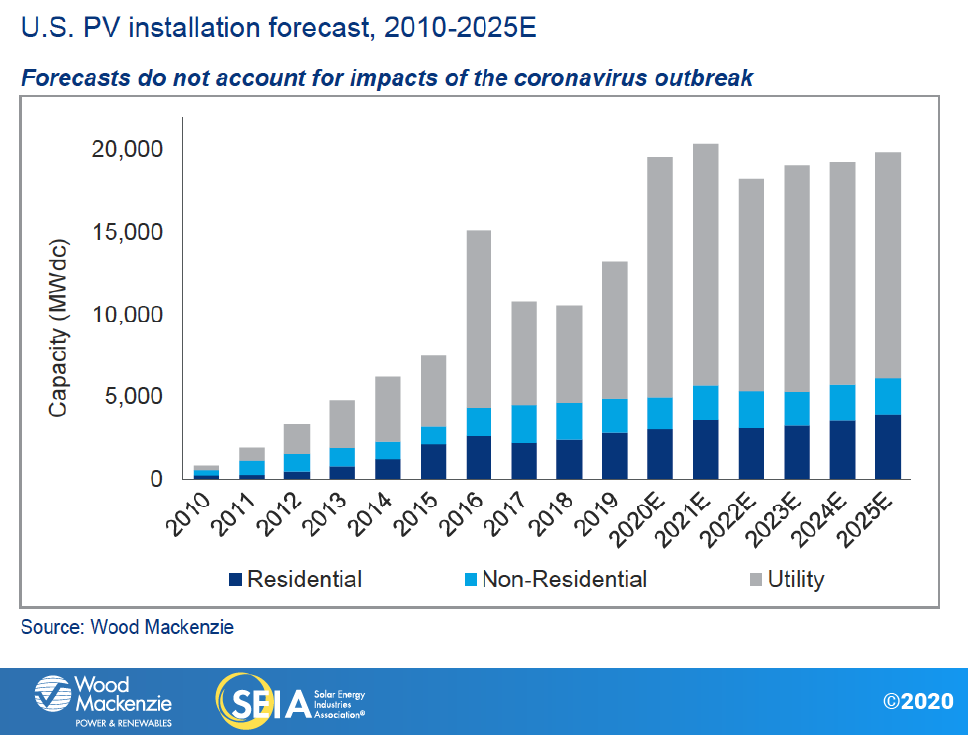
- In 2019, the U.S. solar market installed 13.3 GWdc of solar PV, a 23% increase from 2018.
- Cumulative operating photovoltaic capacity in the U.S. now exceeds 76 GWdc, up from just 1 GWdc at the end of 2009.
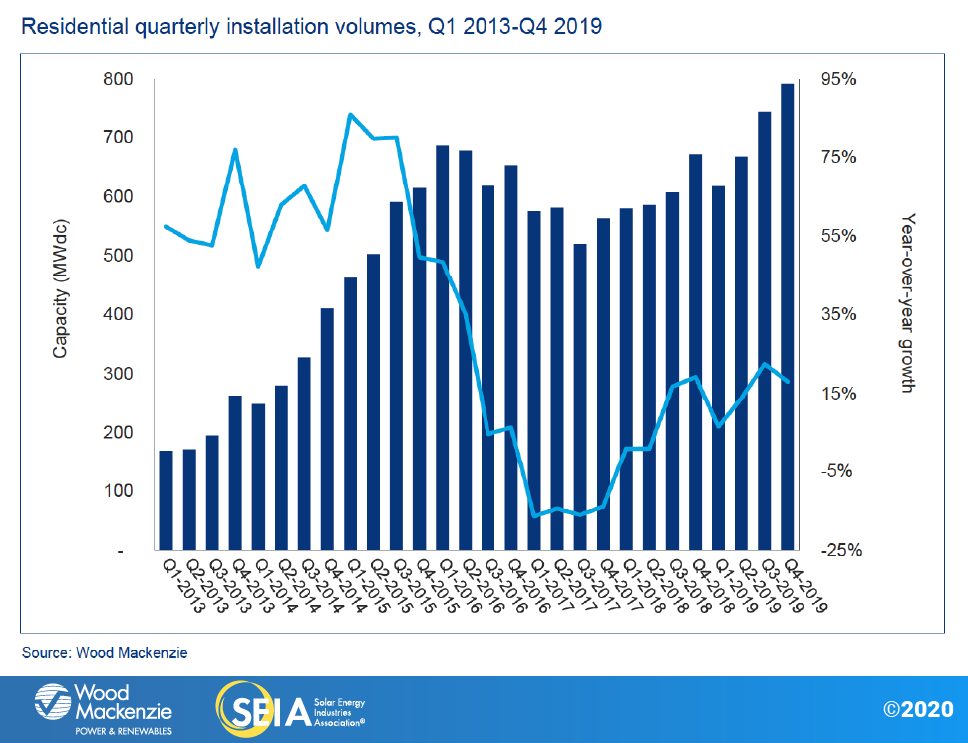
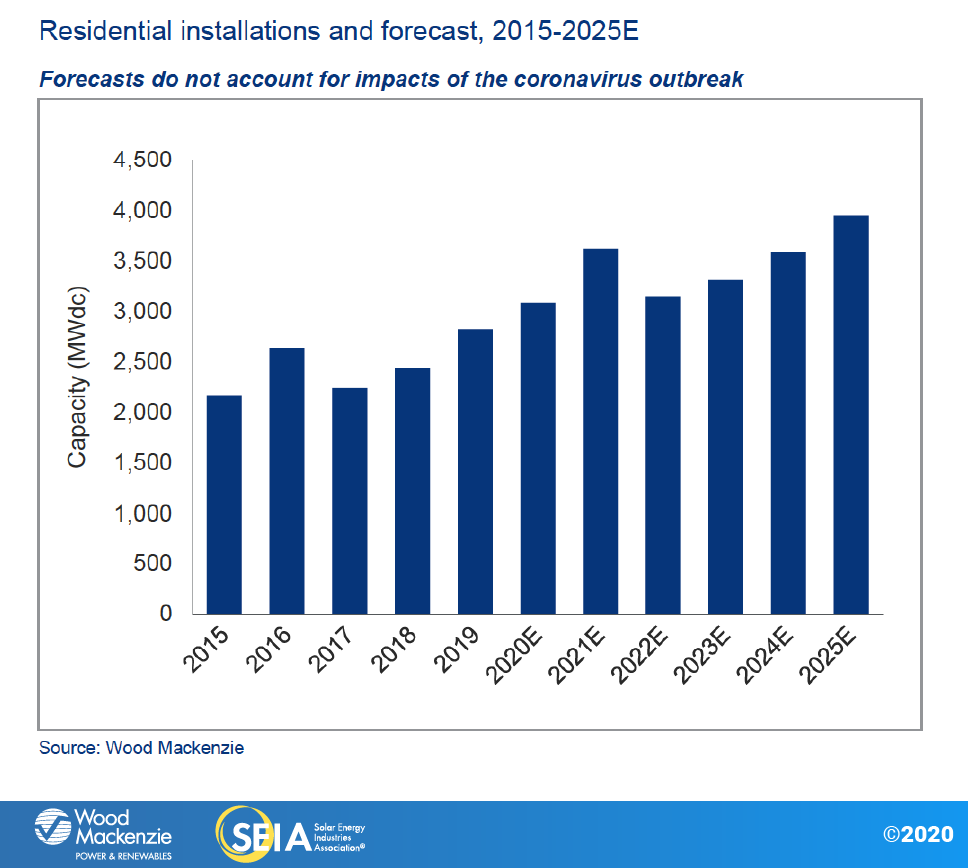
- The U.S. saw record-setting residential solar capacity added in 2019, with more than
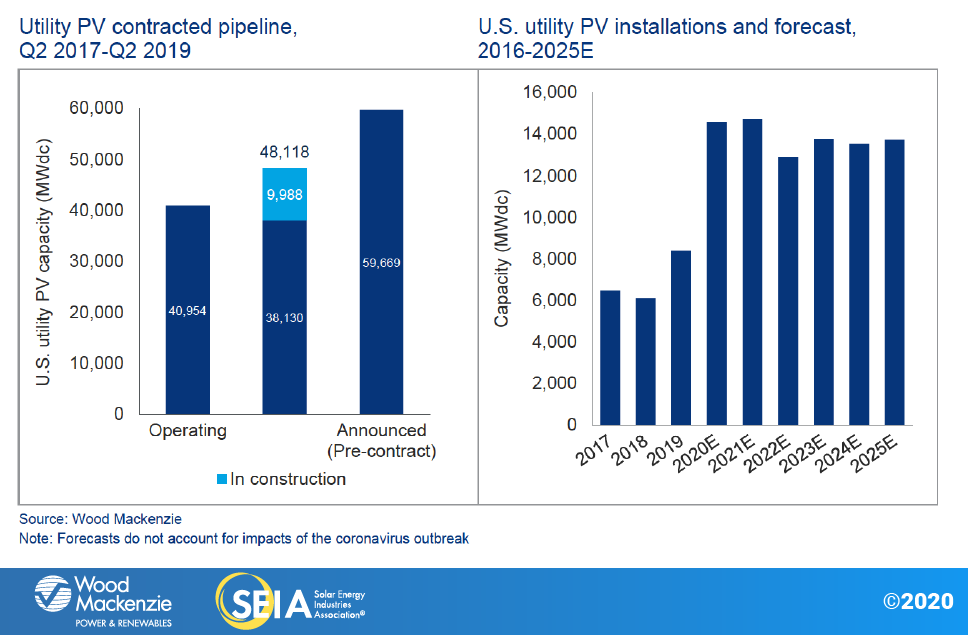
2.8 GWdc installed. - A total of 30.4 GWdc of new utility PV projects were announced in 2019, bringing the contracted utility PV pipeline to a record high of 48.1 GWdc.
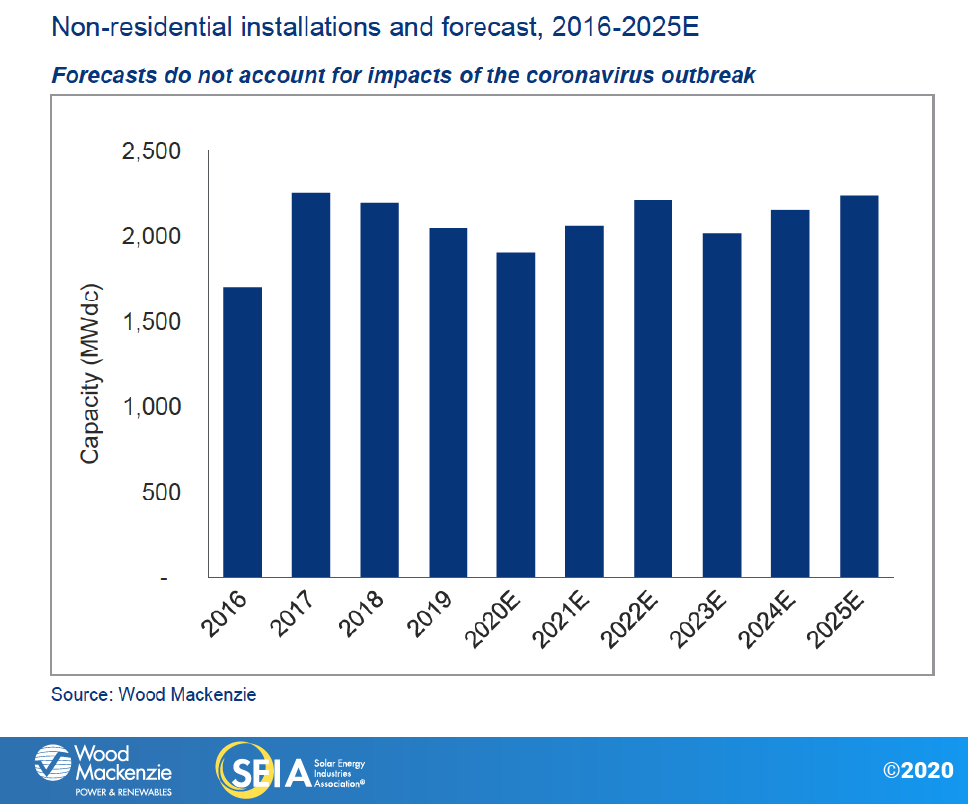
- Non-residential PV declined slightly in 2019 with 2 GWdc installed, as policy shifts in states including California, Massachusetts and Minnesota continue to impact growth.
- Community solar continues to expand its geographic diversification, and it experienced a third consecutive year of more than 500 MW installed.
- Wood Mackenzie forecasts 47% annual growth in 2020, with nearly 20 GWdc of installations expected. In total, more than 9 GW were added to the five-year forecast since last quarter to account for new utility-scale procurement.
- Total installed U.S. PV capacity will more than double over the next five years, with annual installations reaching 20.4 GWdc in 2021 prior to the expiration of the federal Investment Tax Credit for residential systems and a drop in the commercial credit to 10% (under the current version of the law).
- By 2025, one in every three residential solar systems and one in every four non-residential solar systems will be paired with energy storage.
2. Introduction
A note about the impacts of the coronavirus outbreak: At the time of publication, the full impacts of the coronavirus outbreak on the solar industry were still developing. Given the dynamic nature of the outbreak, it is too early to incorporate any changes into our outlooks with enough certainty. Wood Mackenzie’s solar team is tracking industry changes closely as they relate to solar equipment supply chains, component pricing and project development timelines, taking these impacts into consideration for future publications.
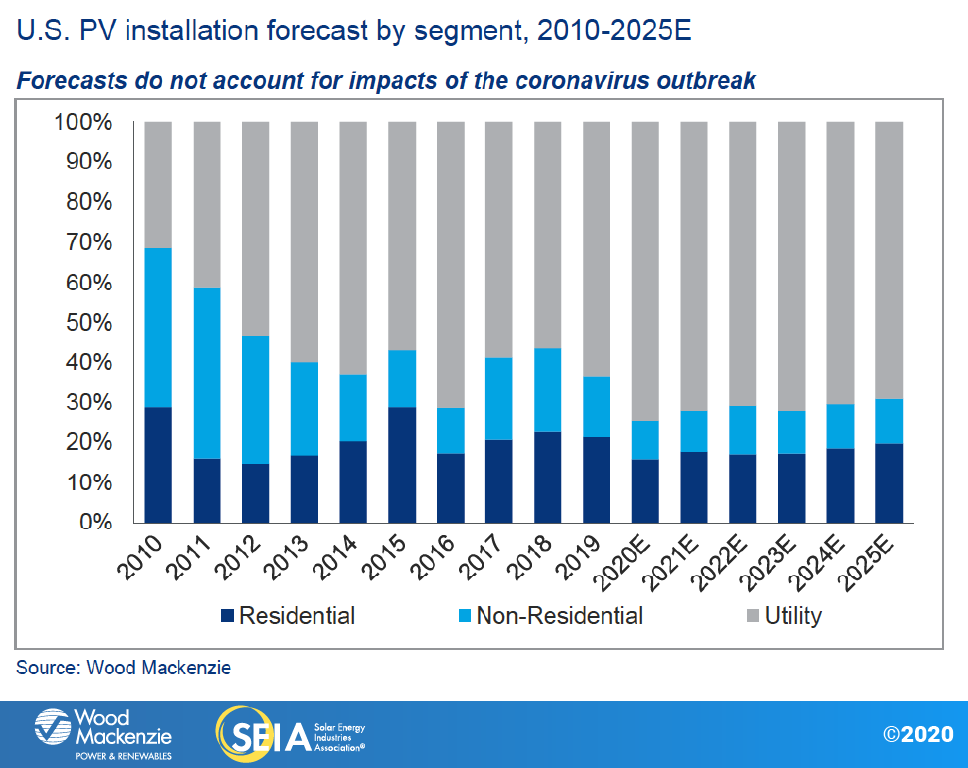
2019 recap: In 2019, the U.S. solar market installed 13.3 gigawatts-direct current (GWdc) of solar photovoltaic (PV) capacity, a 23% increase year-over-year. Residential solar continues to see healthy installation volumes, growing 15% over 2018 levels – the highest annual growth rate since 2016. Conversely, total non-residential PV (which includes commercial, government, nonprofit and community solar) declined relative to 2018 due to policy transitions and persistent interconnection issues in key commercial markets. More than 8.4 GWdc of utility-scale PV capacity came online in 2019, up 37% from 2018, with new procurement growing the contracted pipeline to 48.1 GWdc. Across all market segments, solar PV accounted for nearly 40% of all new electricity-generating capacity additions in 2019 – its highest-ever share of new generating capacity.
Public-safety power shutoffs associated with California wildfires, new-build home solar and emerging market growth combine for a record-breaking close to the decade in residential solar
After years of steady double-digit-percentage growth through 2016, the U.S. residential sector contracted from 2016 to 2017 as national installers pulled back across critical geographies in California and the Northeast. On a national level, 2019 exhibited a return to pre-2016 growth for residential solar as the segment saw annual growth of 15% while achieving its highest installation volumes in history.
A crucial driver of growth for residential PV has been the public-safety power shutoff (PSPS) events in California. Beginning in H1 2019, these power shutoffs provided a key incentive for homeowners to purchase solar, increasingly paired with storage. With PSPS events leaving hundreds of thousands of utility customers without electricity, solar-plus-storage as a resiliency measure has catalyzed the residential solar market.
Meanwhile, California saw increased activity in the new-build home solar space as installers geared up for compliance with the recently enacted state mandate. These combined factors materialized into record-breaking installations in Q4 2019, making California the first U.S. state to install more than 300 MW in a single quarter and ending the year with more than 1 GW of residential solar installed for the third time in history.
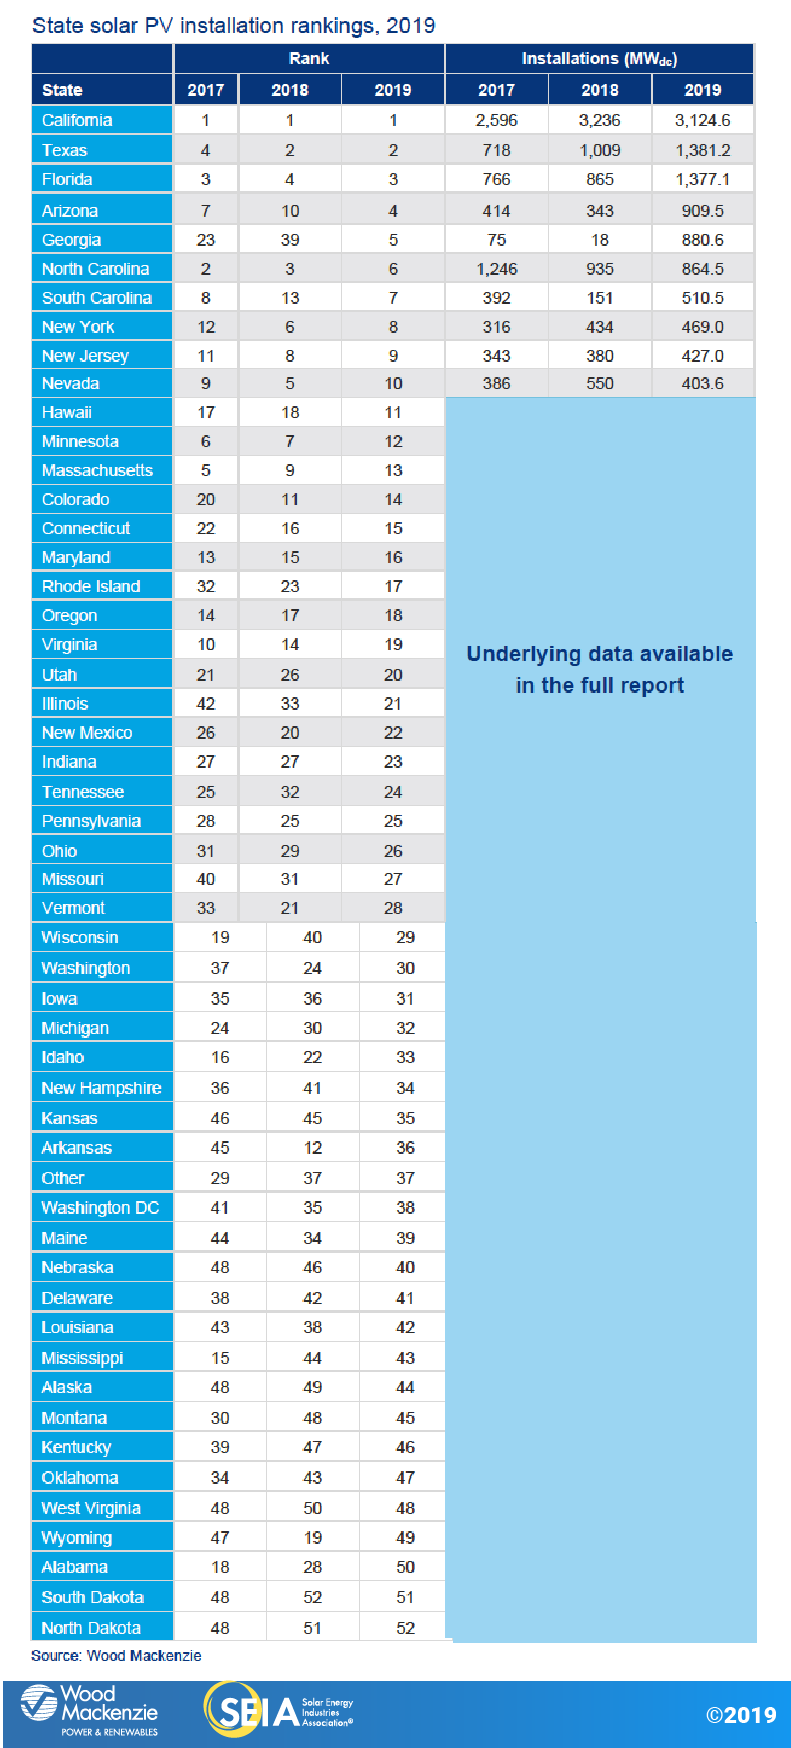
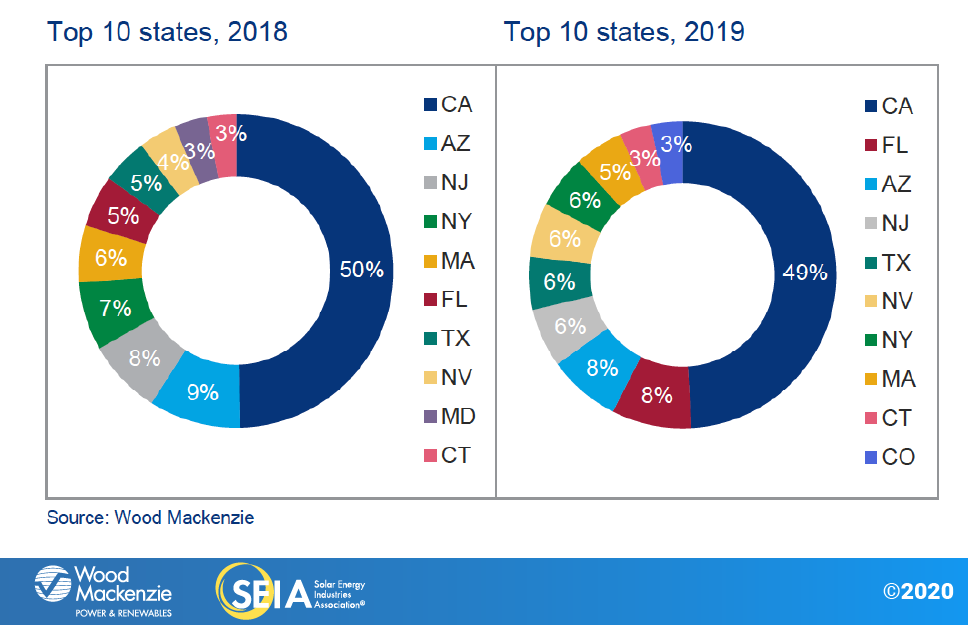
Beyond strong growth in California and stable volumes across Northeast markets, 2019 also demonstrated the ongoing trend of geographic diversification. In 2010, California was the only state to deploy more than 100 MW of residential installations. By the middle of the last decade, six states had reached that threshold. In 2019, that number increased to eight with Texas and Nevada joining the list. Meanwhile, Florida cemented its place as the second-largest residential market in 2019 – the first time a low-penetration, non-incentivized market has achieved that designation.
Non-residential PV enters a second consecutive year of annual decline
In contrast to the growth trajectory of the residential market, non-residential installations continued to be hampered by a handful of state-specific regulatory cliffs and policy reforms in 2019. Major policy shifts continued to hinder development in the core non-residential markets of California, Massachusetts and Minnesota. In the case of California, installations declined year-over-year stemming from the transition to new time-of-use rates and the resulting damage to the favorability of project economics. In Massachusetts, non-residential deployment numbers continue to be limited by interconnection delays and the ongoing National Grid cluster study, despite a pipeline of mechanically complete projects that aren’t yet producing power. As a result, the Bay State had its lowest annual non-residential PV installed capacity total since 2013.
Positive policy developments in New York, Maryland, Maine and New Jersey over the first half of 2019 will boost the non-residential market from 2020 through 2022 before a decline in 2023 begins in response to the step-down of the solar Investment Tax Credit under current federal law.
New utility procurement breaks records; 100% renewables targets and offsite corporate demand boost long-term outlook
Utility PV maintained the largest share of 2019 installed capacity in the U.S., representing 63% of all PV capacity installed during the year. A total of 4.4 GWdc came online in Q4, resulting in 8.4 GWdc of capacity additions for the year.
A total of 10.0 GWdc of projects are currently under construction. While this falls short of the record high of 10.4 GWdc, the fact that 4.0 GWdc of new projects began construction and 4.4 GWdc were completed in Q4 is a testament to the strong demand for U.S. utility PV. With 30.6 GWdc of new projects announced in 2019, the utility PV development pipeline has reached 48.1 GWdc, another record high. It is likely that not all projects announced in 2019 were able to qualify for the 30% investment tax credit (ITC). Going forward, the abnormally high rate of new project announcements will likely start slowing down given that many developers were closing deals prior to the 2019 year-end decrease in the ITC.
The U.S. utility PV market is poised to see 83.2 GWdc installed from 2020 to 2025, more than double what was installed over the last five years. The high demand for utility solar is sustained by several factors. With power-purchase agreement prices ranging from $16 to $35/MWh, the economic competitiveness of solar with other generation sources is driving new procurement in established markets such as Texas and Florida; it is also driving new procurement in markets like Pennsylvania and Oklahoma.
Although the Trump administration’s tariffs on solar modules and other component parts have imposed additional costs, utility PV has continued to be cost-competitive with other generating sources in the U.S. Additionally, the number of states and utilities pledging renewable-energy or carbon-reduction targets continues to rise. Twenty-eight states have formally established clean-energy or carbon-reduction targets, 23 states have signed the U.S. Climate Alliance pledge to reduce economywide emissions by 28% by 2025, and eight governors have issued executive orders mandating increases in renewable or clean-energy targets in their states. While some of these state pledges are not legally binding, they have created demand and pressure for additional renewables in more state markets.
3. Market Segment Outlooks
3.1. Residential PV
Key figures
- 2.8 GWdc installed in 2019
- Up 15% from 2018
2019 was significant for residential solar for several reasons. Beyond seeing the highest number of total solar installations ever recorded, 2019 also brought a shakeup at the top of the residential solar rankings, reflecting the increased geographic diversity of residential solar adoption. For a national market that has long seen several Northeast states at the top of the rankings (that is, established residential PV markets that historically have benefited from high retail electricity rates and robust incentives), 2019 was the first year in which only one Northeast market (New Jersey) cracked the top five rankings. Instead, the top five state markets are a mixture of mature and emerging markets, with solid installation totals coming from established markets such as California and Arizona but also from newcomers Florida (No. 2) and Texas (No. 5).
While growth in these emerging markets is driven by increasingly attractive project economics, geographic diversification has also resulted in part from a slowdown in Northeast markets. In this region, higher levels of solar penetration and resulting steep customer-acquisition costs have slowed installation volumes since the peak installation years as the markets have grown past the segment of early-adopter consumers. These higher soft costs remain a long-term risk to the national market over the next few years, especially if the federal solar Investment Tax Credit steps down as scheduled under current law and so long as cost continues to be the foremost criterion in consumers’ decision whether to adopt solar.
In 2019, California also demonstrated that residential solar adoption across the U.S. can be driven by other factors such as resiliency and concerns about climate change. In California, the combination of new-build home solar adoption (which began to gain steam in 2019 and is legally required for most single-family homes starting in 2020) and increasing disaffection with utilities due to public-safety power shutoffs (PSPS) is beginning to drive solar installations, increasingly paired with storage. While some of these drivers are now specific to California, national press coverage of PSPS and wildfires in the state, along with increased international emphasis on climate solutions, may encourage residential solar adoption across the country.
From 2020-2021, residential growth will range from 9% to 17% due to both emerging markets with strong resource fundamentals like Florida and Texas and markets where recent policy developments have increased our near-term forecasts. For example, Maryland’s recent renewable portfolio standard increase, the removal of South Carolina’s net metering cap and new incentive programs such as Illinois’ Adjustable Block Program all provide upside potential to our residential forecasts over the next few years.
In the long term, the ITC step-down is expected to pull in demand across all markets before expiring in 2022 for customer-owned systems. After a soft 2022, modest growth will resume in 2023 and continue into 2024, based on economic fundamentals as the market adjusts to post-ITC market conditions. Long-term growth in a post-ITC world will be contingent on continued geographic diversification outside of established state markets (with markets including Pennsylvania and Colorado beginning to take off) as well as regulatory, technological and business-model innovation to improve product offerings in the solar-plus-storage space. Assuming modest growth on these fronts, residential solar growth is expected to reach high-single-digit percentages by the mid-2020s.
3.2. Non-residential PV
Key figures
- 2 GWdc installed in 2019
- Down 7% from 2018
Non-residential installations were relatively weak in 2019 in California and Massachusetts, which continue to see declining volumes due to state-level policy reforms and interconnection delays that limit development opportunities. Meanwhile, Minnesota’s community solar pipeline continues to diminish as grandfathered projects are built without pipeline replenishment for projects compensated under revised export credit rules. While this contributed to minor deployment declines in 2019, the year also marked the long-expected emergence of New York as a major community solar market. With more than 200 MW of community solar interconnected in 2019, New York helped offset installation declines in Minnesota. Going forward, the next wave of states with robust community solar mandates – New York, Maryland, Illinois and New Jersey – is expected to support growth and offset declines seen in the first major community solar market of Minnesota.
Recent policy developments in the Northeast will ultimately spur growth in our long-term outlook. New Jersey regulators have approved a transitional incentive program, slightly raising incentive values for community solar projects that appear to be workable across most market sub-segments. Meanwhile, New Jersey regulators have approved the first batch of community solar projects for the program’s initial pilot year. That said, the approved projects will comprise only low- to moderate-income (LMI) customers, who have proven difficult to reach in other state markets. Accordingly, we have made downward revisions to our community solar forecasts.
In New York, significant revisions to the Value of Distributed Energy Resources tariff, in conjunction with the approval of consolidated billing for community solar, have bolstered our long-term forecasts for both commercial and community solar. Furthermore, Maryland and Maine both passed more aggressive renewable portfolio standard policies, which are expected to boost lagging renewable energy credit markets. Maine went even further, instituting a commercial solar tariff and a community solar program.
Increasing solar-plus-storage viability will also begin to support non-residential demand growth as policymakers and business leaders increasingly consider energy storage in their decision-making processes. By 2025, roughly 30% of total non-residential PV capacity will come from community solar, and one out of every four non-residential solar systems is expected to be paired with storage.
3.3. Utility PV
Key figures
- 8,402 MWdc installed in 2019
- 4,380 MWdc installed in Q4 2019, second-largest single quarter in history
- Utility PV pipeline currently totals 48.1 GWdc
The utility PV sector served as the bedrock of the U.S. solar industry in 2019, accounting for 63% of annual capacity additions. The cumulative capacity of utility PV sits at 45.7 GWdc, representing 60% of all U.S. solar PV capacity. Over the next five years, we expect 82 GW of utility-scale solar to come online, nearly double the amount installed over the last 10 years. Annual procurement reached an all-time high in 2019 with 30.6 GWdc worth of new power-purchase agreements signed or announced. This has brought the cumulative contracted pipeline to a new record total of 48.1 GWdc. This surge was driven by developers and utilities safe-harboring as much capacity as possible to qualify for the full 30% ITC before it stepped down to 26% on 1 January 2020. We also continue to see a growing volume of utilities including solar in their long-term integrated resource plans and requests for proposals.
Voluntary procurement remains the largest driver of utility PV in the U.S., accounting for 57% of new procurement in 2019. However, there has been a rise in the number of projects driven by renewable portfolio standards, increasing from 10% in 2018 to 14% in 2019. Utility PV remains economically competitive against all other technologies in most state markets. As the federal Production Tax Credit for wind steps down, utility-scale solar will begin to make inroads in markets that have long been dominated by wind, while continuing to remain economically competitive with natural gas.Corporate procurement of offsite utility PV drove 5.8 GWdc worth of new contracts in 2019, representing 19% of all procurement for the year. More than one-third of these projects are located in Texas, spurring rapid growth in the Lone Star State. Finally, several utilities have publicly announced their intention to procure projects with target commercial operation dates of 2024 or later; further details will help inform WoodMac’s long-range forecasts.Since last quarter, the five-year forecast has grown by 2.1 GWdc. The 2020 forecast grew by 0.5 GWdc due to increased confidence in near-term projects being completed in 2020 and the spillover of several 2019 projects into 2020. The 2021-2024 forecast saw a cumulative increase of 1.6 GWdc as more utilities begin procurement of utility-scale PV that was either previously outlined in resource planning documents or needed in order to fill capacity needs. With utility PV remaining economically competitive with other sources of generation, demand for utility PV remains strong through the decade, creating 13.7 GWdc of expected capacity additions in 2025.
4. National Solar PV System Pricing
We employ a bottom-up modeling methodology to capture, track and report national average PV system pricing for the major market segments. Our bottom-up methodology is based on tracked wholesale pricing of major solar components and data collected from multiple interviews with industry stakeholders. Due to increased demand for mono PERC solar modules, beginning with the 2019 Year in Review report, we will begin to report blended module prices for non-residential and utility market segments in addition to residential. This represents a weighted average of multi-silicon and mono PERC solar modules as opposed to pricing for multi-silicon modules only. Since the fourth quarter of 2019 is the first quarter with these new blended system prices, comparing Q4 2019 system prices to previous quarters for non-residential and utility will not be applicable. Mono PERC solar modules are more expensive than multi-silicon, and therefore the new blended module price methodology will yield higher system prices.
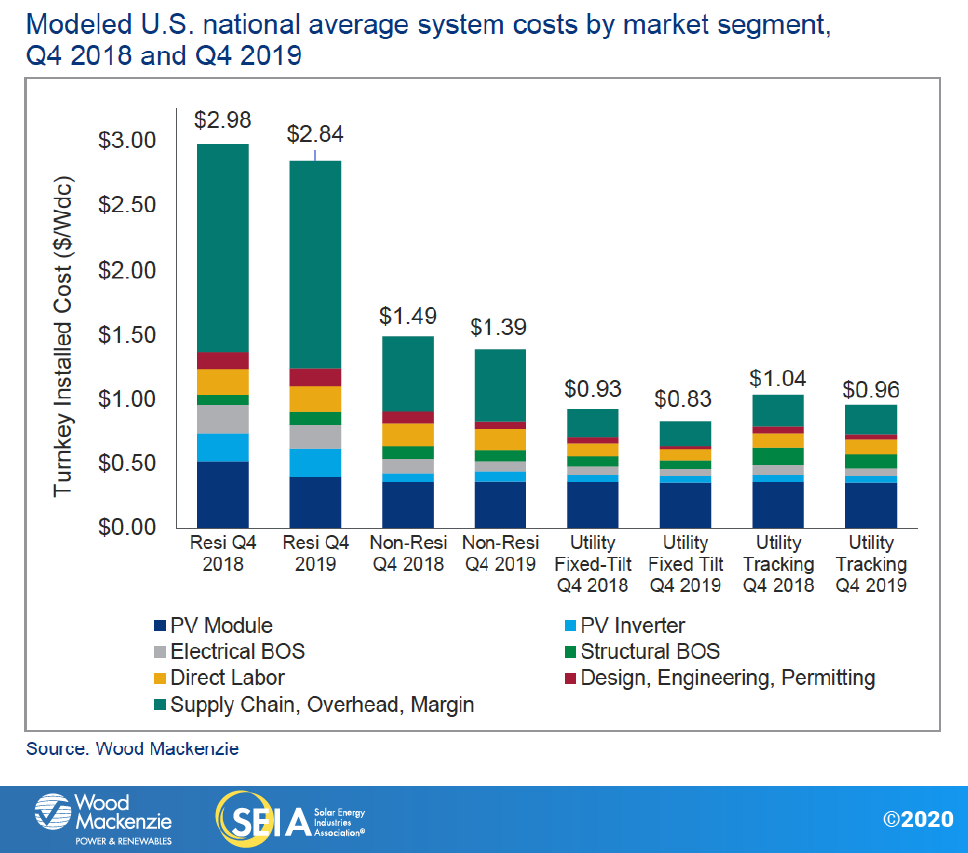
Note: Module prices in Q4 2018 reflect multi-silicon modules whereas module prices in Q4 2019 reflect a blended average of multi-silicon modules and mono PERC modules. Be wary of this when making comparisons in system prices. Detailed information about national system prices by market segment and component is available in the full report.
5. Component Pricing
Starting in Q1 2019, the U.S. Solar Market Insight report series expanded its coverage to include pricing information on mono wafer, mono cells and mono modules, in addition to their multi counterparts.
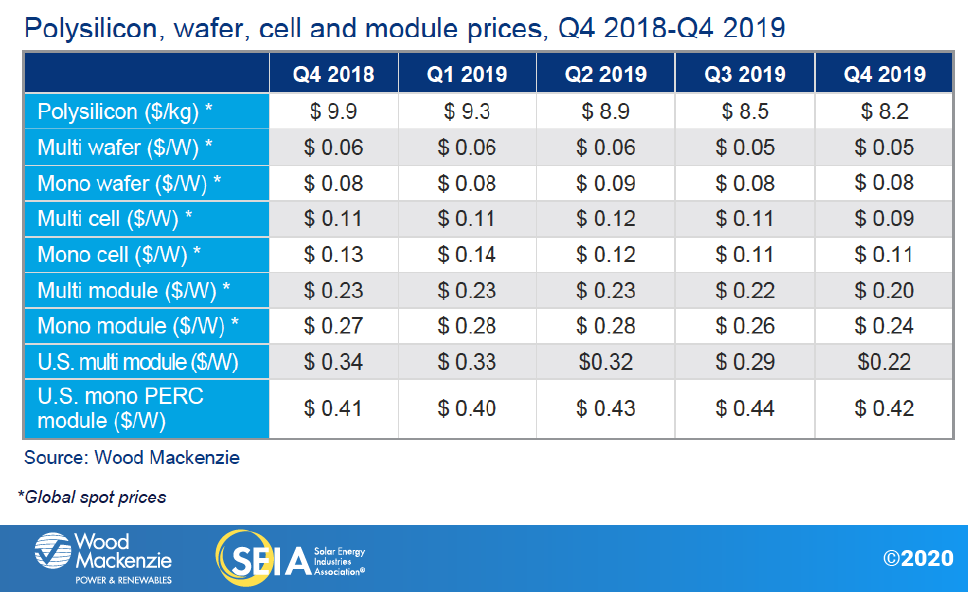
In Q4 2019, global spot market pricing for all major components declined by various degrees from the previous quarter. Polysilicon prices decreased by 3.5% in Q4, resulting in commensurate mono and multi wafer price declines. Multi cell global spot prices continued to fall for the second quarter in a row, responding to shrinking global demand for the product. A similar trend holds true for multi modules. As new mono cell production capacities continued to come online in Q4, their prices held steady in the second half of 2019. Nevertheless, mono module prices fell by two cents in Q4, reflecting a healthy supply level.
In the U.S., multi-silicon module prices collapsed to 0.22/watt in Q4 2019, further proof that multi modules are essentially obsolete in the U.S. market. Mono PERC module prices finally broke the streak of price increases in Q4 2019, falling by two cents to $0.42/W for utility-scale projects.
In Q4 2019, the pricing for bifacial modules fluctuated due to international trade concerns. In December 2019, the United States Court of International Trade issued a temporary injunction, reversing the Office of the U.S. Trade Representative’s October attempt to reimpose Section 201 tariffs on imported bifacial modules. As a result, the delivered prices for bifacial modules in the U.S. went up in October with the withdrawal of the tariff exemption; they were dropped again after the December temporary injunction. Without tariffs, bifacial modules were, on average, competitive in price with mono-facial modules.
About the Report
U.S. solar market insight® is a quarterly publication of Wood Mackenzie Power & Renewables, Inc. d/b/a Greentech Media and the Solar Energy Industries Association (SEIA)®. Each quarter, we collect granular data on the U.S. solar market from nearly 200 utilities, state agencies, installers and manufacturers. This data provides the backbone of this U.S. solar market insight® report, in which we identify and analyze trends in U.S. solar demand, manufacturing and pricing by state and market segment. We also use this analysis to look forward and forecast demand over the next five years. All forecasts are from Wood Mackenzie, Limited; SEIA does not predict future pricing, bid terms, costs, deployment or supply.
-
References, data, charts and analysis from this executive summary should be attributed to “Wood Mackenzie/SEIA U.S. solar market insight®.”
-
Media inquiries should be directed to Wood Mackenzie’s PR team ([email protected]) and Morgan Lyons ([email protected]) at SEIA.
-
All figures are sourced from Wood Mackenzie. For more detail on methodology and sources, click here.
-
Wood Mackenzie Power and Renewables (WM P&R) partners with Clean Power Research to acquire project-level datasets from participating utilities that utilize the PowerClerk product platform. For more information on Clean Power Research’s product offerings, visit https://www.cleanpower.com/
Our coverage in the U.S. Solar Market Insight reports includes all 50 states and Washington, D.C. However, the national totals reported also include Puerto Rico and other U.S. territories. Detailed data and forecasts for 50 states and Washington, D.C. are contained within the full version of this report. To find out more, click here.

Note on U.S. solar market insight report title: WM P&R and SEIA have changed the naming convention for the U.S. solar market insight report series. Starting with the report released in June 2016 onward, the report title will reference the quarter in which the report is released, as opposed to the most recent quarter in which installation figures are tracked. The exception will be our year in review publication, which covers the preceding year’s installation volumes despite being released during the first quarter of the current year.
About the Authors
Wood Mackenzie Power & Renewables | U.S. Research Team
Austin Perea, Senior Solar Analyst (lead author)
Colin Smith, Senior Solar Analyst
Michelle Davis, Senior Solar Analyst
Xiaojing Sun, Senior Solar Analyst
Bryan White, Solar Analyst
Molly Cox, Solar Analyst
Gregson Curtin, Research Asssociate
Solar Energy Industries Association | SEIA
Shawn Rumery, Director of Research
Aaron Holm, Data Engineer
Rachel Goldstein, Solar and Storage Analyst
Justin Baca, Vice President of Markets & Research

