Solar Market Insight Report 2021 Q4
The quarterly SEIA/Wood Mackenzie Power & Renewables U.S. Solar Market InsightTM report shows the major trends in the U.S. solar industry. Learn more about the U.S. Solar Market Insight Report. Released December 14, 2021.
1. Key Figures
- In Q3 2021, the US solar market installed 5.4 GWdc of solar capacity, a 33% increase over the third quarter of 2020 and the largest Q3 on record.
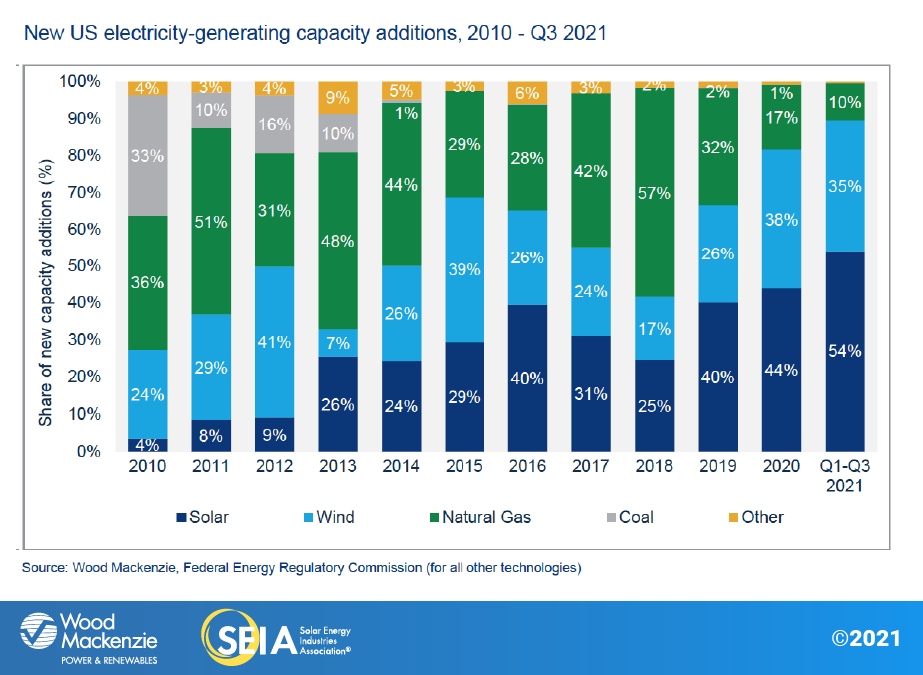
- Solar accounted for 54% of all new electricity-generating capacity added in the US in the first three quarters of 2021.
- Residential solar installations exceeded 1 GWdc and more than 130,000 systems in a single quarter for the first time. One out of every 600 US homeowners is now installing solar each quarter.
- Commercial and community solar fell 10% and 21% quarter-over-quarter, respectively. Major markets for these segments continue to experience delays from interconnection issues and equipment delivery.
- Utility-scale solar set another record for third-quarter installations at 3.8 GWdc. Texas and Virginia accounted for more than half of the utility-scale solar installed in Q3.
- A total of 6.1 GWdc of new utility-scale solar power purchase agreements were signed in Q3 2021, bringing the contracted pipeline to 81 GWdc.
- Supply chain constraints and logistics challenges, including months of disrupted shipments due to the recently dismissed AD/CVD petition, are expected to lower the 2022 outlook for US solar by 25% or 7.4 GWdc. Projects that have already procured their equipment are the most likely to be built next year.
- Installed costs increased across all market segments for the second quarter in a row, reflecting supply chain challenges. In every segment besides residential, year-over-year price increases were the highest they’ve been since 2014, when Wood Mackenzie began tracking pricing data.
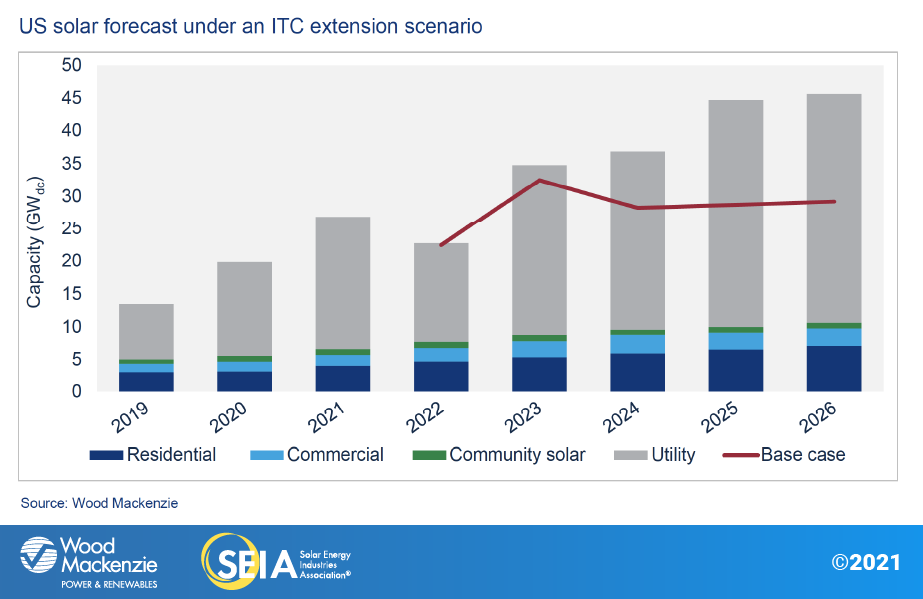
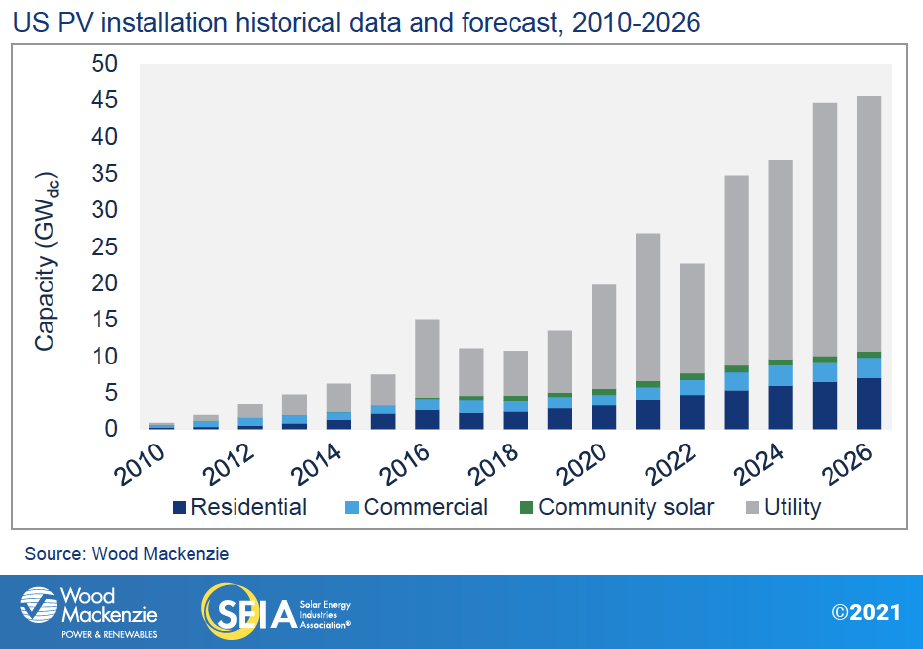
- Amidst supply chain constraints, the industry is eagerly watching the progression of the Build Back Better (BBB) Act through Congress. Wood Mackenzie has included a forecast scenario assuming the passage of this legislation which would extend the Investment Tax Credit (ITC) and other key clean energy incentives. This scenario results in a 31% increase to the base case, representing an additional 43.5 GWdc of solar capacity between 2022 and 2026.
2. Introduction
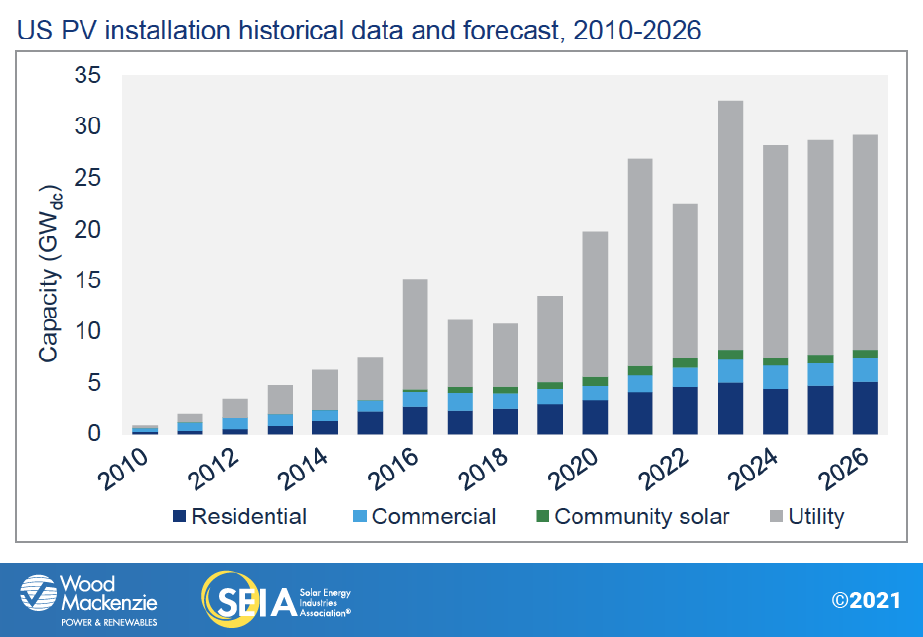
The US solar industry had another record-breaking quarter in the third quarter of 2021, with 5.4 gigawatts-direct current (GWdc) of capacity installed. A total of 15.7 GWdc have been installed so far this year, on pace to easily exceed 20 GWdc in 2021 and set another annual record. Residential solar installations exceeded 1 GWdc in a single quarter for the first time. At this rate, one out of every 600 US homeowners will install solar each quarter, putting the sector on a path to completing half a million systems in a single year.
Utility and residential solar grew quarter-over-quarter and year-over-year in Q3 2021, while commercial and community solar volumes shrank from Q2. Many of these markets continue to struggle with interconnection delays and costs, despite rising demand. Overall, solar PV accounted for 54% of all new electricity-generating capacity additions from Q1 to Q3 of 2021 and continues to make up the largest share of new generating capacity in the US.
Supply chain constraints continue to raise prices and reduce project completions
Despite continued installation growth, the next year will be challenging for the solar industry. Thanks to ongoing supply chain constraints and price increases, Wood Mackenzie has lowered the 2022 outlook by 33%, a decrease of 7.4 GWdc. The 2022 outlooks for utility, commercial, and community solar segments have been lowered by 33%, 4%, and 0.3%, respectively. While the outlook for residential solar has increased 4%, installers acknowledge that expectations would be even higher in the absence of supply chain constraints. Solar industry veterans report that equipment procurement and pricing for projects currently under development are by far the most challenging they’ve ever experienced.
Unsurprisingly, these problems are the most acute for utility solar because most equipment for these projects comes from overseas. National system prices have increased 11.7% for fixed-tilt projects and 8.5% for single-axis tracking projects since Q4 2020. As developers grapple with equipment delays, higher equipment costs and contract negotiations, the online dates of multiple gigawatts of projects have been pushed from 2022 into 2023 or later. The projects likely to come online next year already have secured equipment.
Various trade actions bring relief…for now
The solar industry got some near-term relief on November 10th, when the US Department of Commerce dismissed petitions to issue anti-dumping and countervailing duties (AD/CVD) on solar cells from Malaysia, Thailand, and Vietnam. A Wood Mackenzie analysis determined that these duties could double US module prices, significantly reducing project competitiveness. Even before the US government took any action, the threat of the petitions stalled shipments of equipment from these countries due to the unbounded risk, further exacerbating supply chain constraints. The dismissal of the petitions was welcome news to the industry, and shipments are expected to resume.
Also on November 10th, US Customs and Border Protection (CBP) clarified policies around the enforcement of its Withhold Release Order (WRO) against silica-based products from Hoshine Silicon Industry Co. in China’s Xinjiang region. The CBP’s newest FAQ document explains that importers can lower the risk of detentions by demonstrating that the polysilicon in their products came from outside of Xinjiang. Traceability for component materials like polysilicon is easier than metallurgical-grade silicon (MGS). There are also sufficient (and growing) polysilicon sources available outside of the sources implicated by the WRO. And tools like SEIA’s Supply Chain Traceability Protocol help demonstrate the provenance of key inputs such as polysilicon, further easing WRO compliance. Taken together, the solar industry is better positioned to navigate the WRO.
Finally, on November 16th, the US Court of International Trade (CIT) reinstated the exemption for bifacial modules from the Section 201 tariffs. Additionally, the CIT’s decision reduced the Section 201 tariffs for crystalline-silicon modules from the prior 18% to 15%. This presents some near-term pricing relief for utility solar projects intending to use bifacial modules. And the broader tariff decrease improves the likelihood that if the Section 201 tariffs are extended in February, they’ll be extended at the lower rate.
An ITC extension would boost solar capacity by 31% over the next five years
While supply chain constraints and trade actions threaten the industry, the Build Back Better (BBB) Act presents significant upside for long-term solar growth. The House version of the bill, passed on November 19th, includes extensions and modifications to critical clean energy tax credits. Most importantly for the solar industry, the bill extends the Investment Tax Credit (ITC), allows solar projects to opt for the Production Tax Credit (PTC), creates a standalone storage ITC, and allows project owners to elect direct payment of tax credits, depending on whether a project meets domestic content requirements (see table below). The bill now heads to the Senate where changes to the House bill could still be made.
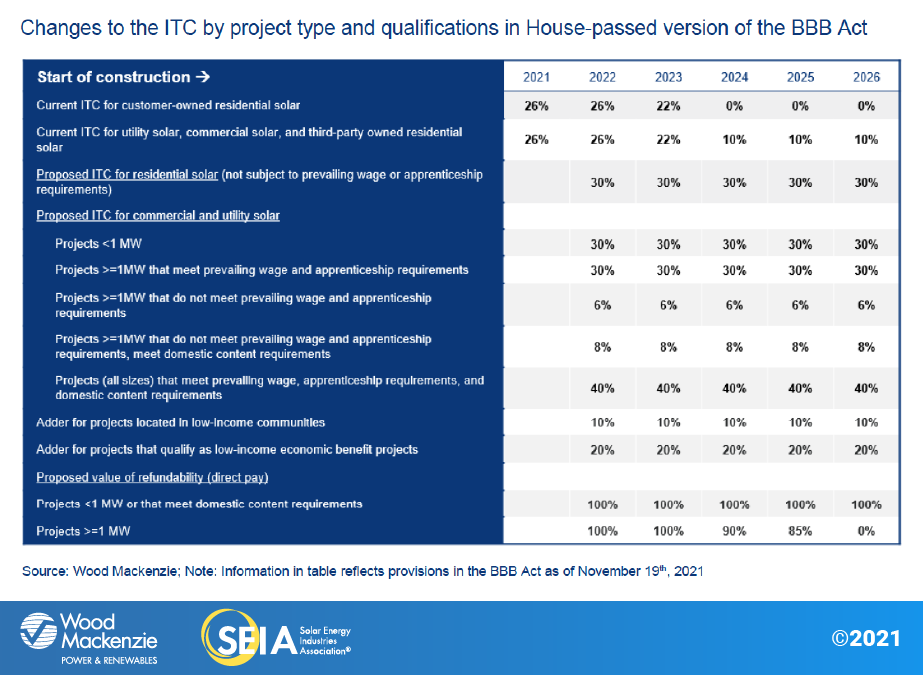
In addition to the base case forecasts, Wood Mackenzie has included a forecast scenario that assesses the industry impact of the House version of the BBB Act (referred to as the “ITC extension scenario” throughout the report).
The ITC extension scenario would result in an additional 43.5 GWdc of solar capacity over the next five years, most of which would come from utility solar. While utility solar projects will face supply chain constraints in the near-term, an ITC extension would continue the segment’s economic competitiveness, and partially compensate for price increases due to supply chain constraints. Certain utility solar projects may opt for the PTC, which can be a richer incentive than the ITC for projects with particularly high capacity factors.
Residential and commercial solar would also benefit from the direct payment options for the Section 48 credit and the refundability for the Section 25D credit. As residential solar becomes more affordable, the refundability of the tax credit will expand the addressable market to customers with lower tax liabilities. And for commercial solar, the ability to take advantage of the tax credits without needing equivalent tax liability will increase opportunities for small and medium commercial solar projects that previously struggled to obtain tax equity financing.
But the solar industry needs more than tax credits to help achieve net-zero targets
The clean energy tax credits in the BBB Act can’t overcome every industry barrier. Transmission and distribution constraints are an increasingly stubborn challenge for solar projects across all segments. While an ITC extension can help developers pay for interconnection upgrade costs, increased grid hosting capacity and improved grid integration are still desperately needed. Fortunately, the bill also contains provisions to incentivize transmission buildout, in addition to what is already enacted in the recent infrastructure bill. Expanded tax credits for energy storage could also ease some of the interconnection and hosting capacity challenges for solar projects.
Finally, while an ITC extension would be a major solar market stimulant, more aggressive deployment is needed to hit President Biden’s decarbonization goals. Based on prior modeling from Wood Mackenzie (before the formation of the BBB Act), an extension of the ITC at 26% and the PTC at $15/MWh results in the US electric sector reaching 55% carbon-free energy by 2030. To hit President Biden’s goal of 80% by 2030, there is a critical need for more energy storage and enhanced transmission and distribution infrastructure.
3. Market segment outlooks
3.1. Residential PV
Key figures
- 1,073 MWdc installed in Q3 2021
- Up 39% from Q3 2020
- Up 8% from Q2 2021
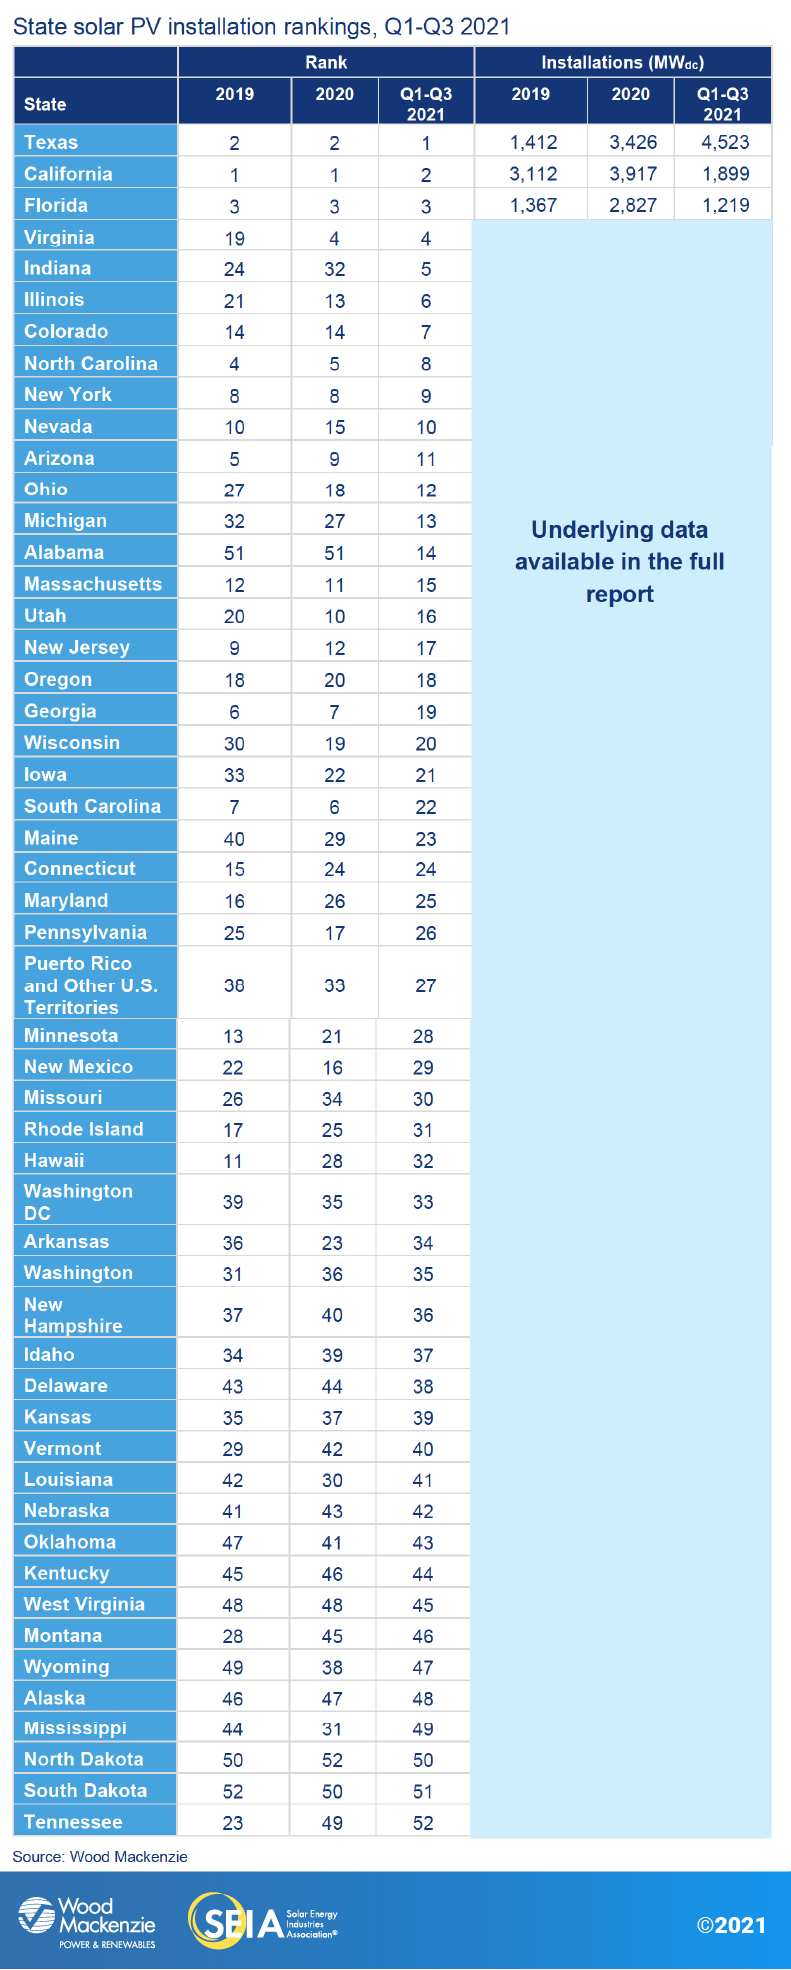
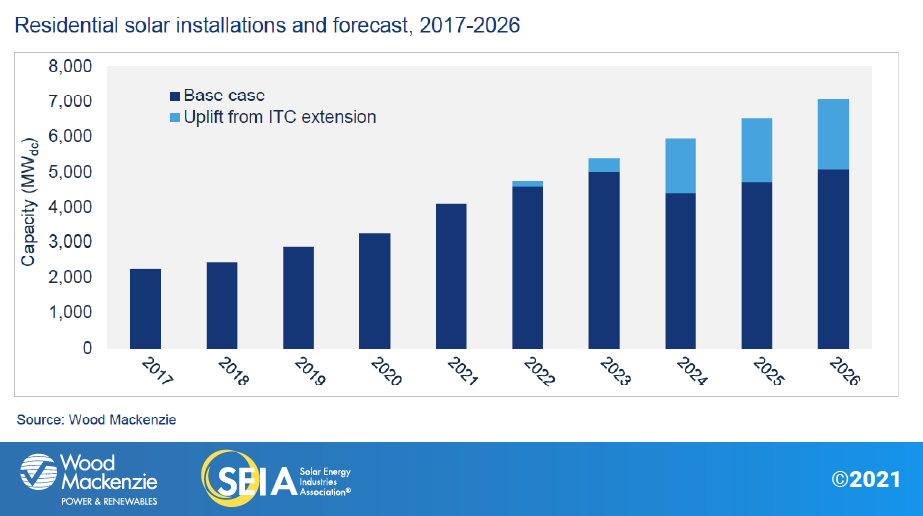
The residential solar industry installed 1,073 MWdc in Q3, setting a record for quarterly installations and surpassing 1 GWdc installed in a single quarter for the first time. California (373 MWdc) and Texas (90 MWdc) led the way with record-breaking quarters.
Residential solar market activity in 2021 so far indicates that installers are converting high consumer demand into sales and installations. This is despite supply chain issues causing longer project timelines and higher component prices, as well as persistent permitting and labor constraints. Installers report that these challenges are prohibiting even higher growth. Wood Mackenzie forecasts 12% growth in the residential segment next year, assuming bottlenecks do not dramatically worsen.
An ITC extension in the BBB Act would allow the residential solar market to continue its current healthy growth trajectory. As system prices decline, a 30% ITC would support project economics in smaller markets that compensate residential solar at relatively low levels. It would also enable growth in higher-penetration markets that have moved beyond early adopters. Direct pay provisions for the Section 48 credit and Section 25D refundability also provide upside for the residential market. Wood Mackenzie forecasts an additional 5.8 GWdc of residential capacity between 2022-2026 in an extension scenario. The market would grow at an average annual rate of 11.5% during this time.
3.2. Commercial PV
Key figures
- 327 MWdc installed in Q3 2021
- Down 4% from Q3 2020
- Down 10% from Q2 2021
Note on market segmentation: Commercial solar encompasses distributed solar projects with commercial, industrial, agricultural, school, government or nonprofit offtakers, including remotely net-metered projects. This excludes community solar (covered in the following section).
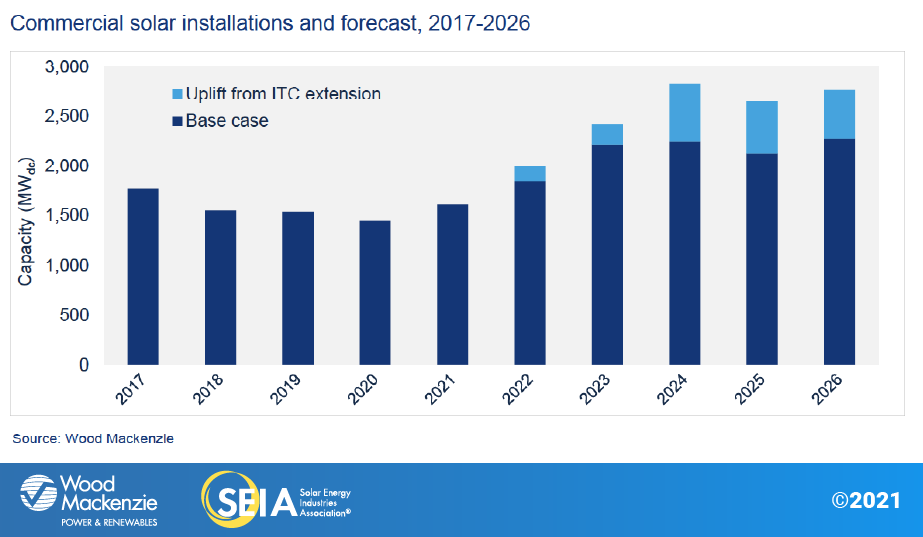
The commercial solar industry installed 327 MWdc in Q3, less than both the first and second quarters. It was evident in Q2 that some markets were experiencing project delays, pushing capacity into 2022. But Q3 volumes indicate that these delays are more widespread than originally expected. Supply chain constraints have caused equipment delays or change orders that can result in project redesigns, pushing out online dates. Consequently, we now expect 2022 and 2023 to be higher growth years than 2021.
At the same time, the outlooks for Illinois and New Jersey have improved, driving upward revisions to annual capacity in 2023 and 2024. Illinois passed the Energy Transition Act, reviving critical programs for distributed solar. And in New Jersey, a glut of Transition Incentive projects will increase capacity in the next few years – more than 700 MWdc of applications were submitted between June and September.
If an ITC extension were passed as part of the BBB Act, the commercial solar forecast would increase by 18% from 2022-2026 compared to the base case. While small and medium commercial solar will benefit from new refundability provisions for the tax credit, state incentive program fluctuations and interconnection challenges continue to have an outsized impact on commercial solar markets.
3.3. Community solar PV
Key figures
- 180 MWdc installed in Q3 2021
- Up 56% from Q3 2020
- Down 21% from Q2 2021
Note on market segmentation: Community solar projects are part of formal programs where multiple customers can subscribe to the power produced by a local solar project and receive credits on their utility bills.
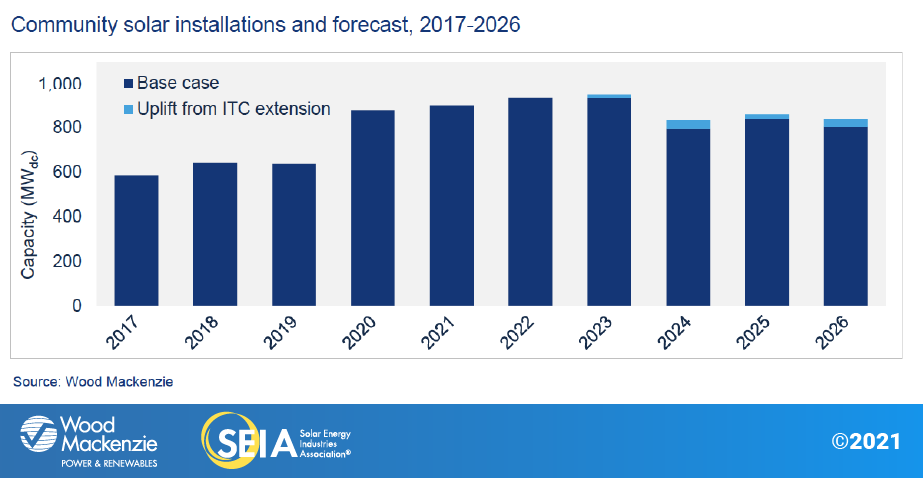
Community solar installations in Q3 2021 dropped quarter-over-quarter but significantly grew year-over-year and remain on pace for a record-setting year. A substantial amount of community solar capacity is expected to come online in the fourth quarter, as is typical for this sector.
Maine and Massachusetts’ forecasts have been adjusted downward from the last quarter. In Maine, completion dates for most transmission studies have been delayed by several months. In Massachusetts, ongoing cluster studies indicate potentially prohibitive upgrade costs for many projects. These reductions are offset by increases in other markets, particularly in Illinois. The Illinois Energy Transition Act revives funding for the Adjustable Block Program, laying out a pathway for completing waitlisted projects. Overall, the outlook for community solar has been increased by 2% since last quarter.
If an ITC extension is passed as part of the BBB Act, community solar would see a small 3% uplift from 2022-2026 compared to the base case. Community solar relies heavily on state-level programs that typically permit a certain amount of capacity. In these markets with large project pipelines, an extended ITC will improve viability for projects that qualify for program capacity, but program expansions require state policy action. Over the long term, the enhanced economics offered by an extended ITC could motivate more states to add community solar programs.
3.4. Utility PV
Key figures
- 3.8 GWdc installed in Q3 2021
- 6.1 GWdc of new utility-scale solar contracts were signed in Q3
- More than 122 GWdc of utility-scale solar will be added between 2021 and 202
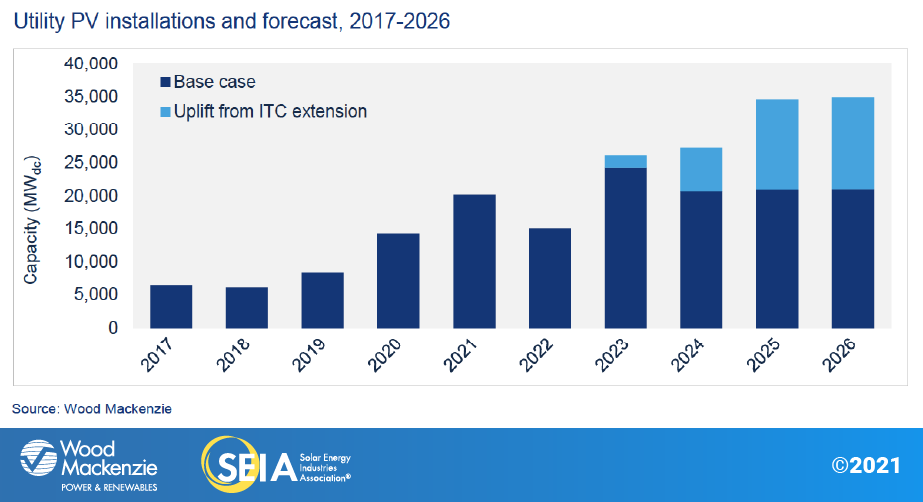
Momentum has continued in the utility solar sector, registering its largest third quarter on record, with 3.8 GWdc installed, despite the turmoil around supply chain constraints and rising equipment costs. During Q3, 6.1 GWdc of new contracts were signed, pushing the pipeline to 81 GWdc. There are currently 22.3 GWdc of projects under construction, with 7.5 GWdc slated to come online this year, bringing the total 2021 forecast to 20.2 GWdc – the most the industry has ever installed in a single year.
Even though there are a healthy number of projects in the pipeline, their completion remains at risk. Challenges related to high commodity prices and supply chain constraints are expected to hit full force throughout 2022 and early 2023. These challenges have added complexity to developers’ offtake negotiations and procurement strategies for 2022, resulting in a 7.5 GWdc (33%) decrease from the prior forecast. Additional constraints such as tax equity availability, labor shortages, interconnection limitations, and siting restrictions are increasing risks for utility solar projects over the next several years.
Despite current challenges, the resilience of the industry as well as increasing demand for clean energy will allow capacity additions to rebound by 2023. Utility-scale solar will continue growing in the double digits under the current policy environment. An extension of the ITC, combined with the option for solar projects to utilize the Production Tax Credit (PTC) and elect direct payment for the ITC, would present additional upside to the forecast, increasing capacity by nearly 36 GWdc through 2026.
4. U.S. solar PV forecasts
Base case forecasts
ITC extension forecasts
5. National solar PV system pricing
We employ a bottom-up modeling methodology to capture, track and report national average PV system pricing by segment for systems installed each quarter. Our methodology is based on the tracked wholesale pricing of major solar components and data collected from industry interviews. We report a weighted average of standard mono-PERC and high-efficiency modules for all market segments. Wood Mackenzie assumes all product is procured and delivered in the same year as the installation
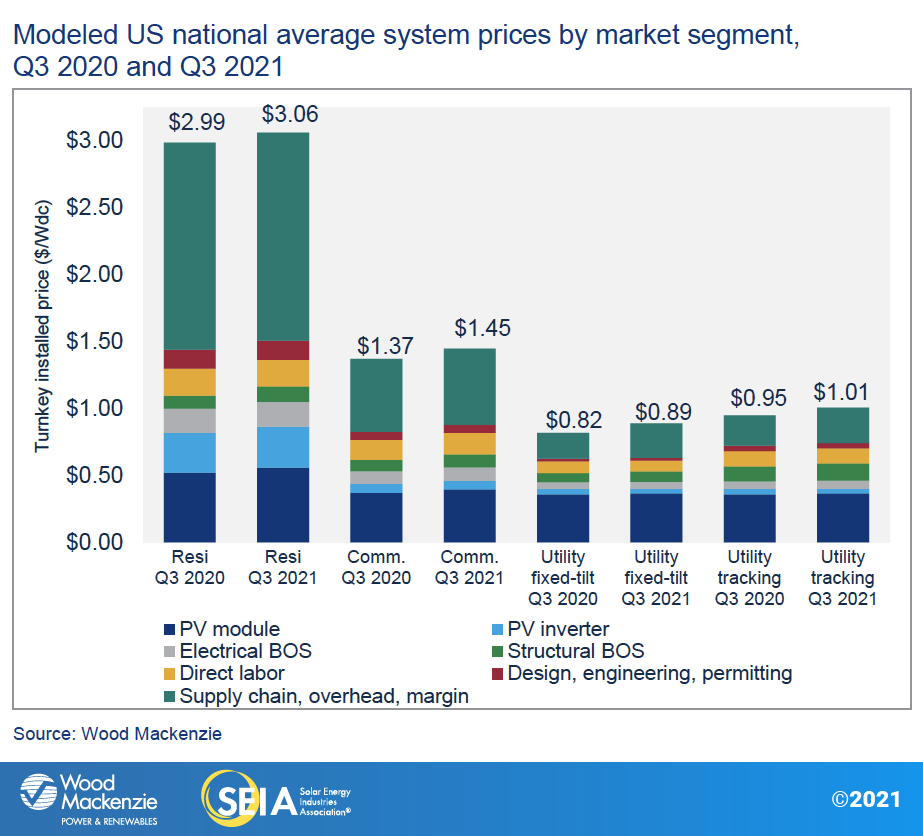
Continuing the trend from last quarter, system pricing increased both year-over-year and quarter-over-quarter across all market segments in Q3 2021. System pricing increased quarter-over-quarter by 1.0%, 3.2%, 3.0% and 0.8% in the residential, non-residential, utility fixed-tilt and utility single-axis tracking markets, respectively. In every segment besides residential, year-over-year price increases were at the highest they’ve been since 2014 when Wood Mackenzie began tracking pricing data. Average system prices mostly increased due to increased equipment costs, raw material input costs and freight costs. Prices for non-residential and utility fixed-tilt projects continue to rise as manufacturers continue to pass the cost of increased raw materials to the end user. The growth of the utility single-axis tracker market has led to increased adoption of bifacial modules as well as large format modules, which helps to offset other price increases through material efficiencies.
About the Report
U.S. solar market insight® is a quarterly publication of Wood Mackenzie and the Solar Energy Industries Association (SEIA)®. Each quarter, we collect granular data on the U.S. solar market from nearly 200 utilities, state agencies, installers and manufacturers. This data provides the backbone of this U.S. Solar Market Insight® report, in which we identify and analyze trends in U.S. solar demand, manufacturing and pricing by state and market segment over the next five to ten years. All forecasts are from Wood Mackenzie, Limited; SEIA does not predict future pricing, bid terms, costs, deployment or supply. The report includes all 50 states and Washington, D.C. National totals reported also include Puerto Rico and other U.S. territories. Detailed data and forecasts for 50 states and Washington, D.C. are contained within the full version of the report.
References and Contact
-
References, data, charts and analysis from this executive summary should be attributed to “Wood Mackenzie/SEIA U.S. solar market insight®.”
-
Media inquiries should be directed to Wood Mackenzie’s PR team ([email protected]) and Morgan Lyons ([email protected]) at SEIA.
-
All figures are sourced from Wood Mackenzie. For more detail on methodology and sources, click here.
About the Authors
Wood Mackenzie Power & Renewables | U.S. Research Team
Michelle Davis, Principal Analyst (lead author)
Bryan White, Solar Analyst
Rachel Goldstein, Solar Analyst
Sylvia Leyba Martinez, Senior Analyst
Sagar Chopra, Solar Analyst
Kelsey Gross, Solar Analyst
Matthew Sahd, Research Associate
Xiaojing Sun, Head of Global Solar
Solar Energy Industries Association | SEIA
Shawn Rumery, Director of Research
Colin Silver, Chief of Staff and Chief Content Officer
Justin Baca, Vice President of Markets & Research
Note on U.S. solar market insight report title: The report title is based on the quarter in which the report is released, not the most recent quarter of installation figures.
License
Ownership rights
This report ("Report") and all Solar Market Insight® ("SMI")TM reports are jointly owned by Wood Mackenzie and the Solar Energy Industries Association (SEIA)®(jointly, "Owners") and are protected by United States copyright and trademark laws and international copyright/intellectual property laws under applicable treaties and/or conventions. Purchaser of Report or other person obtaining a copy legally ("User") agrees not to export Report into a country that does not have copyright/intellectual property laws that will protect rights of Owners therein.
Grant of license rights
Owners hereby grant user a non-exclusive, non-refundable, non-transferable Enterprise License, which allows you to (i) distribute the report within your organization across multiple locations to its representatives, employees or agents who are authorized by the organization to view the report in support of the organization’s internal business purposes, and (ii) display the report within your organization’s privately hosted internal intranet in support of your organization’s internal business purposes. Your right to distribute the report under an Enterprise License allows distribution among multiple locations or facilities to Authorized Users within your organization.
Owners retain exclusive and sole ownership of this report. User agrees not to permit any unauthorized use, reproduction, distribution, publication or electronic transmission of any report or the information/forecasts therein without the express written permission of Owners.
Disclaimer of warranty and liability
Owners have used their best efforts in collecting and preparing each report.
Owners, their employees, affiliates, agents, and licensors do not warrant the accuracy, completeness, correctness, non-infringement, merchantability, or fitness for a particular purpose of any reports covered by this agreement. Owners, their employees, affiliates, agents, or licensors shall not be liable to user or any third party for losses or injury caused in whole or part by our negligence or contingencies beyond Owners’ control in compiling, preparing or disseminating any report or for any decision made or action taken by user or any third party in reliance on such information or for any consequential, special, indirect or similar damages, even if Owners were advised of the possibility of the same. User agrees that the liability of Owners, their employees, affiliates, agents and licensors, if any, arising out of any kind of legal claim (whether in contract, tort or otherwise) in connection with its goods/services under this agreement shall not exceed the amount you paid to Owners for use of the report in question.
