
The quarterly SEIA/Wood Mackenzie Power & Renewables U.S. Solar Market Insight report shows the major trends in the U.S. solar industry. Learn more about the U.S. Solar Market Insight Report. Released March 9, 2023.
1. Key Figures
- In 2022, the US solar market installed 20.2 GWdc of capacity, a 16% decrease from 2021. The uncertainty surrounding the anticircumvention investigation and numerous solar equipment detentions by Customs and Border Protection (CBP) constrained industry growth.
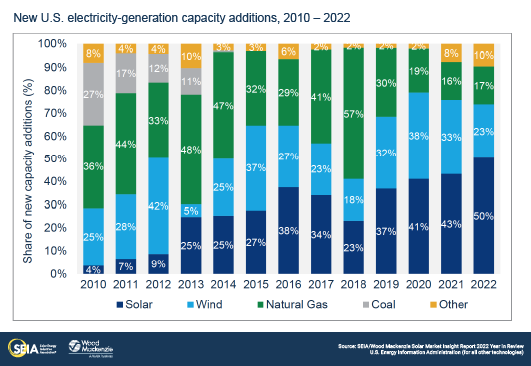
- Solar accounted for 50% of all new electricity-generating capacity added to the US grid in 2022, the fourth consecutive year that solar was the top technology for new additions.
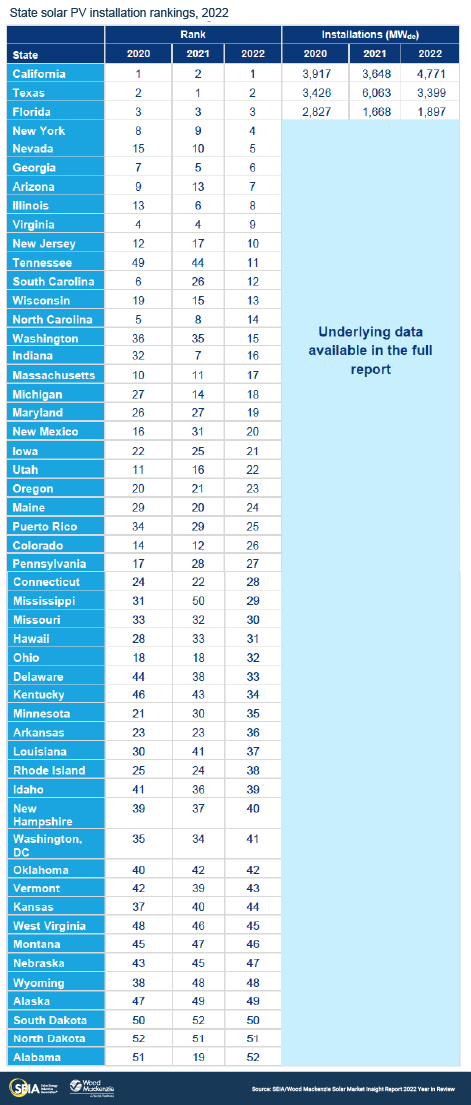
- California was once again the top-ranked solar market in 2022. – Texas had briefly held the position in 2021. California’s annual residential solar installations have doubled to over 2 GWdc since 2020. However, recent changes to residential solar compensation are likely to cut the market by nearly 40% by 2024.
- Nationwide, the residential segment installed just shy of 6 GWdc in 2022, growing by a staggering 40% over 2021. A record 700,000 homeowners installed solar in 2022.
- The commercial solar segment installed 1.4 GWdc, shrinking 6% compared to 2021. The community solar segment installed 1 GWdc, 16% less than in 2021. Project delays from 2022 are expected to prop up installation volumes in 2023 in both segments.
- The utility-scale segment was most heavily impacted by uncertainty from the anticircumvention investigation and solar module detainments caused by CBP’s Withhold Release Order (WRO) and enforcement of the Uyghur Forced Labor Prevention Act (UFLPA). Installations came in at 11.8 GWdc for the year, 31% below 2021 and the segment’s lowest total since 2019.
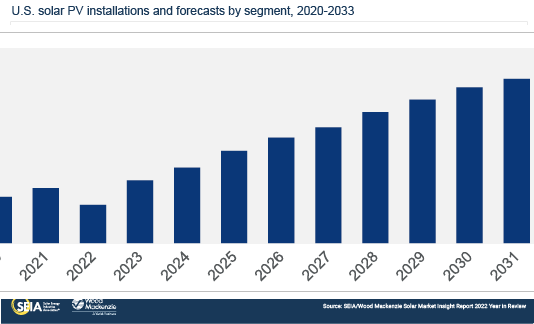
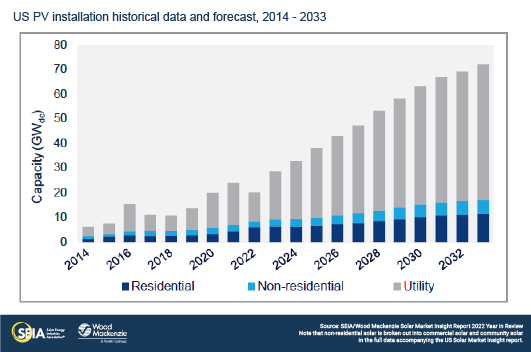
- For this Year in Review report, Wood Mackenzie has included 10-year outlooks for each market segment. The total installed US solar fleet is expected to grow five times larger than it is today, from 141 GWdc at the end of 2022 to more than 700 GWdc by 2033. This growth is due in large part to the long-term policy certainty created by the IRA.
- Wood Mackenzie has also included two alternative forecast scenarios in this report for the first time – a Bull case and a Bear case. These scenarios consider different outcomes related to supply chain dynamics, tax credit qualification, labor availability, and retail rate price trends. More details and data can be found in the full report.
2. Introduction
The US solar industry installed 20.2 gigawatts-direct current (GWdc) of capacity in 2022, a 16% decrease from 2021. Between the anticircumvention investigation, equipment detainments by Customs and Border Protection (CBP), and passage of the historic Inflation Reduction Act (IRA), it was one of the most tumultuous years in the industry’s history.
Throughout the year, commercial, community, and utility-scale solar were all down compared to 2021. The utility-scale segment had its best quarter of 2022 in Q4, installing 4.3 GWdc. But this was still the segment’s lowest fourth quarter since 2018. Utility-scale volumes were down 31% for the year – the last time utility solar shrank that much was in 2017, when the industry had been expecting the expiration of the investment tax credit (ITC).
Counter to the other segments, the residential segment grew 40% over 2021, the highest level of annual growth since 2015. Residential solar has been more insulated from the impacts of trade issues since half the segment utilizes domestically-sourced modules. As of year-end 2022, 6% of single-family owner-occupied homes have solar installed.
Overall, solar PV accounted for 50% of all new electricity-generating capacity additions in 2022, the fourth consecutive year that solar was the top technology for new additions.
The solar industry hopes for supply chain relief in 2023
After another year of trade policy turmoil, the US solar industry is hoping for supply chain relief in 2023. Our expectations for the industry shifted throughout the year as the anticircumvention investigation was initiated in March, President Biden paused potential anticircumvention tariffs in June, and the Uyghur Forced Labor Prevention Act (UFLPA) resulted in hundreds of equipment detentions in the second half of the year. Between all of this and the historic passage of the Inflation Reduction Act (IRA) in August, 2022 was one of the most volatile policy years in industry history.
We expect a robust return to growth in 2023. While there is still uncertainty around the CBP’s requirements to release detained equipment under the UFLPA, some manufacturers have had small releases in the last several months. (For more details and context on this issue, see the US Solar Market Insight Q4 2022 report.) It will likely take several more months, and the timing is far from certain, but we expect shipments to accelerate in the second half of the year. This will help 2023 installations grow 41% over 2022 to 28.4 GWdc, assuming no further disruptions.
Alternative scenarios help to benchmark current market uncertainty
In addition to current supply chain constraints, the US solar industry faces several near-term uncertainties. To help characterize the potential impacts of those uncertainties, Wood Mackenzie has created two alternative forecast scenarios for the first time. These two scenarios – a Bull case and a Bear case to accompany our standard Base case – will help the industry benchmark industry impacts based on various outcomes (see table below for more details).
First, our alternative scenarios consider various outcomes related to the future supply/demand balance of PV modules. This will be heavily impacted by new anticircumvention tariffs that could go into effect by June 2024, pending a final decision by the Department of Commerce. These new tariffs could apply to some suppliers shipping cells and modules from the four Southeast Asian countries named in the investigation – the region where the US solar industry currently sources most of its PV module imports. The industry is already working to diversify supply chains, but new tariffs will create immense pressure to procure non-tariffed supply.
The availability of domestically-produced equipment will also impact this supply/demand balance. Our Bull case generally assumes more availability of non-tariffed supply as well as a more optimistic view on how much, and how quickly, domestic manufacturing capacity comes online and supplies the US market. The Bear case assumes a less favorable supply environment.
Second, the alternative scenarios consider various outcomes related to the anticipated guidance from the US Department of Treasury on qualifying for tax credits and associated adders. Some Treasury guidance has already been published (on prevailing wage and apprenticeship requirements, as well as the low-income communities bonus credit program). But given that much more guidance is yet to be published, it’s too early to tell how the various adders will impact solar installations. Our Bull case considers more favorable guidance where a higher proportion of projects can utilize the adders. The Bear case generally assumes the opposite.
Lastly, there are several other factors incorporated into our alternative scenarios, some of which are sector specific. For utility-scale solar, labor availability and tax equity availability are considered across the scenarios as important factors for that segment’s growth. For distributed solar, trends in retail rates that impact project economics vary between the scenarios. More details on the assumptions for each segment can be found within the full report.
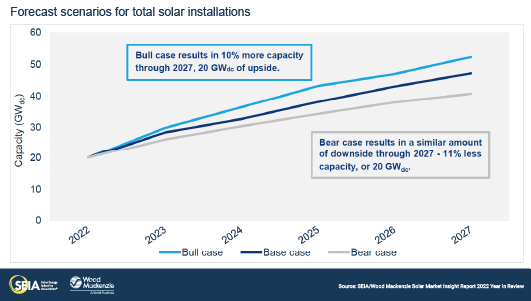
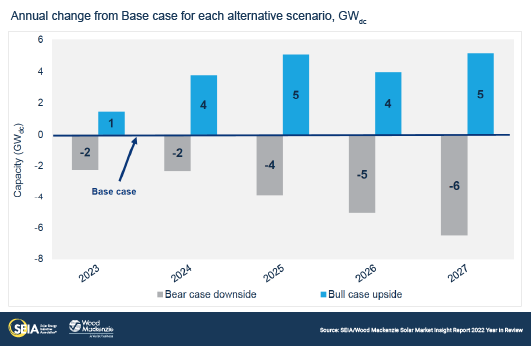
Our Bull case puts cumulative US solar installations 10% higher than our Base case and our Bear case puts cumulative installations 11% lower through 2027 – about 20 GWdc in either direction. Put another way, depending on what assumptions become reality, there is roughly 20 GWdc of upside or downside risk for the US solar industry over the next five years.
US solar industry to multiply by five times over the next decade
Looking longer-term, our Base case outlook puts cumulative solar installations by 2033 at over 700 GWdc, compared to 141 GWdc installed as of year-end 2022. In other words, the total base of installed solar will be five times larger in 2033 than it is today. Growth is faster in the near-term, averaging 19% until 2027 before slowing to an average annual growth rate of 7% from 2028-2033. Growth slows as market penetration increases and grid capacity becomes more limited. Eventually growing to a 60-70 GWdc annual market toward the end of the outlook, the US solar industry is clearly a key pillar of the energy transition.
3. Market segment outlooks
3.1. Residential PV
- 5.9 GWdc and nearly 700,000 systems installed in 2022, 1,687 MWdc in Q4 2022
- Up 40% from 2021
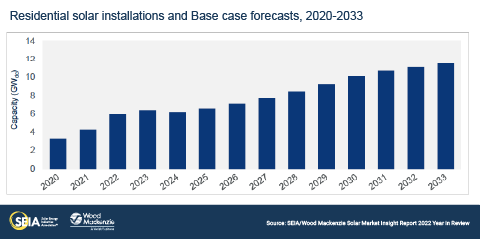
Last year was a record-breaking but chaotic year for the residential solar industry. While supply chain constraints consumed the first half of the year, recovery from module shortages, rising interest rates, and excitement for the IRA characterized the second half. The residential segment installed 1,687 MWdc in Q4 to reach 5.9 GWdc of annual installed capacity, a remarkable 40% increase over 2021. Last year also marked the first year the segment exceeded 5 GWdc of annual installations.
Installers continued to work through backlogs in Q4, contributing to strong installation numbers to end the year. But the fourth quarter challenged installers’ sales activity, with many seeing a more pronounced seasonal drop in sales compared to past years. This can be partially attributed to customer expectations of a recession and a lower urgency to go solar due to the ITC extension. Shifts in financial product offerings and price increases are also slowing residential growth.
Wood Mackenzie forecasts 7% growth for the residential solar market in 2023, as demand pull-in continues in California before NEM 3.0 takes effect on April 14th. After a robust 2022 for California, the subsequent drop in installations will lead to minimal growth in 2023 and a contraction of 38% in 2024 for the state, resulting in a 3% reduction in installations nationwide. In the long term, the residential segment will grow steadily as it feels the full impacts from the IRA and third-party-owned projects qualify for the adders. The residential solar market will quadruple in size over the next decade, adding 95 GWdc of installed capacity between 2023 and 2033.
3.2. Commercial PV
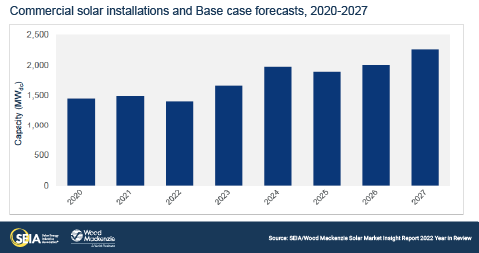
- 1,402 MWdc installed in 2022, 354 MWdc in Q4 2022
- Down 6% from 2021
Note on market segmentation: Commercial solar encompasses distributed solar projects with commercial, industrial, agricultural, school, government or nonprofit offtakers, including remotely net-metered projects. This excludes community solar (covered in the following section).
Commercial solar volumes in 2022 came in 6% below 2021 volumes – in line with our expectations from the prior report. The year was riddled with project delays due to supply chain constraints. As a result, we expect 2023 installations to grow by 19%. This is driven by a combination of delayed projects coming online as well as the beginning of a two-year installation rush in California before new net metering rules take effect.
The commercial solar industry continues to be highly concentrated. In 2022, 62% of capacity was installed in the top four markets: California, Illinois, New Jersey, and New York. And this hasn’t changed much in the last few years, demonstrating the reliance of commercial solar markets on state-level incentive programs. We do expect commercial solar markets to diversify over the course of our outlook, but these states will continue to be the most important markets for this sector.
The most significant change in our outlook since last quarter comes from the inclusion of the ITC adders. Improved economics for commercial solar projects, whether through additional federal tax credits or state-level incentive programs, have a significant impact on the sector’s potential. Taking these factors into account, average annual growth for our commercial solar outlook has increased to 10% from 7% last quarter.
3.3. Community solar PV
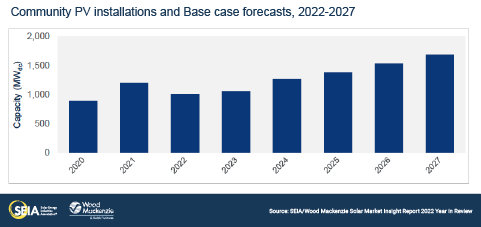
- 1,014 MWdc installed in 2022, 284 MWdc installed in Q4 2022
- Down 16% from 2021
Note on market segmentation: Community solar projects are part of formal programs where multiple customers can subscribe to the power produced by a local solar project and receive credits on their utility bills.
Community solar installations declined 16% in 2022 compared to 2021, primarily driven by continued interconnection queue delays in key state markets, as well as industry-wide supply chain constraints pushing project timelines into 2023. Despite this market contraction, 2022 was the second consecutive year the national community solar market broke 1 GWdc of new installations. New York, which installed a record-breaking 532 MWdc in 2022, made up 52% of the national market.
By 2027, we expect the community solar market to more than double, growing by an average of 11% annually from 2023-2027. The two main drivers for growth are newly established state markets and the potential of the ITC adders. Newer state markets like Virginia, New Mexico and Delaware will begin to see projects come online in 2023 and have strong capacity pipelines. Additionally, community solar legislation recently signed in California could support nearly 1 GWdc of new capacity between 2024 and 2027, pending the establishment of full program rules.
Community solar developers are well positioned to take advantage of the ITC adders, boosting our five-year outlook. Developers are particularly interested in qualifying projects for the low-income, domestic content, and energy communities adders. These adders – and other incentives like the greenhouse gas reduction fund – will support growth in existing and emerging markets. Additionally, the IRA could positively impact program proposals and the creation of new markets, which we continue to monitor closely.
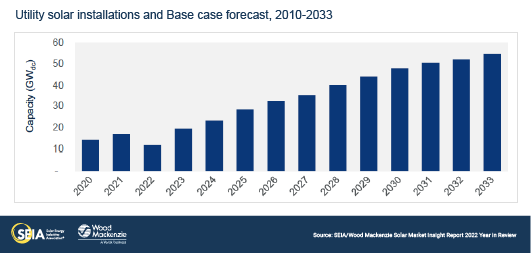
3.4. Utility PV
- 11.8 GWdc installed in 2022, 4.3 GWdc installed in Q4 2022
- More than 428 GWdc of utility-scale solar will be added over the next 10 years in our Base Case
The trend of utility-scale solar growth came to a halt in 2022. The sector grew 67% quarter-over-quarter in Q4 2022, but 2022 installations decreased by 32% compared to 2021 with 11.8 GWdc installed for the year. This contraction can be attributed almost entirely to supply chain challenges and trade disruptions.
The IRA provided the certainty needed to regain momentum in project development and contract negotiations in late 2022. More than 4.5 GWdc of projects were contracted during Q4, leaving the project pipeline at 90.3 GWdc. While this represents 12% pipeline growth over 2021, short-term uncertainty remains due to continued supply chain challenges.
Tier 1 manufacturers remain confident in their ability to achieve major module shipment releases during the first half of the year. Smaller utility-scale buyers that procure Tier 2 modules may now face challenges as CBP reviews smaller orders and smaller manufacturers with higher scrutiny than in 2022. The Executive Order delaying anticircumvention tariffs allowed buyers to diversify their supply without compromising 2023 and 2024 buildout plans. Still, module supply will remain limited in the short term as Tier 1 suppliers in Southeast Asia are fully booked through 2023.
Despite the complex procurement environment, Wood Mackenzie forecasts that 139 GWdc of total utility-scale installations will be added between 2023 and 2027, and 429 GWdc will be added over the next decade in our Base case. Interest in the segment will remain strong throughout the forecast period, as corporate and utility procurement soar. The different buildout levels presented in the alternative scenarios are mainly driven by labor availability, interconnection reforms, and tax equity availability.
4. US solar PV forecasts
5. National solar PV system pricing
Note: Wood Mackenzie has updated the reporting methodology for modeled prices to be consistent with the US solar system pricing reports. Therefore, figures shown below may not match those published in earlier editions of the US Solar Market Insight report.
Wood Mackenzie employs a bottom-up modeling methodology to capture, track and report national average PV system pricing by segment for systems installed each quarter. The methodology is based on the tracked wholesale pricing of major solar components and data collected from industry interviews. Wood Mackenzie assumes all product is procured and delivered in the same year as the installation except modules for the utility segment, which are procured one year prior to commercial operation.
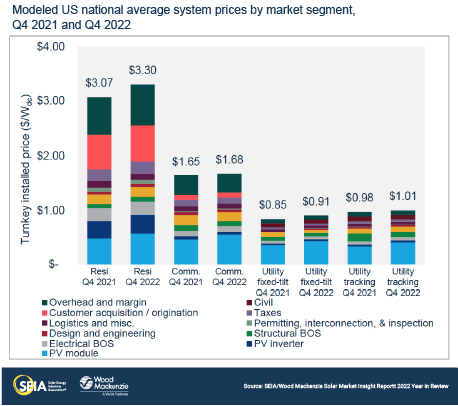
Last year was a challenging year for solar. We saw price increases across equipment and soft cost categories. High demand, supply constraints, rising inflation, and a harsh policy environment (primarily impacting module and inverter prices) all contributed to rising capex for solar in 2022. In the fourth quarter, system pricing was up by 7% for the residential segment and 2% for the commercial segment compared to Q4 2021. Increases in capex for the utility segment were partially offset by the adoption of large format modules in 2022. System pricing for utility-scale fixed-tilt was up 5% and 3% for tracker systems compared to last year.
About the Report
U.S. solar market insight® is a quarterly publication of Wood Mackenzie and the Solar Energy Industries Association (SEIA)®. Each quarter, we collect granular data on the U.S. solar market from nearly 200 utilities, state agencies, installers and manufacturers. This data provides the backbone of this U.S. Solar Market Insight® report, in which we identify and analyze trends in U.S. solar demand, manufacturing and pricing by state and market segment over the next five to ten years. All forecasts are from Wood Mackenzie, Limited; SEIA does not predict future pricing, bid terms, costs, deployment or supply. The report includes all 50 states and Washington, D.C. National totals reported also include Puerto Rico and other U.S. territories. Detailed data and forecasts for 50 states and Washington, D.C. are contained within the full version of the report.
References and Contact
- References, data, charts and analysis from this executive summary should be attributed to “Wood Mackenzie/SEIA U.S. solar market insight®.”
- Media inquiries should be directed to Wood Mackenzie’s PR team ([email protected]) and Morgan Lyons ([email protected]) at SEIA.
- All figures are sourced from Wood Mackenzie. For more detail on methodology and sources, click here.
About the Authors
Wood Mackenzie Power & Renewables | U.S. Research Team
Michelle Davis, Principal Analyst (lead author)
Sylvia Leyba Martinez, Senior Analyst
Zoe Gaston, Principal Analyst
Sagar Chopra, Solar Analyst
Caitlin Connelly, Research Associate
Matthew Sahd, Research Associate
Matt Issokson, Research Analyst
Elissa Pierce, Research Associate
Chris Seiple, Senior Vice President
Solar Energy Industries Association | SEIA
Shawn Rumery, Senior Director of Research
Colin Silver, Chief of Staff and Chief Content Officer
Tyler Thompson, Research Analyst
Justin Baca, Vice President of Markets & Research
Note on U.S. solar market insight report title: The report title is based on the quarter in which the report is released, not the most recent quarter of installation figures.
License
Ownership rights
This report (“Report”) and all Solar Market Insight® (“SMI”)TM reports are jointly owned by Wood Mackenzie and the Solar Energy Industries Association (SEIA)®(jointly, “Owners”) and are protected by United States copyright and trademark laws and international copyright/intellectual property laws under applicable treaties and/or conventions. Purchaser of Report or other person obtaining a copy legally (“User”) agrees not to export Report into a country that does not have copyright/intellectual property laws that will protect rights of Owners therein.
Grant of license rights
Owners hereby grant user a non-exclusive, non-refundable, non-transferable Enterprise License, which allows you to (i) distribute the report within your organization across multiple locations to its representatives, employees or agents who are authorized by the organization to view the report in support of the organization’s internal business purposes, and (ii) display the report within your organization’s privately hosted internal intranet in support of your organization’s internal business purposes. Your right to distribute the report under an Enterprise License allows distribution among multiple locations or facilities to Authorized Users within your organization.
Owners retain exclusive and sole ownership of this report. User agrees not to permit any unauthorized use, reproduction, distribution, publication or electronic transmission of any report or the information/forecasts therein without the express written permission of Owners.
Disclaimer of warranty and liability
Owners have used their best efforts in collecting and preparing each report.
Owners, their employees, affiliates, agents, and licensors do not warrant the accuracy, completeness, correctness, non-infringement, merchantability, or fitness for a particular purpose of any reports covered by this agreement. Owners, their employees, affiliates, agents, or licensors shall not be liable to user or any third party for losses or injury caused in whole or part by our negligence or contingencies beyond Owners’ control in compiling, preparing or disseminating any report or for any decision made or action taken by user or any third party in reliance on such information or for any consequential, special, indirect or similar damages, even if Owners were advised of the possibility of the same. User agrees that the liability of Owners, their employees, affiliates, agents and licensors, if any, arising out of any kind of legal claim (whether in contract, tort or otherwise) in connection with its goods/services under this agreement shall not exceed the amount you paid to Owners for use of the report in question.

