
Solar Market Insight Report Q2 2023

The quarterly SEIA/Wood Mackenzie Power & Renewables U.S. Solar Market Insight report shows the major trends in the U.S. solar industry. Learn more about the U.S. Solar Market Insight Report. Released June 8, 2023.
1. Key figures
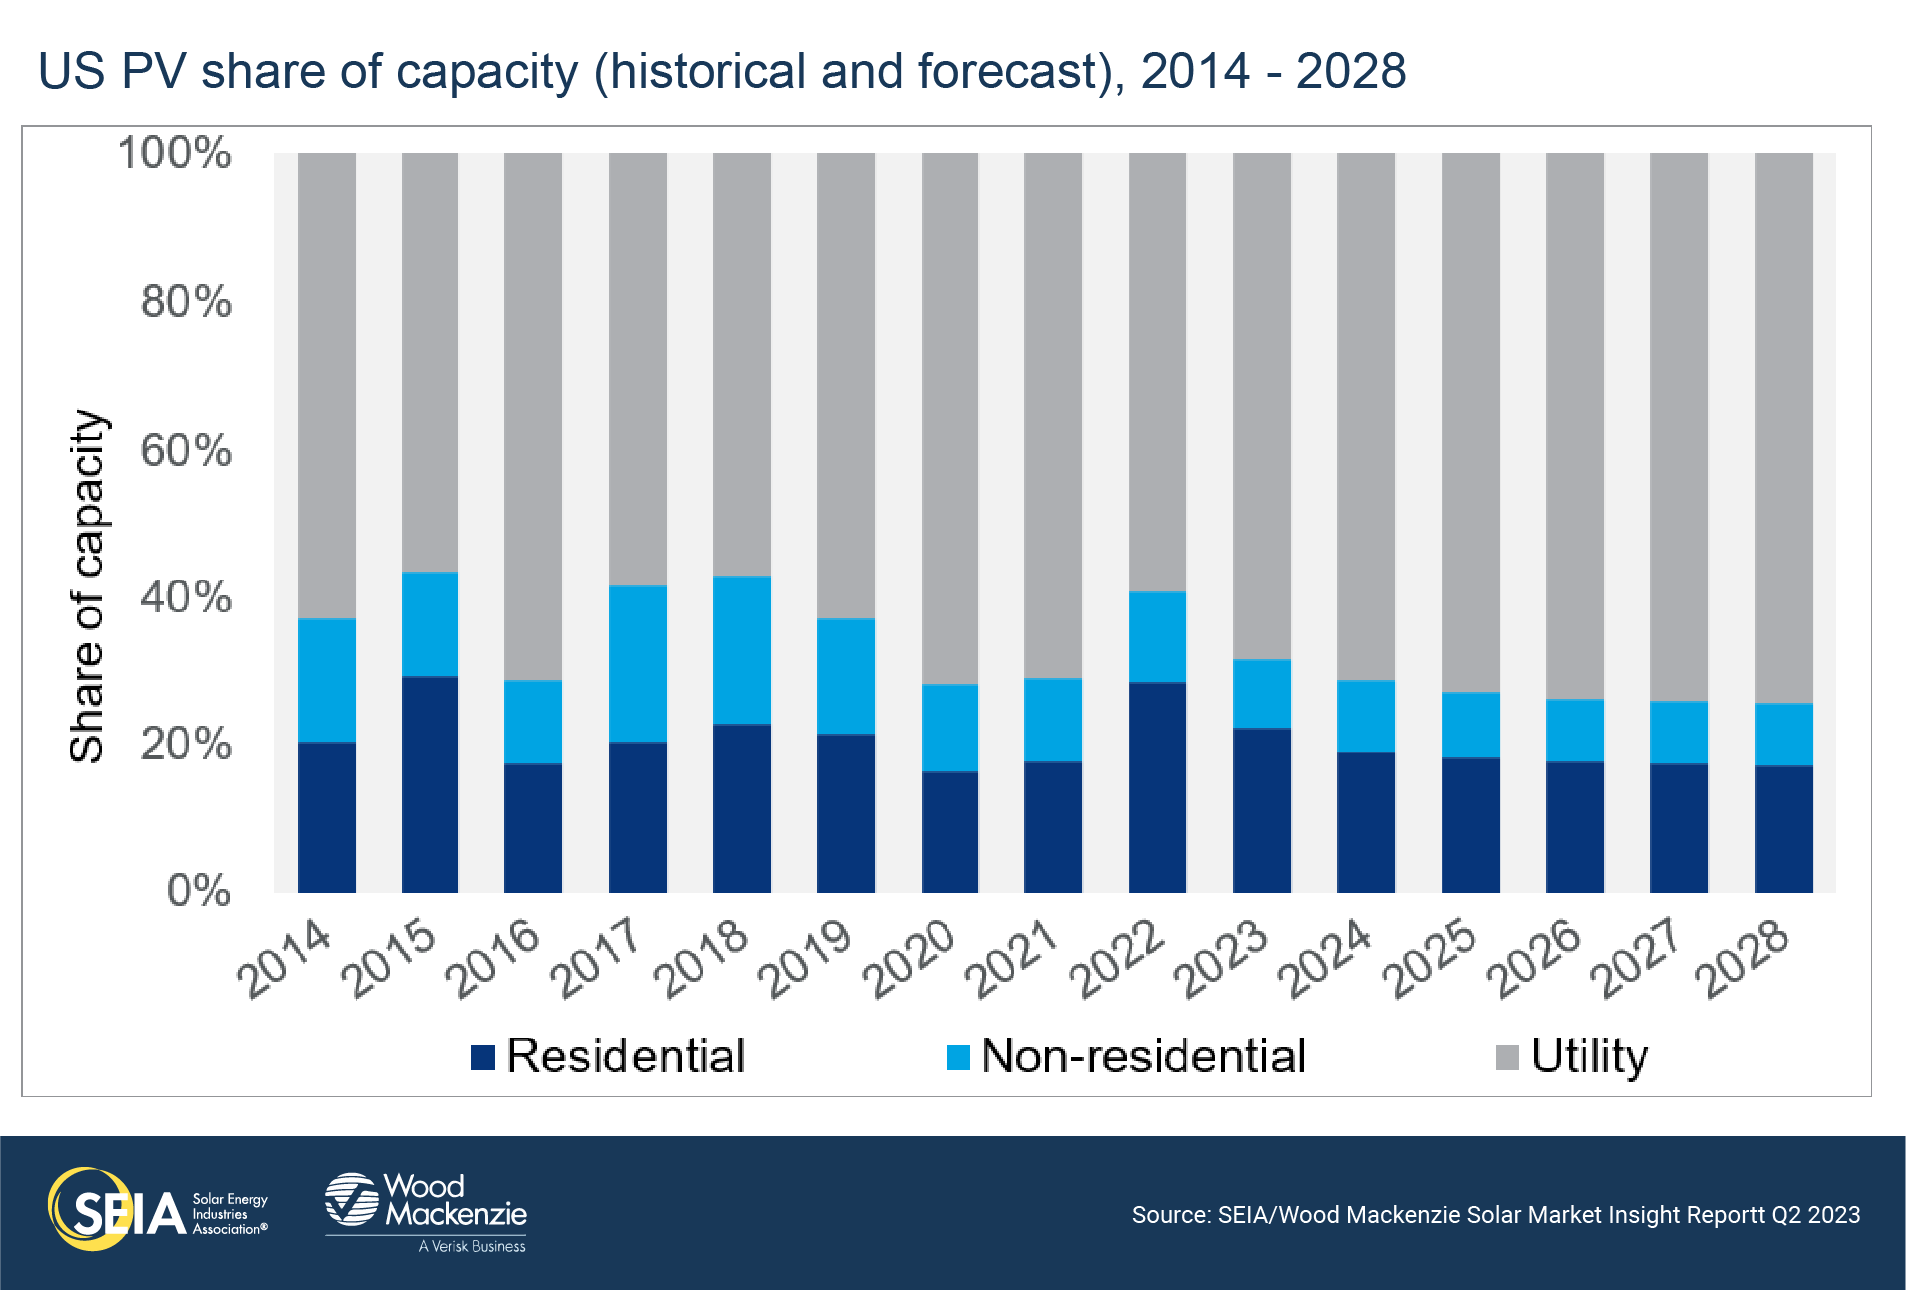
- In Q1 2023, the US solar market installed 6.1 GWdc of capacity, a 47% increase from Q1 2022 and a 19% decrease from Q4 2022. This was the best first quarter in industry history, led by delayed utility-scale solar projects coming online.
- Solar accounted for 54% of all new electricity-generating capacity added to the US grid in the first quarter of 2023.
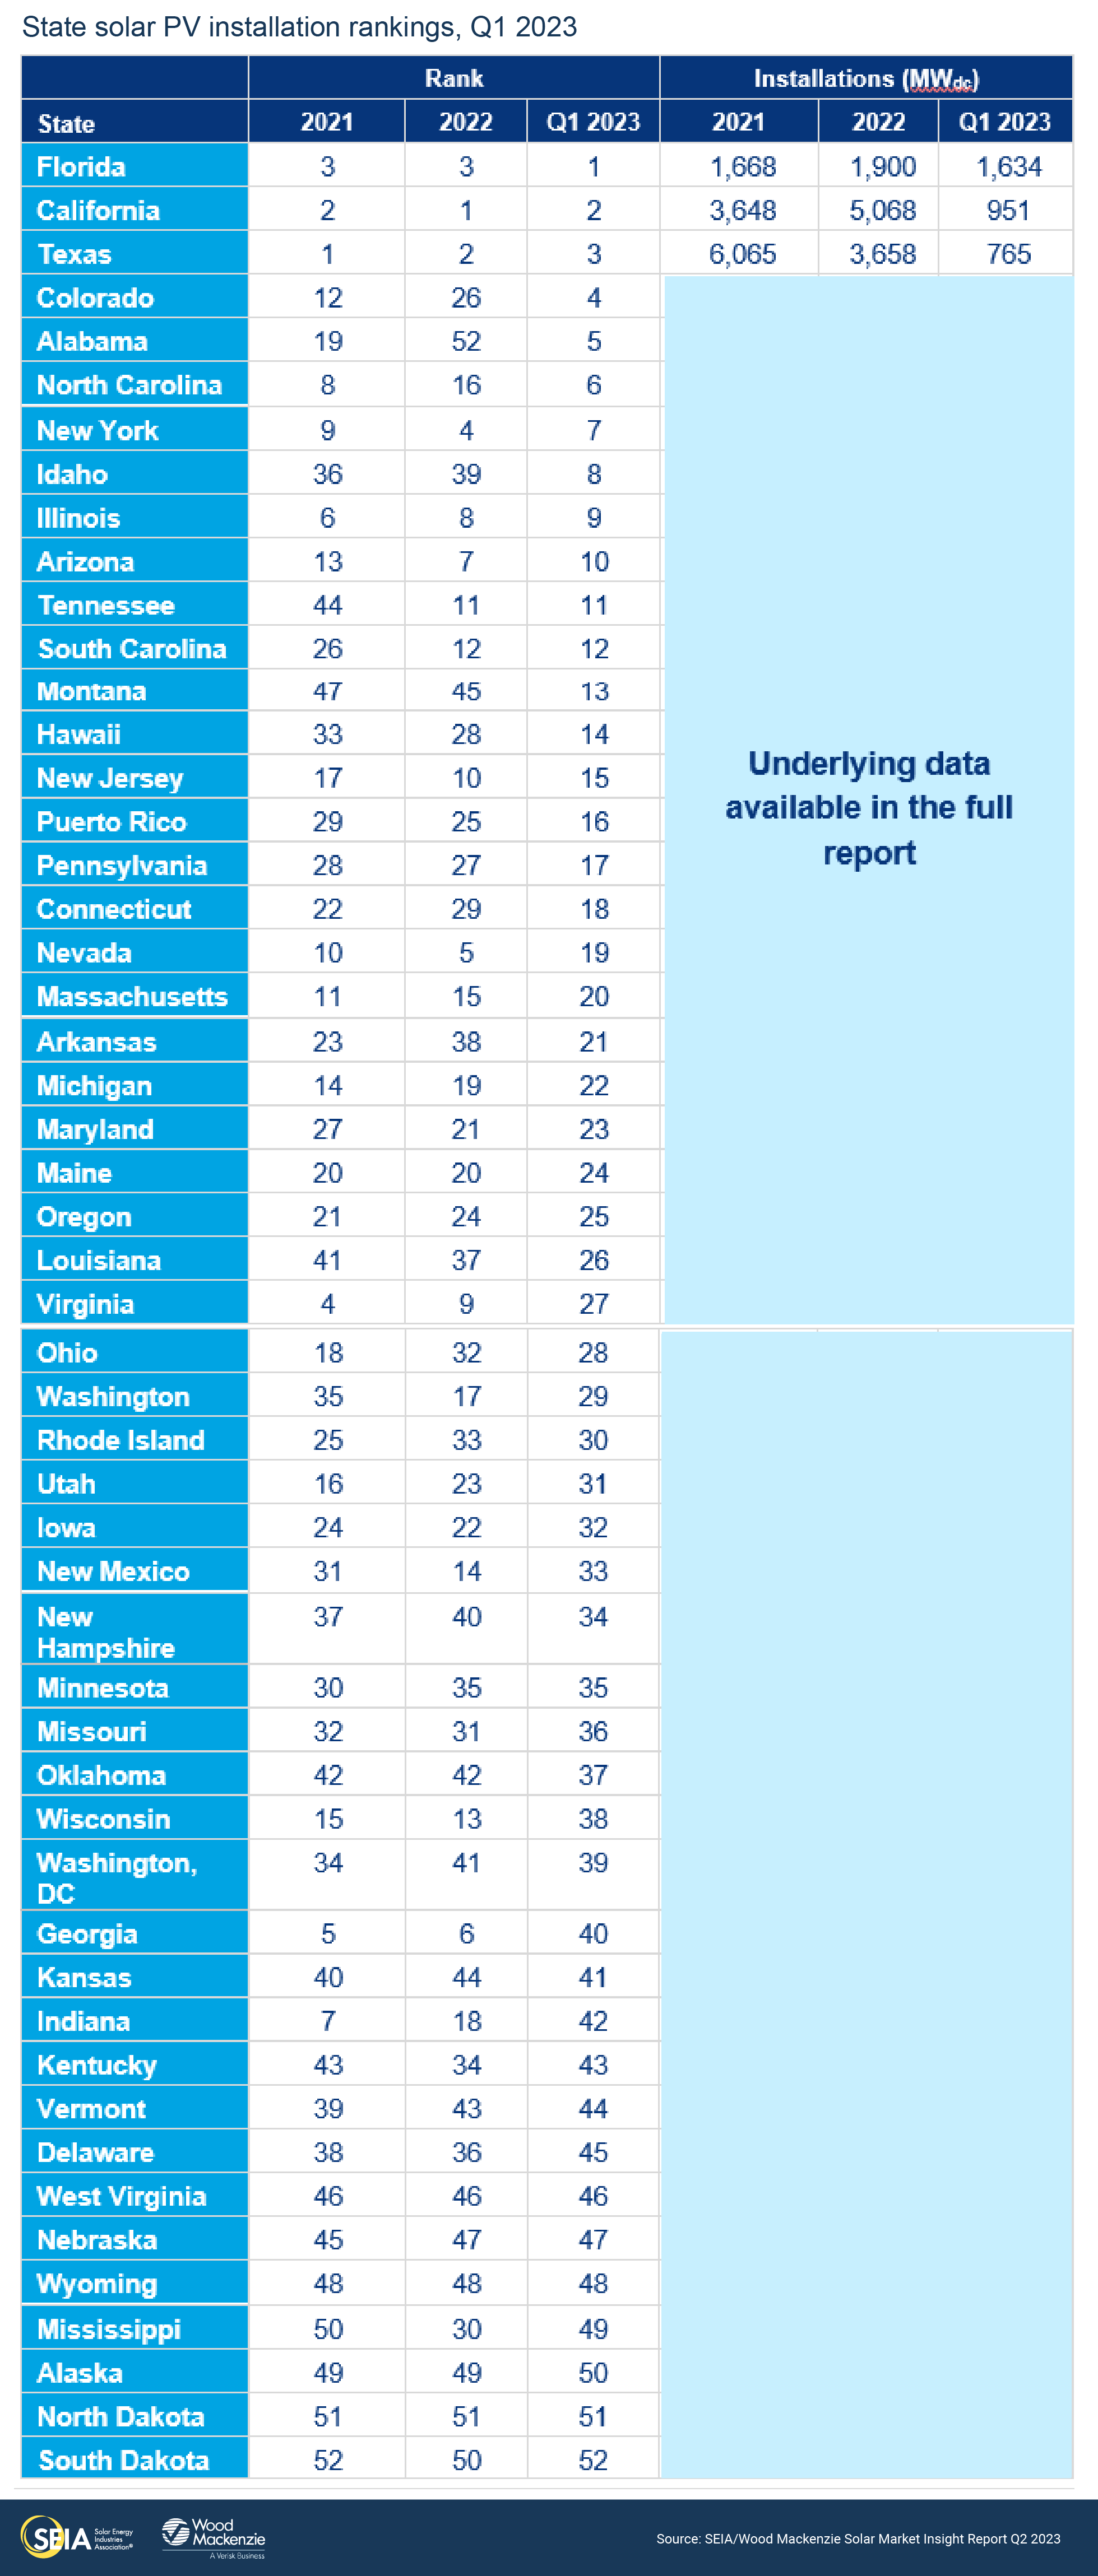
- Florida was the top-ranked solar market in Q1 2023 as 1,460 MWdc of utility-scale solar were installed. With a quarterly total of 1,634 MWdc, the state installed 72% more solar than the second-ranked state (California).
- The residential segment installed 1.6 GWdc in Q1 2023, a 30% increase from Q1 2022 and a 3% decrease from Q4 2022. California installed 466 MWdc of residential solar, compared to 580 MWdc in Q4 2022. The industry expected high installation volumes prior to the official start of NEM 3.0 in mid-April, but heavy storms limited installation activity.
- The commercial solar segment installed 391 MWdc, growing 27% compared to Q1 2022, and shrinking 19% compared to Q4 2022.
- The community solar segment installed 212 MWdc, 13% less than in Q1 2022 and 45% less than Q4 2022. Volumes declined in several Northeast states compared to Q4 2022.
- The utility-scale segment had its best first quarter ever with 3.8 GWdc installed, representing 66% growth from Q1 2022 and a 23% decrease from Q4 2022. Supply chain constraints are still present, but many delayed projects came online in Q1 as module shipments make their way to project sites.
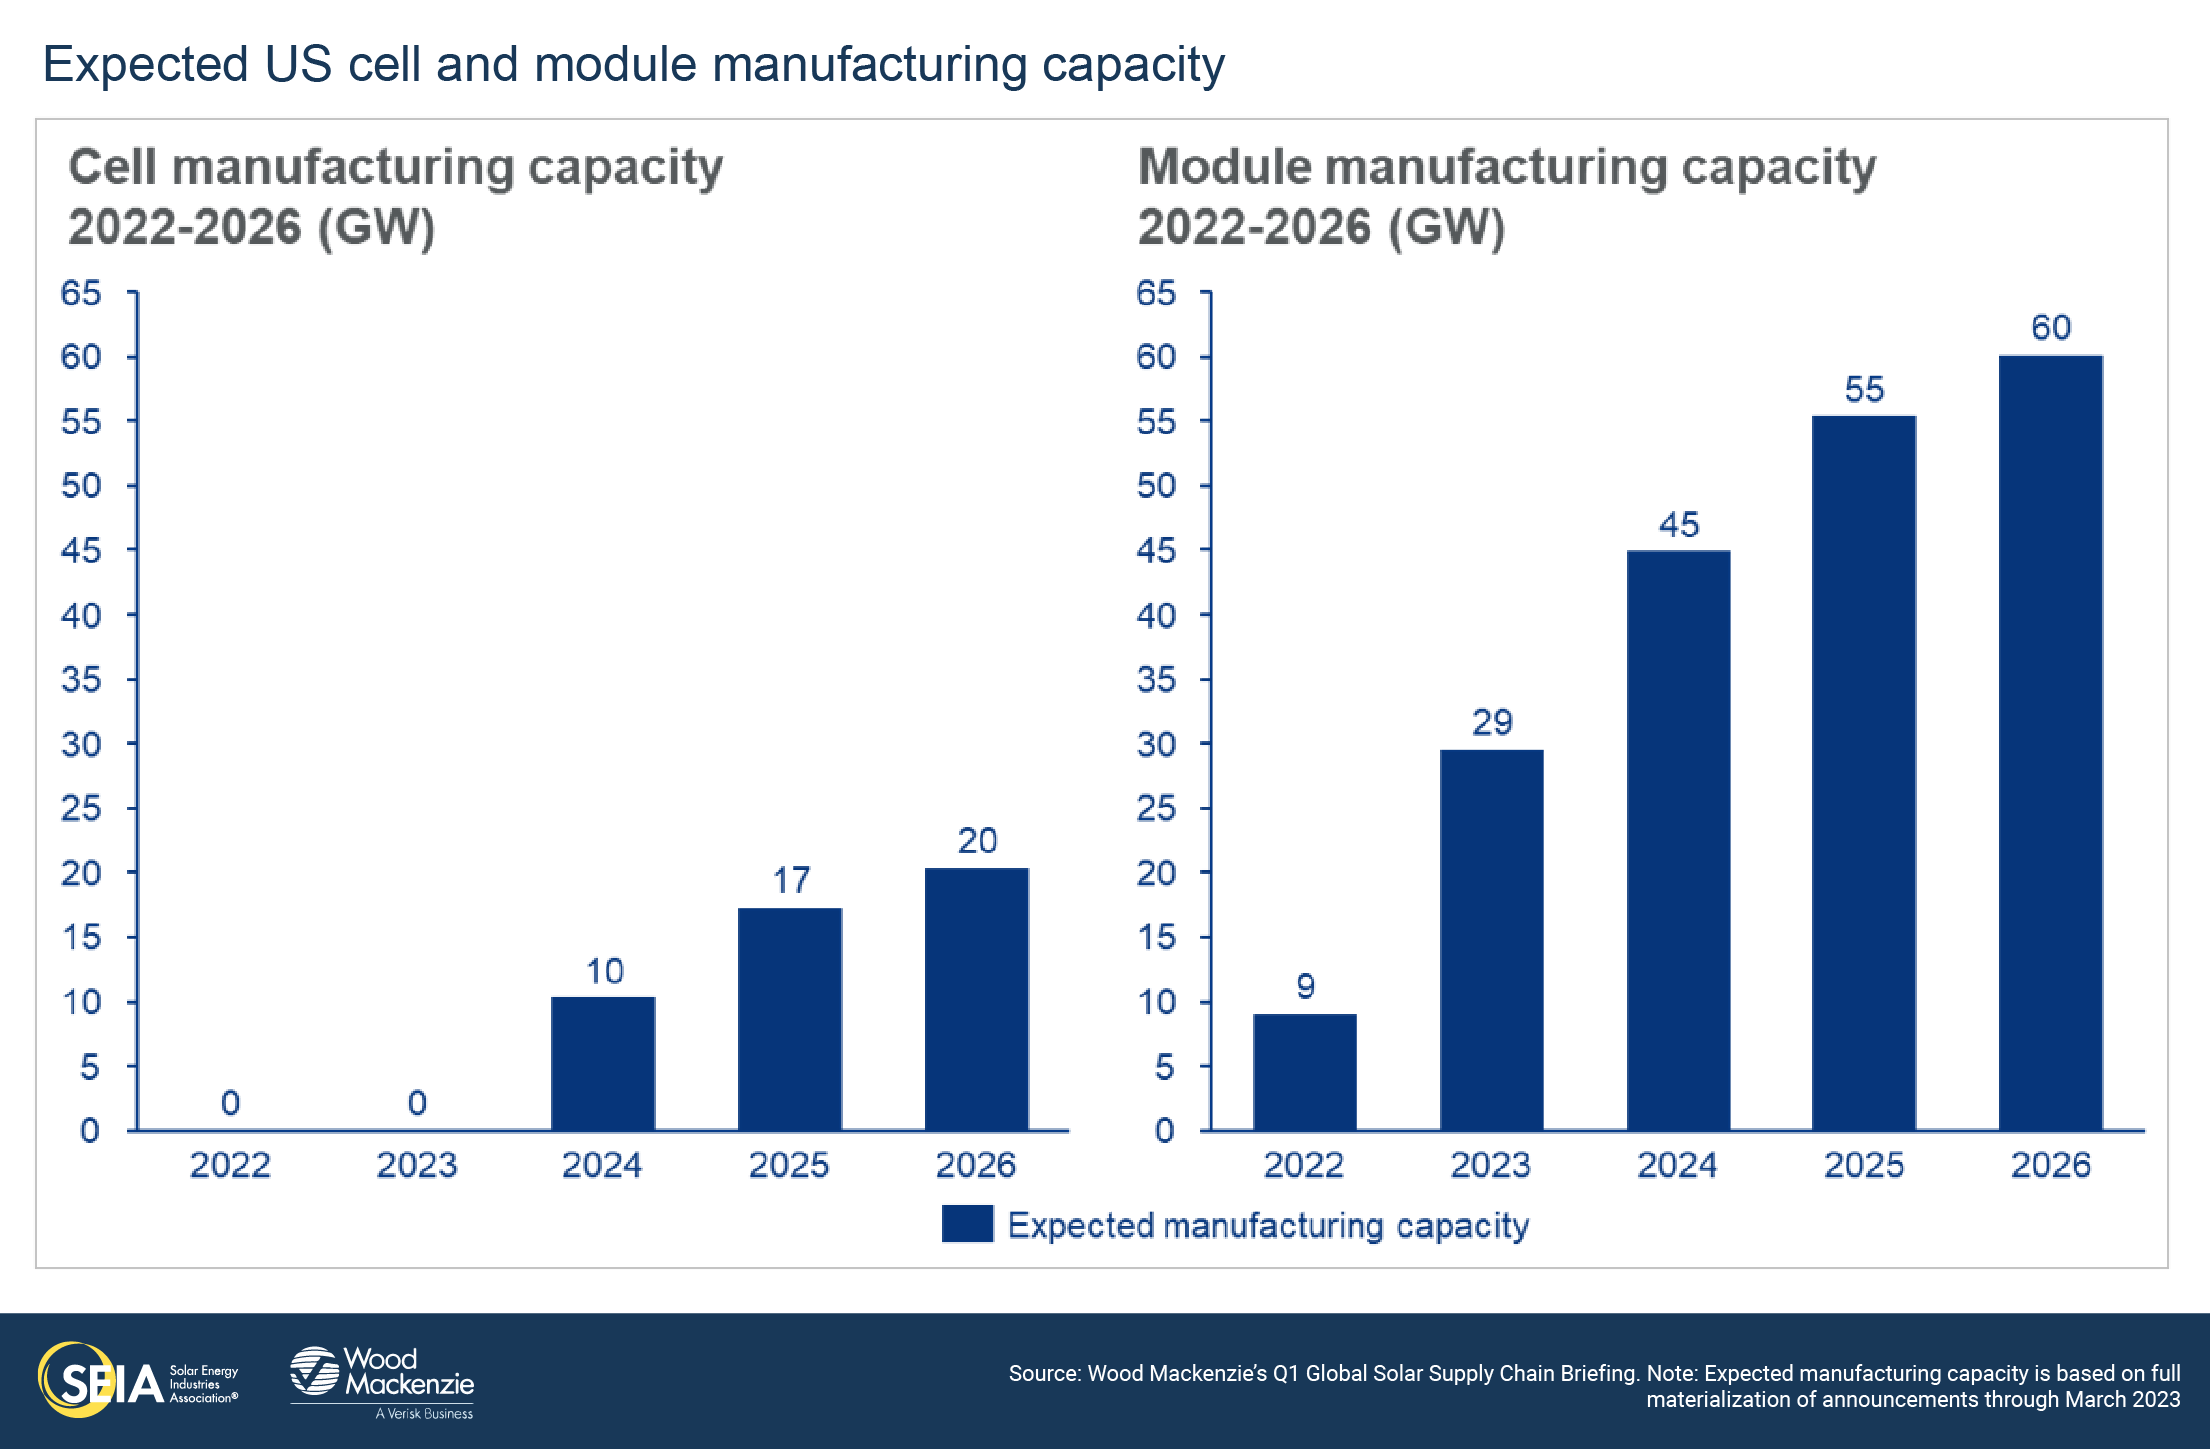
- In response to the Inflation Reduction Act (IRA), there has been a considerable increase in newly announced module manufacturing facilities in the US. As of the end of Q1, Wood Mackenzie is tracking 52 GW of new facilities scheduled to come online by 2026, at least 16 GW of which are under construction.
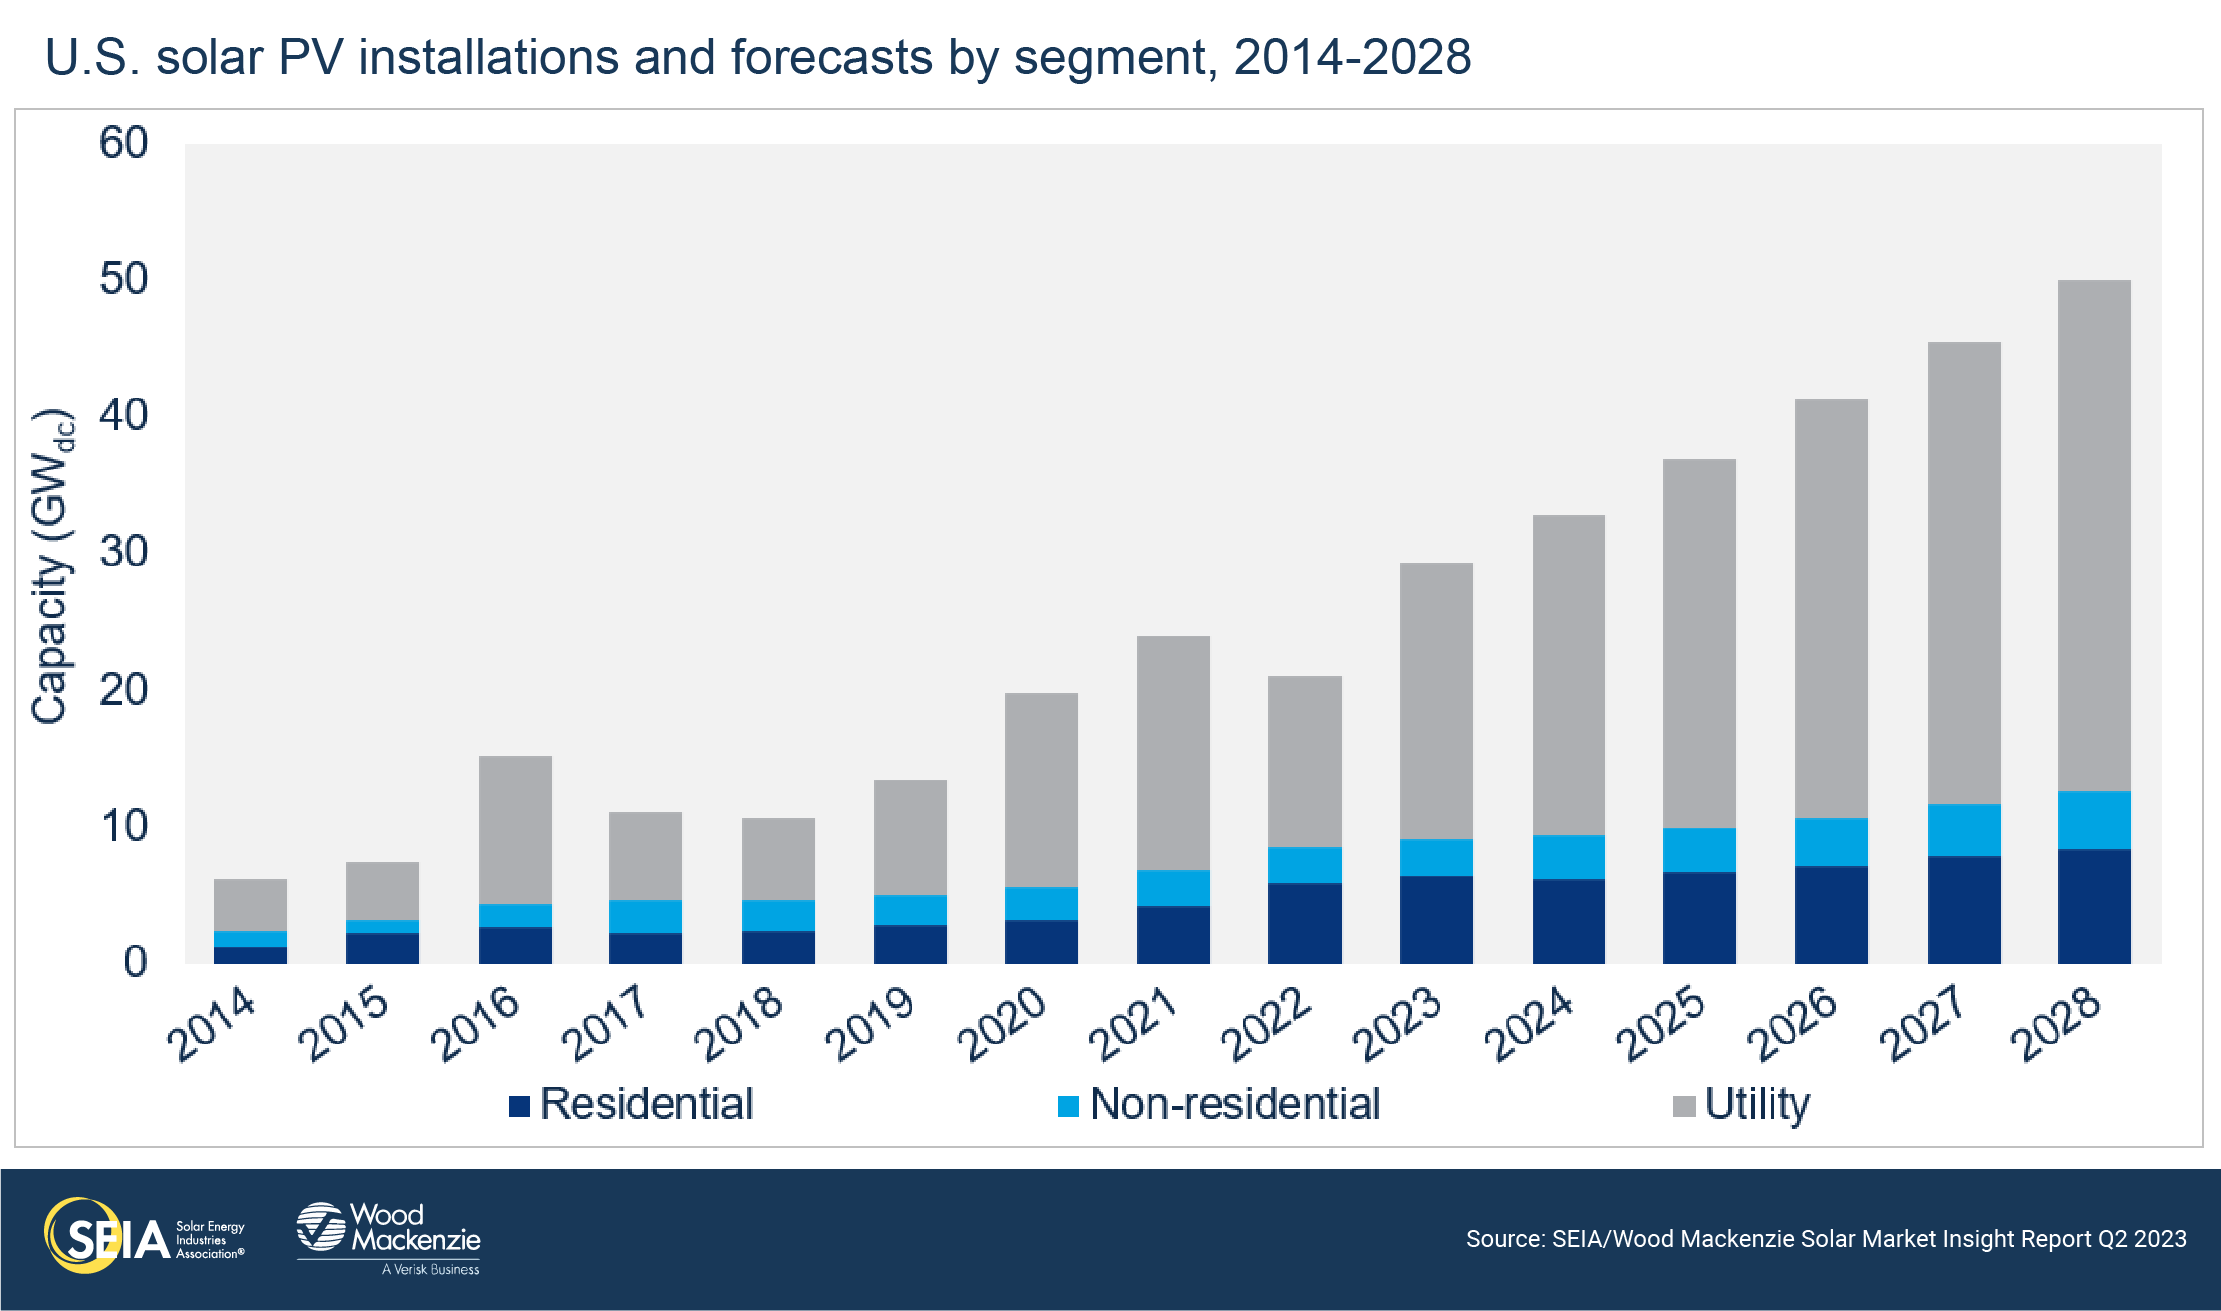
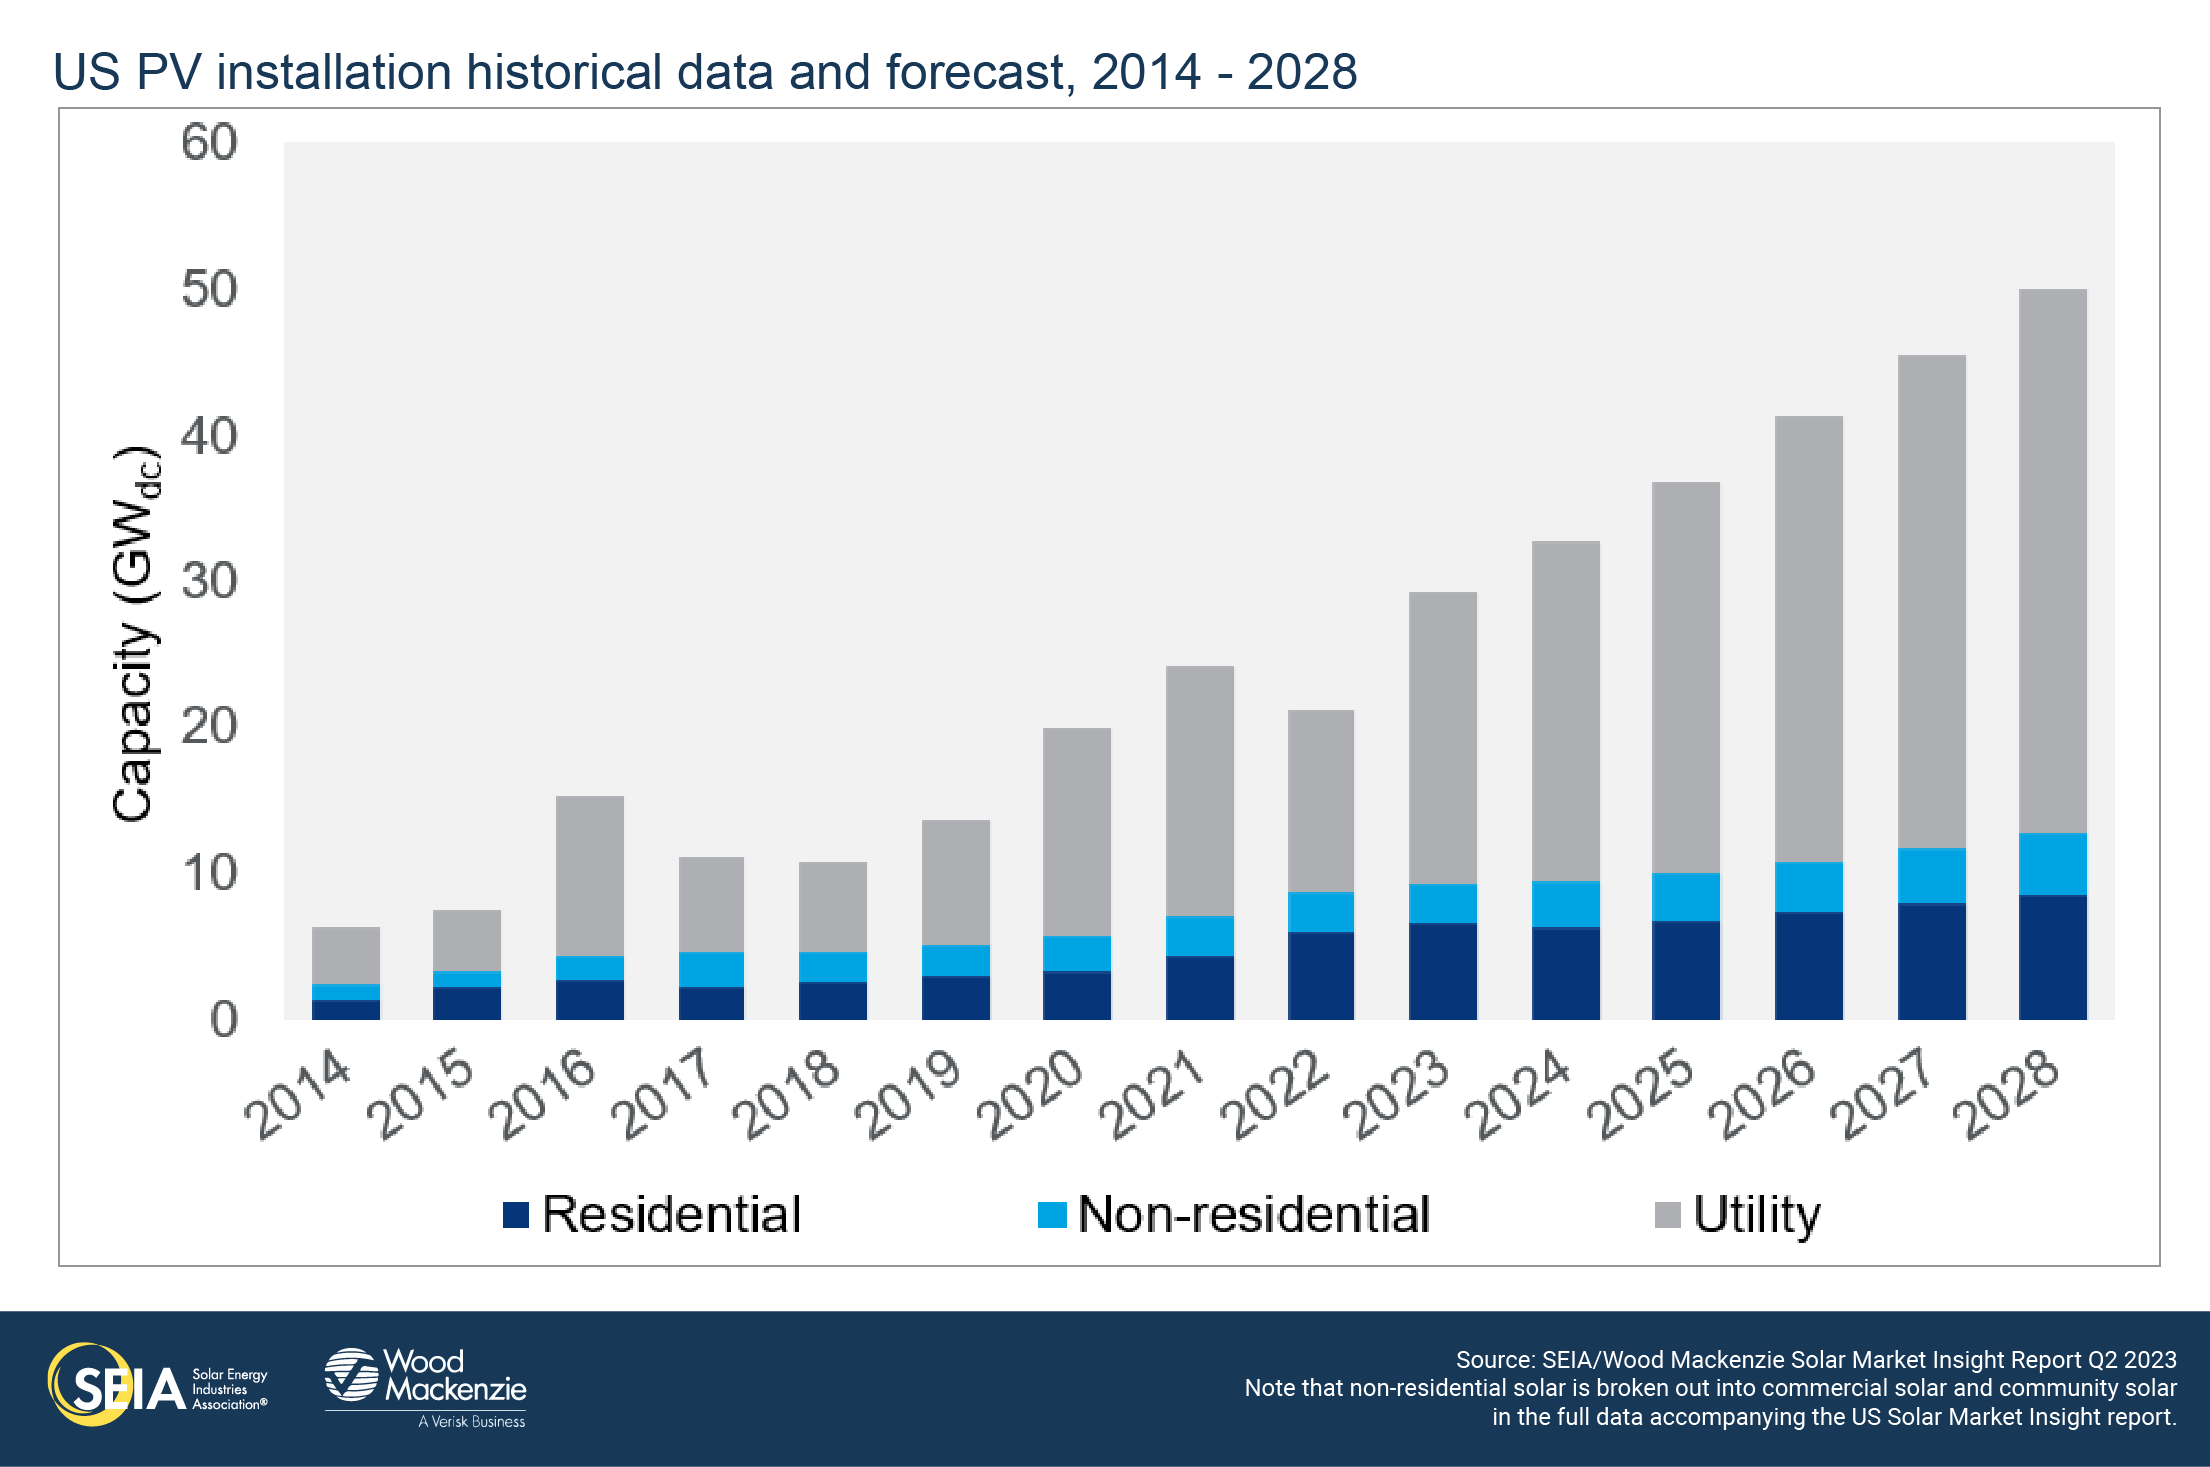
- Over the course of our five-year outlook, the US solar industry is expected to nearly triple in size. Between 2023 and 2028, the industry will add 236 GWdc to an installed base of 142 GWdc (as of year-end 2022). Solar will be the leading technology of the clean energy transition, thanks to the long-term policy certainty provided by the IRA.
2. Introduction
The US solar industry installed 6.1 gigawatts-direct current (GWdc) of capacity in the first quarter of 2023, a 47% increase from Q1 2022 and a 19% decrease from Q4 2022. This was the best first quarter in the industry’s history, led by delayed utility-scale solar projects coming online.
Each segment had a record-setting first quarter, except for community solar, which faced interconnection and siting challenges in several key state markets. The residential segment set a first quarter record and would have likely set another overall quarterly record had it not been for intense rainstorms that hampered installation crews. Utility-scale solar installations were up 66% compared to the first quarter of 2022. The industry is still operating in a supply-constrained environment, but conditions are improving as module shipments are finally making their way through ports.
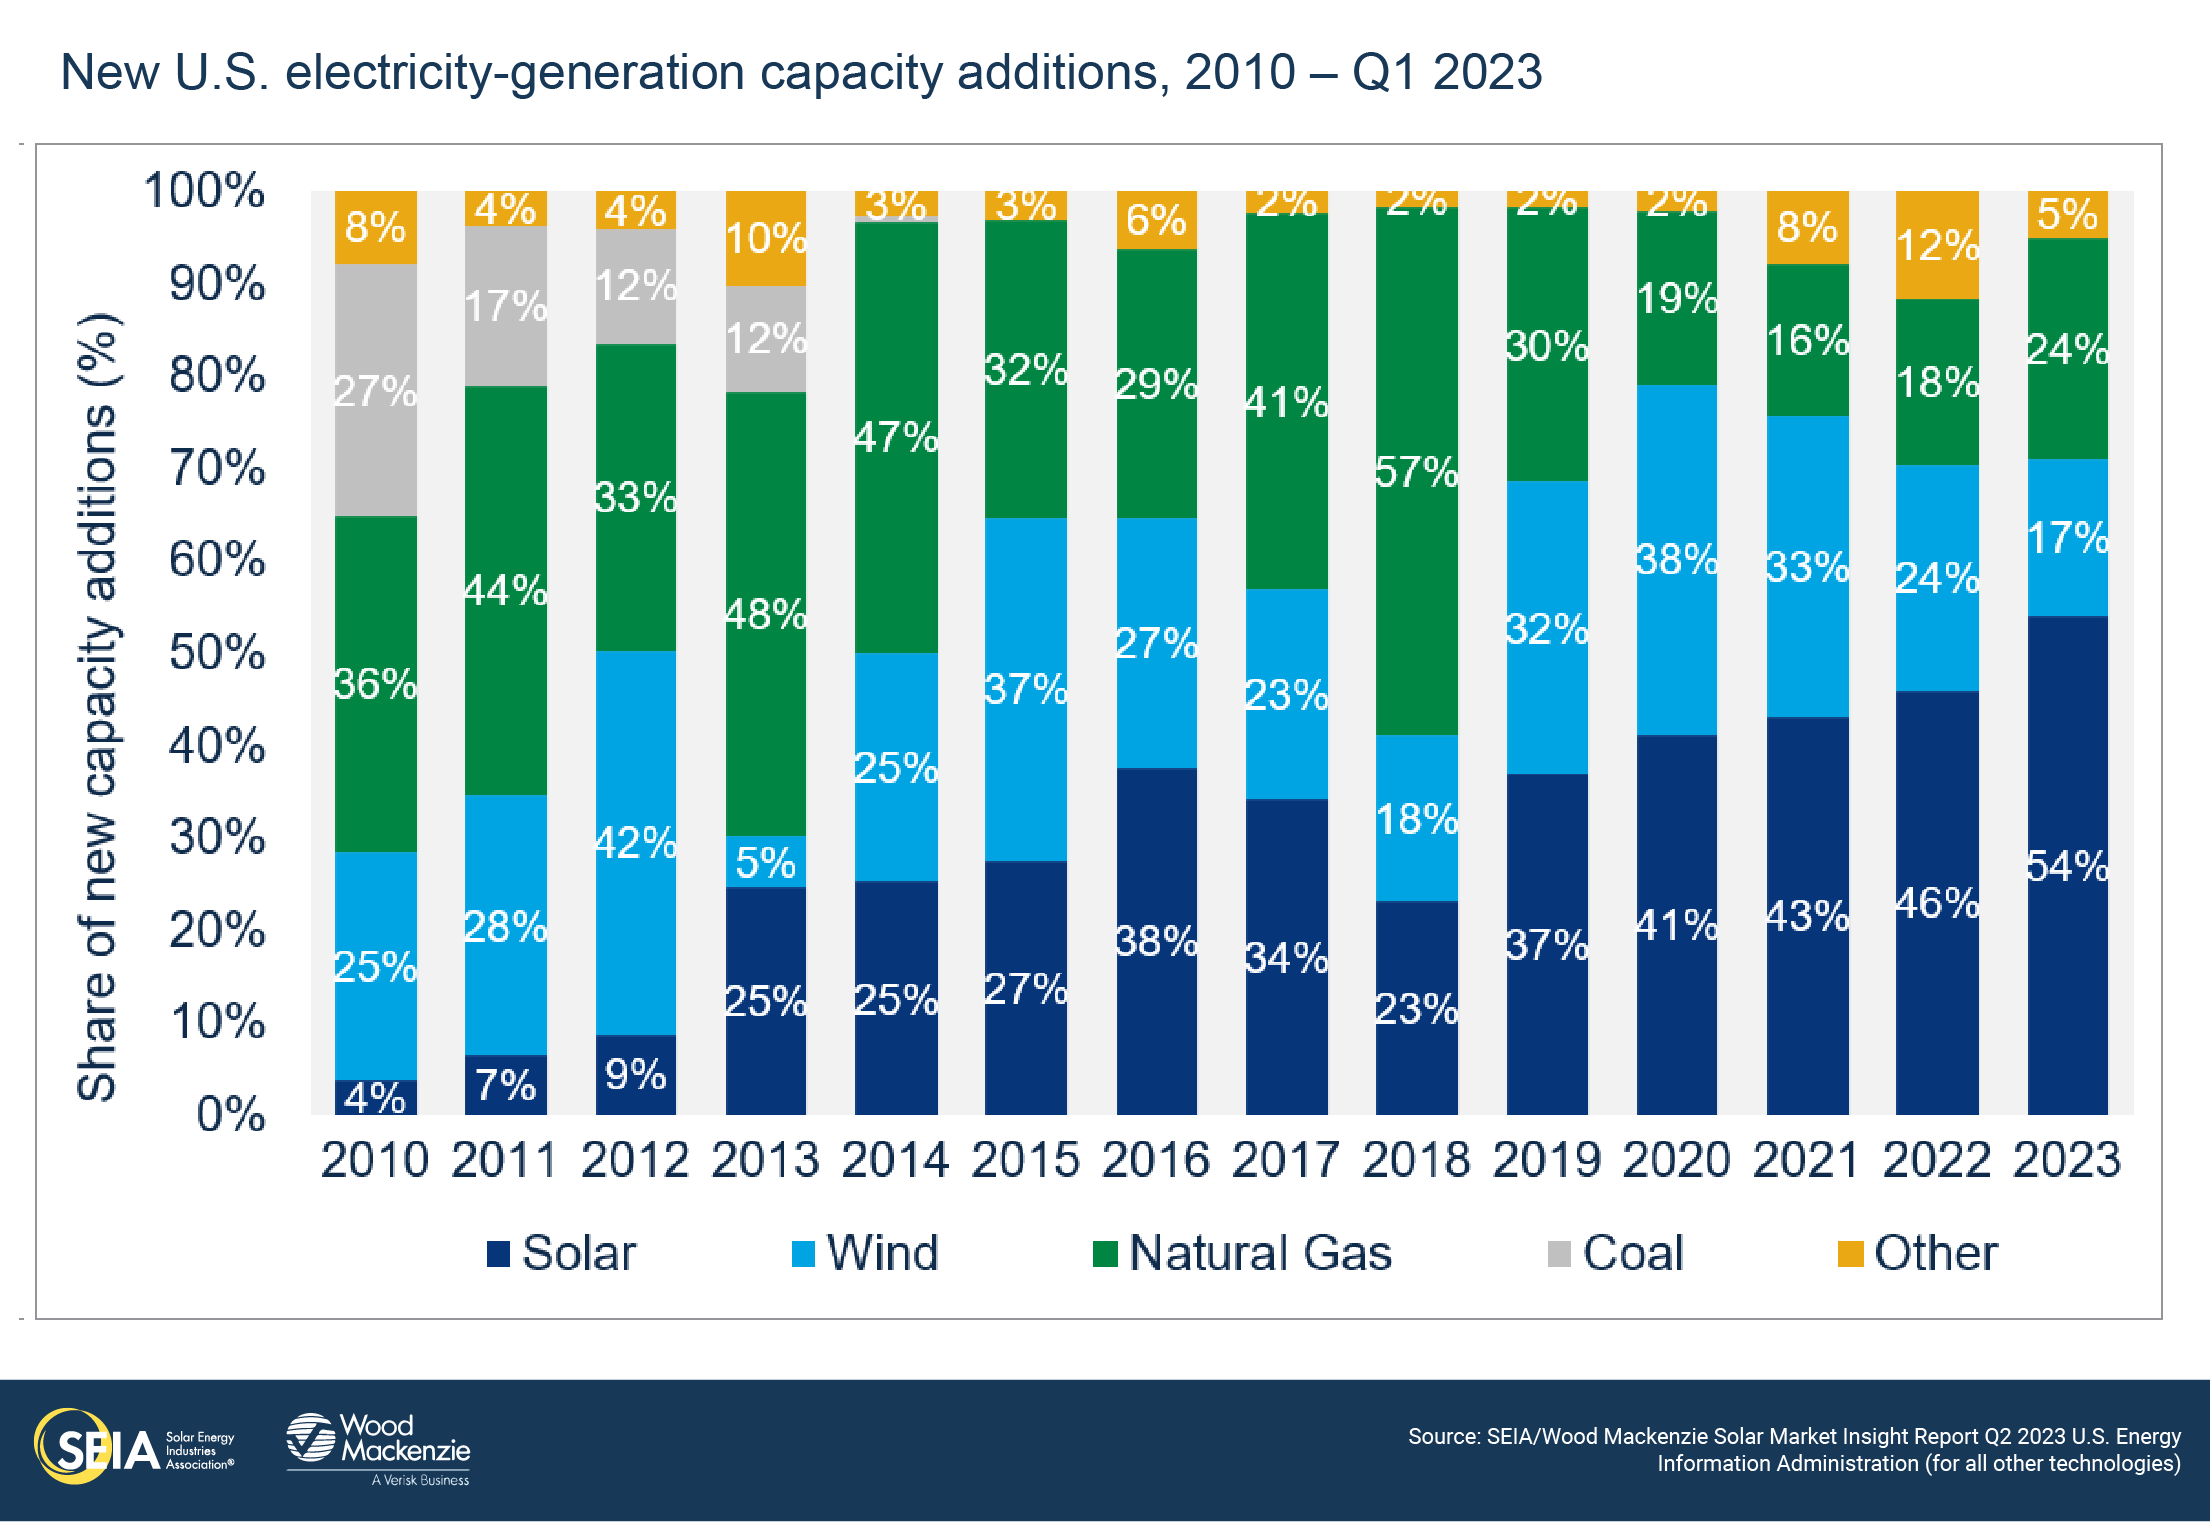
Overall, photovoltaic solar (PV) accounted for 54% of all new electricity-generating capacity additions in the first quarter of 2023.
New US electricity-generating capacity additions, 2010 – Q1 2023
Supply chain relief arrives slowly
The first quarter of this year showed signs that supply chain constraints are beginning to loosen their grip on the US solar industry. Installation volumes recovered considerably, particularly for utility-scale solar. The first quarter of the year is typically characterized by a seasonal slowdown after a rush to install projects at the end of the year. Volumes certainly declined compared to the last quarter of 2022, but every segment experienced notable growth compared to the first quarter of 2022. (The one exception to this was community solar. Please see the community solar section for more details.)
Additionally, importers are progressing on providing proper documentation to comply with the Uyghur Forced Labor Prevention Act (UFLPA). This has taken time, but US Customs and Border Protection (CBP) is releasing increasingly more volumes of detained module shipments that meet the requirements for polysilicon sourcing. CBP has issued guidance documentation for importers that has helped modules using North American and European polysilicon move through customs more quickly. (Note that modules with Chinese polysilicon are still not moving through US customs.) Import data shows that more than 12 GWdc of modules were imported in the first quarter of this year, compared to a total of 29 GWdc in 2022.
This is likely a combination of more imports making their way through customs as well as detained modules being released.
Module pricing is still elevated, and our quarterly data shows typical utility-scale module pricing rose for both fixed-tilt and single-axis tracking projects in the first quarter. But Wood Mackenzie expects supply chain constraints to continue to gradually ease as more suppliers satisfy CBP requirements.
Tax credit adder guidance brings answers, as well as more questions
Throughout the spring, the Treasury Department released additional guidance on three of the tax credit adders for the investment tax credit (ITC) and production tax credit (PTC): the low-to-moderate income (LMI) adder for projects under 5 MWac (Notice 2023-17), the energy communities adder (Notice 2023-29), and the domestic content adder (Notice 2023-38).
The LMI adder guidance established four categories of projects that could qualify based on their location or customers served. It also announced rough timeframes for when applications would be accepted for some of the categories to earn allocations under the 1,800 MWac annual program cap. Additional guidance on the adder was released at the end of May. It outlined application procedures, capacity allocation criteria, and expanded definitions. Notably, the new guidance answered key outstanding questions on LMI income verification and criteria for awarding allocations when eligible projects exceed the program cap. However, the application timeframes for some of the categories are still unknown. More guidance to address outstanding questions is expected later this year.
The energy communities adder guidance identified Census tracts and potential statistical areas where projects can qualify for the adder. There are large areas of the country that qualify, providing substantial upside potential. However, there are still some unanswered questions around the edges, such as whether a project qualifies if only a portion of it is located on a brownfield site and the process for additional areas to gain eligibility.
And most recently, the domestic content adder guidance specified requirements needed for a project to earn this credit. All components of a manufactured product that are an “applicable project component” or APC (module, inverter, battery, etc.) must be produced in the US for that APC to fully contribute to the numerator in the domestic content percentage calculation. This percentage calculation starts at 40% of the cost of all manufactured products in a project and grows to 55% over the next few years. The rules to qualify are complex, but it is Wood Mackenzie’s view that it will be quite challenging for a project to qualify without modules that are made with domestically-produced solar cells, the main components of a module. Even with domestic solar cells, there will need to be sufficient domestic manufacturing capacity of multiple other components (glass, frames, junction boxes, encapsulants, components of inverters, etc.) for developers to meet the requirements.
Given this reality, the domestic content adder guidance implies a multi-year timeframe before projects come online that can qualify for this credit. There is currently no silicon solar cell manufacturing located in the US, and these facilities take at least 2-3 years to build and ramp up production. Since the IRA was passed, 20 GW of cell manufacturing facilities have been announced, compared to the 52 GW of new module manufacturing facilities that have been announced as of the end of Q1 (for more details see Wood Mackenzie’s insight The long and winding road to US-made solar module procurement.)
Wood Mackenzie doesn’t assume what share of solar installations will qualify for which adders. But we do assume that the weighted average tax credit will increase over time, helping to drive deployment.
Solar installations to nearly triple by 2028
Thanks in large part to the IRA, we continue to forecast strong near-term growth for the solar industry, despite supply chain constraints and other industry challenges. Growth in 2023 will recover substantially, with deployments reaching 29 GWdc compared to last year’s 21 GWdc. From 2024 to 2028, we project growth rates to be consistently in the low-teens due to the industry’s cost competitiveness (either compared to other forms of power generation or customers’ retail rates) as well as ambitious decarbonization goals.
While residential solar will continue its upward trajectory, it is not expected to achieve the same level of growth as it has for the last few years. The residential solar industry grew over 28% on average over the last three years thanks to a thriving solar loan industry that depended on low-interest rates. As those interest rates have risen, business has slowed significantly (see more in the residential solar section). California’s new net metering regime (NEM 3.0) also contributes to lower growth levels over the next five years, which average 6%.
Nearly 236 GWdc of total solar capacity is expected to come online in the next five years. This will almost triple the installed fleet from 142 GWdc as of year-end 2022 to 377 GWdc by year-end 2028.
3. Market segment outlooks
3.1. Residential PV
- 1,641 MWdc installed in Q1 2023
- Up 30% from Q1 2022
- Down 3% from Q4 2022
In Q1 2023, the residential solar market installed 1,641 MWdc, growing 30% year-over-year and setting a first quarter record. However, the segment also saw a quarterly decline in newly installed capacity for the first time in two years, marking the end of its seven-quarter streak of record-setting installation levels. The slowdown in first quarter installations is part of the typical seasonality of residential solar, but installations were also affected by the intense rainstorms in California and significant economic headwinds.
Installers continue to see a slowdown in sales in many states. In this time of economic uncertainty, consumer hesitancy is a persistent trend, with some installers struggling to close sales despite receiving a high volume of website visits. The recent bank failures added more headwinds for residential solar financing, with loan providers continuing to raise rates. While these challenges will impact growth this year, it will be partially offset by significant retail rate increases and demand pull-in under California NEM 2.0.
Wood Mackenzie forecasts 8% growth in 2023, a slight increase from last quarter based on stronger-than-expected sales in California before NEM 3.0 went into effect. These backlogs will support installations through at least the third quarter but will only translate to slight annual growth because of the eventual drop in installations in Q4. We continue to forecast a 38% reduction in California installations in 2024, leading to a 4% national market contraction. However, third-party owned systems will begin to qualify for the ITC adders and the overall segment will benefit more from the IRA at this time, resulting in 12% growth for all states other than California.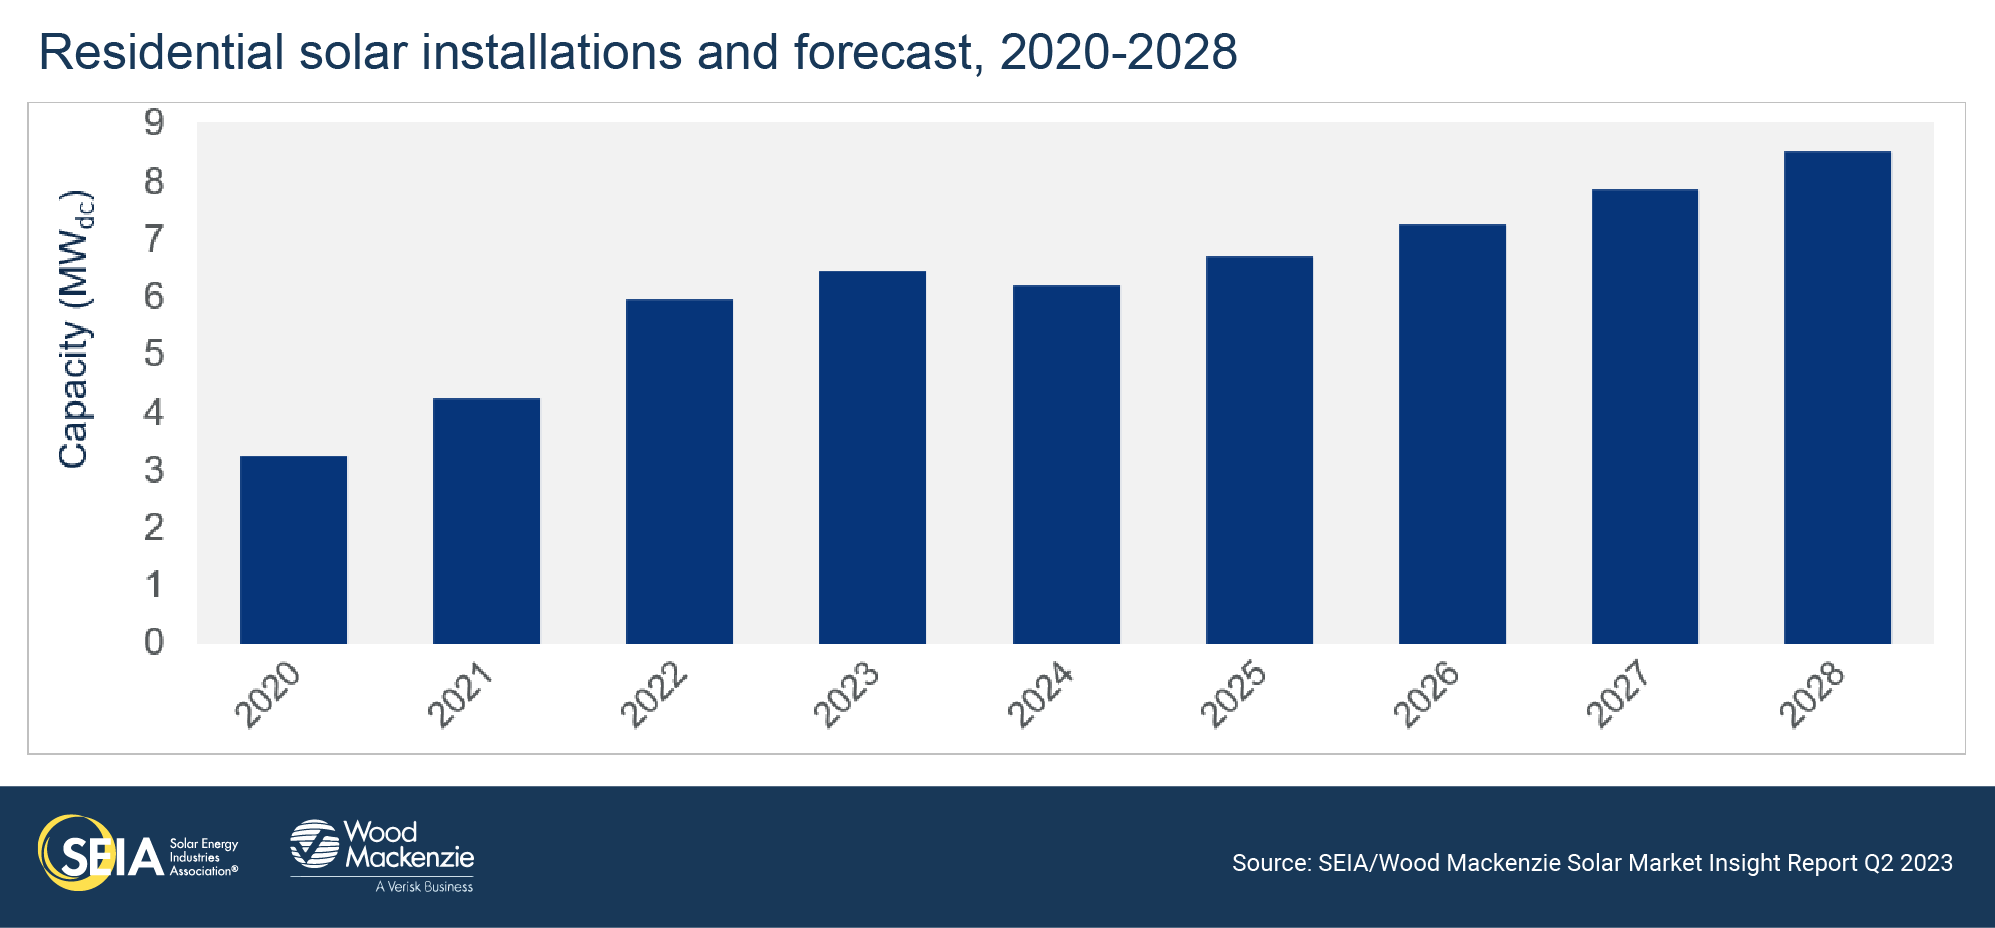
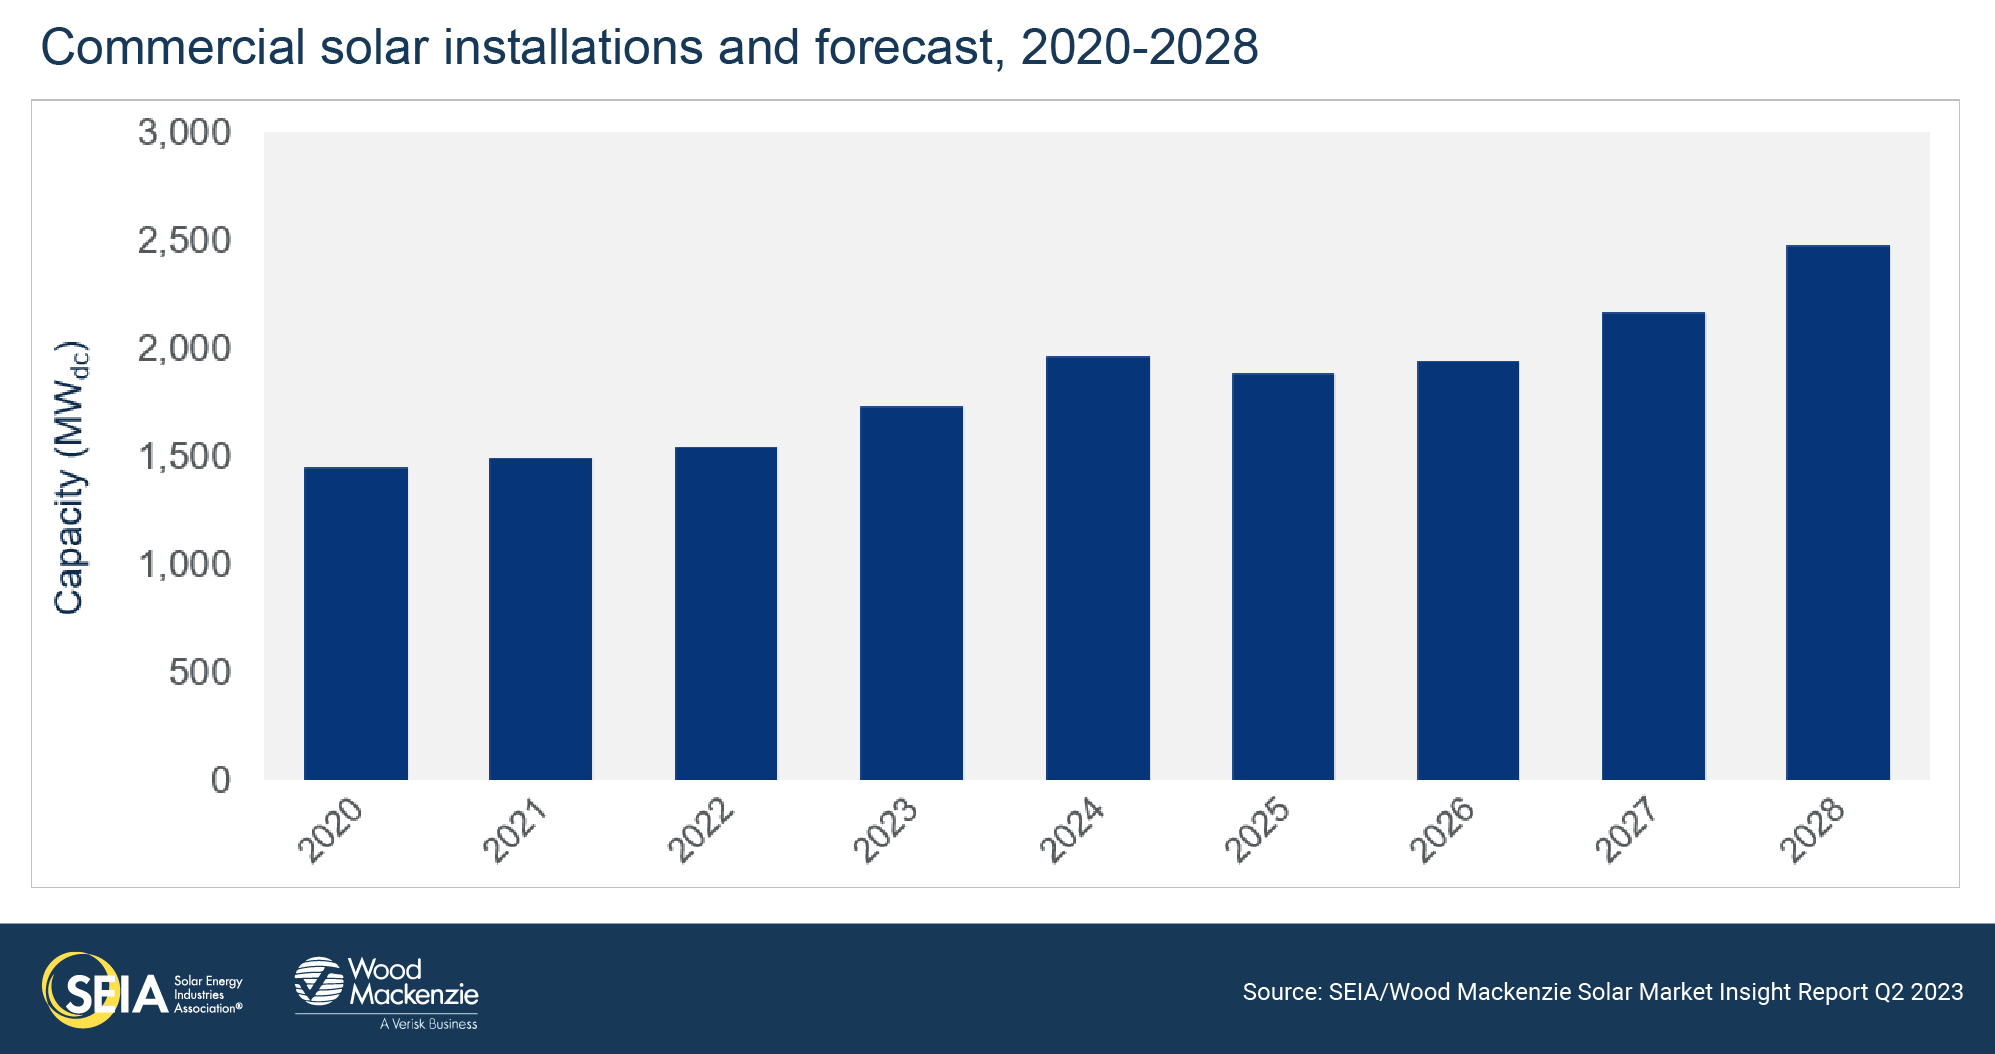
3.2. Commercial PV
- 391 MWdc installed in Q1 2023
- Up 27% from Q1 2022
- Down 19% from Q4 2022
Note on market segmentation: Commercial solar encompasses distributed solar projects with commercial, industrial, agricultural, school, government or nonprofit offtakers, including remotely net-metered projects. This excludes community solar (covered in the following section).
With nearly 400 MWdc installed in the first quarter, commercial solar volumes are recovering from the supply chain constraints of last year. Year-over-year growth was 27% compared to the first quarter of 2022, when supply chain constraints were intensifying. As mentioned in the Introduction, while the industry is still supply-chain constrained, importers report that more modules are clearing customs and making their way to project sites. As supply chain constraints continue to ease, we expect 12% growth for the commercial solar segment in 2023.
We also expect 13% growth for commercial solar in 2024 before annual installations decline in 2025 and 2026. This is due to the dynamics around California’s NEM 3.0 policy, which went into effect in mid-April. Since installers and customers worked quickly to submit interconnection applications before the mid-April deadline, those projects will get built out over the next 18-24 months. We expect to see a drop-off in California installations beginning in early 2025, which will shrink overall national growth that year.
After the market experiences the initial impact of California NEM 3.0, national commercial solar growth will hit 11% in 2027 and 14% in 2028 as growth picks up in emerging markets. This growth will also be driven by the impacts of the IRA tax credit adders.
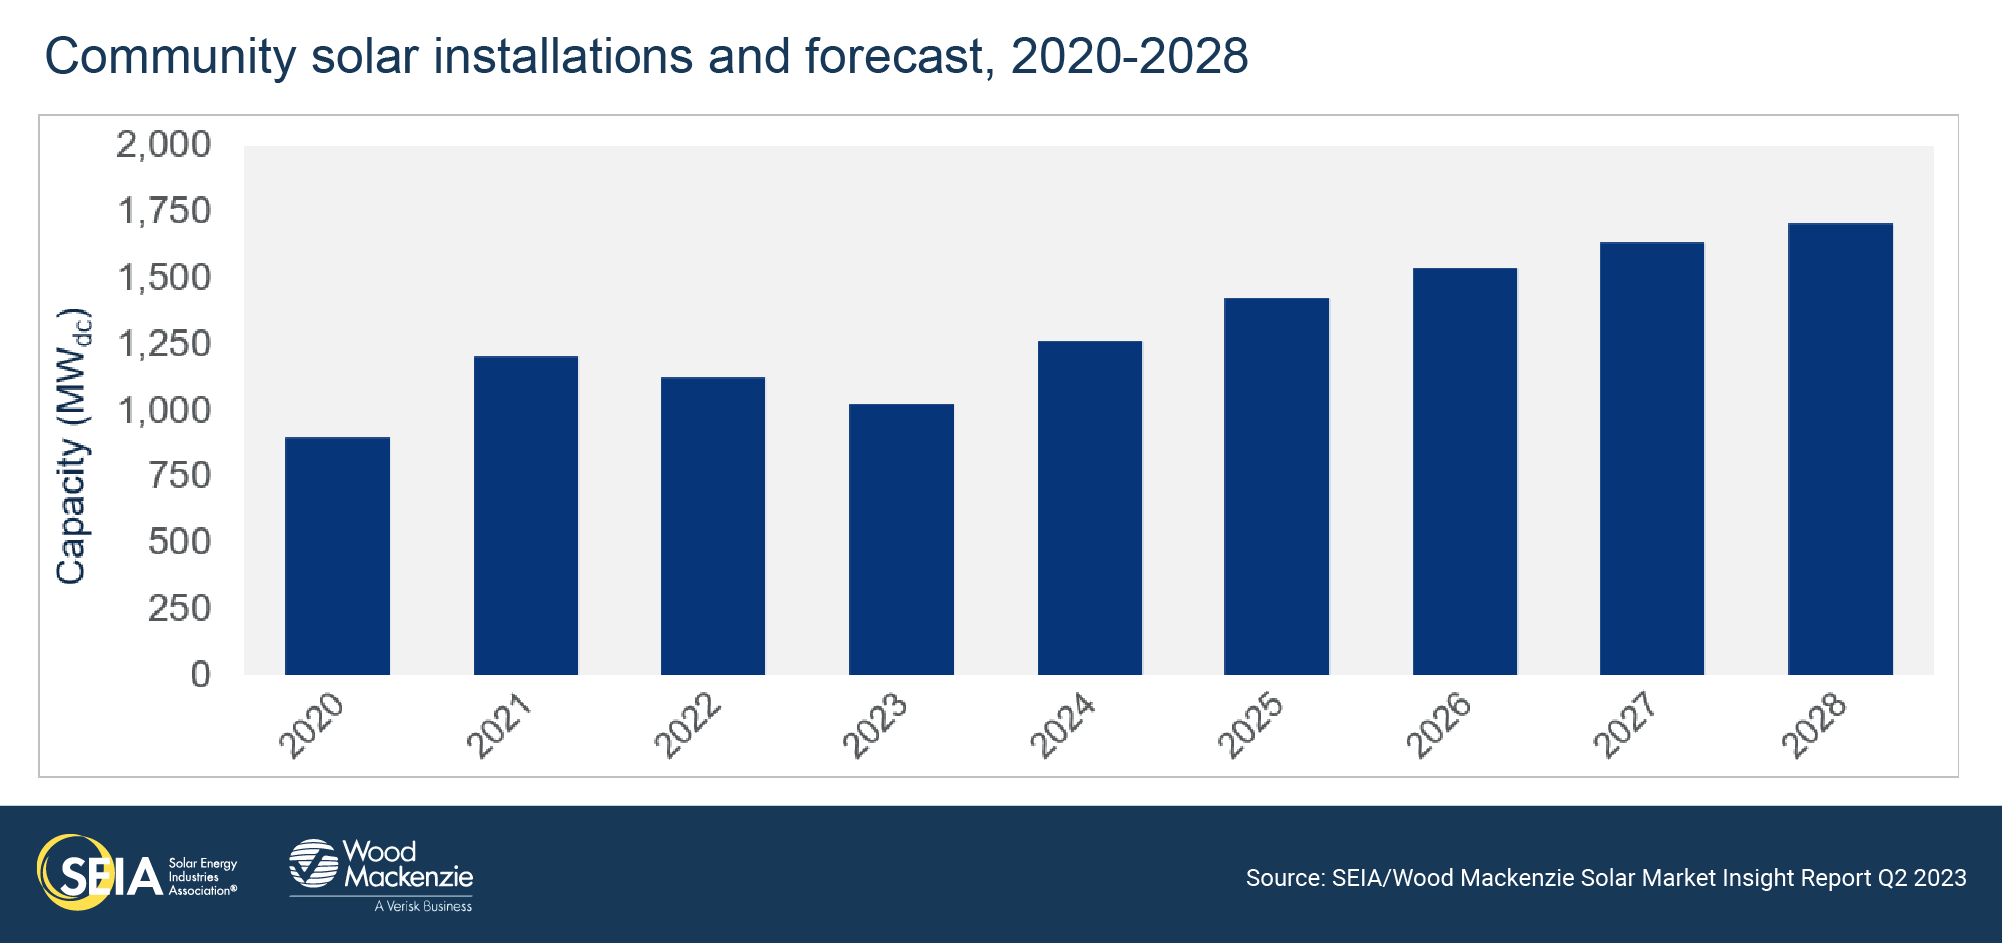
3.3. Community solar PV
391 MWdc installed in Q1 2023
- 212 MWdc installed in Q1 2023
- Down 13% from Q1 2022
- Down 45% from Q4 2022
Note on market segmentation: Community solar projects are part of formal programs where multiple residential and non-residential customers can subscribe to the power produced by a local solar project and receive credits on their utility bills.
Community solar installations declined 13% year-over-year in Q1 2023, resulting in the lowest quarter of new capacity additions since Q1 2021. After a record-breaking 2022, new capacity additions in New York dipped 32% year-over-year, which contributed the most to the national decline. Additionally, year-over-year declines in Massachusetts and Maine can be attributed to continued interconnection challenges and siting constraints with no clear resolution in sight.
Despite low Q1 volumes, the forecast for 2023 still exceeds 1 GW of total new capacity. Newly established state markets in Delaware, Virginia, and New Mexico are on track to see their first projects installed this year. We expect these new markets to make up 8% of the total forecast in 2023, increasing to 16% by 2024. California’s new community solar program is also on schedule, with a proposed decision and full program rules expected by Q3 2023.
The year started with some promising policy activity in existing state markets. The long-awaited proposal for New Jersey’s community solar program was released in March 2023. The plan proposes an increase to the allotted capacity for the 2024 and 2025 program years, boosting our five-year outlook for the state by 15% compared to last quarter. And in Maryland, the signing of HB 908 in May makes the new permanent program official. Overall, the national five-year outlook for community solar has decreased by 1% compared to last quarter, and we anticipate 8% average annual growth between 2023 and 2028.
3.4. Utility PV
- 3.8 GWdc installed in Q1 2023
- More than 172 GWdc of utility-scale solar will be added between 2023 and 2028
Utility-scale solar rebounded this quarter with the strongest first quarter on record. The sector achieved 66% year-over-year growth and exceeded the previous record Q1 by more than 170 MWdc. Over 3 GWdc of new contracts were signed in Q1, maintaining the total utility-scale solar pipeline at 90 GWdc.
A strong Q4 2022 and Q1 2023 indicates that developers are recovering from supply chain hurdles. Developers are receiving inventory, as more than 40% of all electronics shipments from Malaysia, Thailand, and Vietnam have been released from UFLPA detention (though not all electronics shipments are modules). Although prices have stabilized, they remain high compared to Q1 2022. Additionally, President Biden’s veto of legislation that would have repealed the two-year pause on new solar tariffs ensures that there is time to source alternate supply if new duties come into effect in June 2024.
Though inventory levels are improving, the utility-scale industry still faces supply chain constraints. Despite increasing shipment releases indicating a more stabilized UFLPA situation, there is no indication that products containing Chinese non-Xinjiang polysilicon are entering the US. Additionally, other factors such as growing NIMBYism, high interconnection times and costs, and low labor availability will continue to challenge the utility-scale solar industry.
Despite these headwinds, Wood Mackenzie forecasts that total new utility-scale installations will reach 172 GWdc between 2023-2028. A strong first quarter resulted in a slight uplift to our 2023 outlook to more than 20 GWdc. While the market will start to feel the impacts of the IRA in 2024 and 2025, we decreased the latter years of the forecast by 4% due to changing assumptions on interconnection queue delays and the cost competitiveness of solar against other technologies.
4. US solar PV forecasts
5. National solar PV system pricing
Note: Wood Mackenzie has updated the reporting methodology for modeled prices to be consistent with US solar system pricing reports. Therefore, figures shown below may not match those published in earlier editions of the US Solar Market Insight report.
Wood Mackenzie employs a bottom-up modeling methodology to capture, track and report national average PV system pricing by segment for systems installed each quarter. The methodology is based on the tracked wholesale pricing of major solar components and data collected from industry interviews. Wood Mackenzie assumes all product is procured and delivered in the same year as the installation except modules for the utility segment, which are procured one year prior to commercial operation.
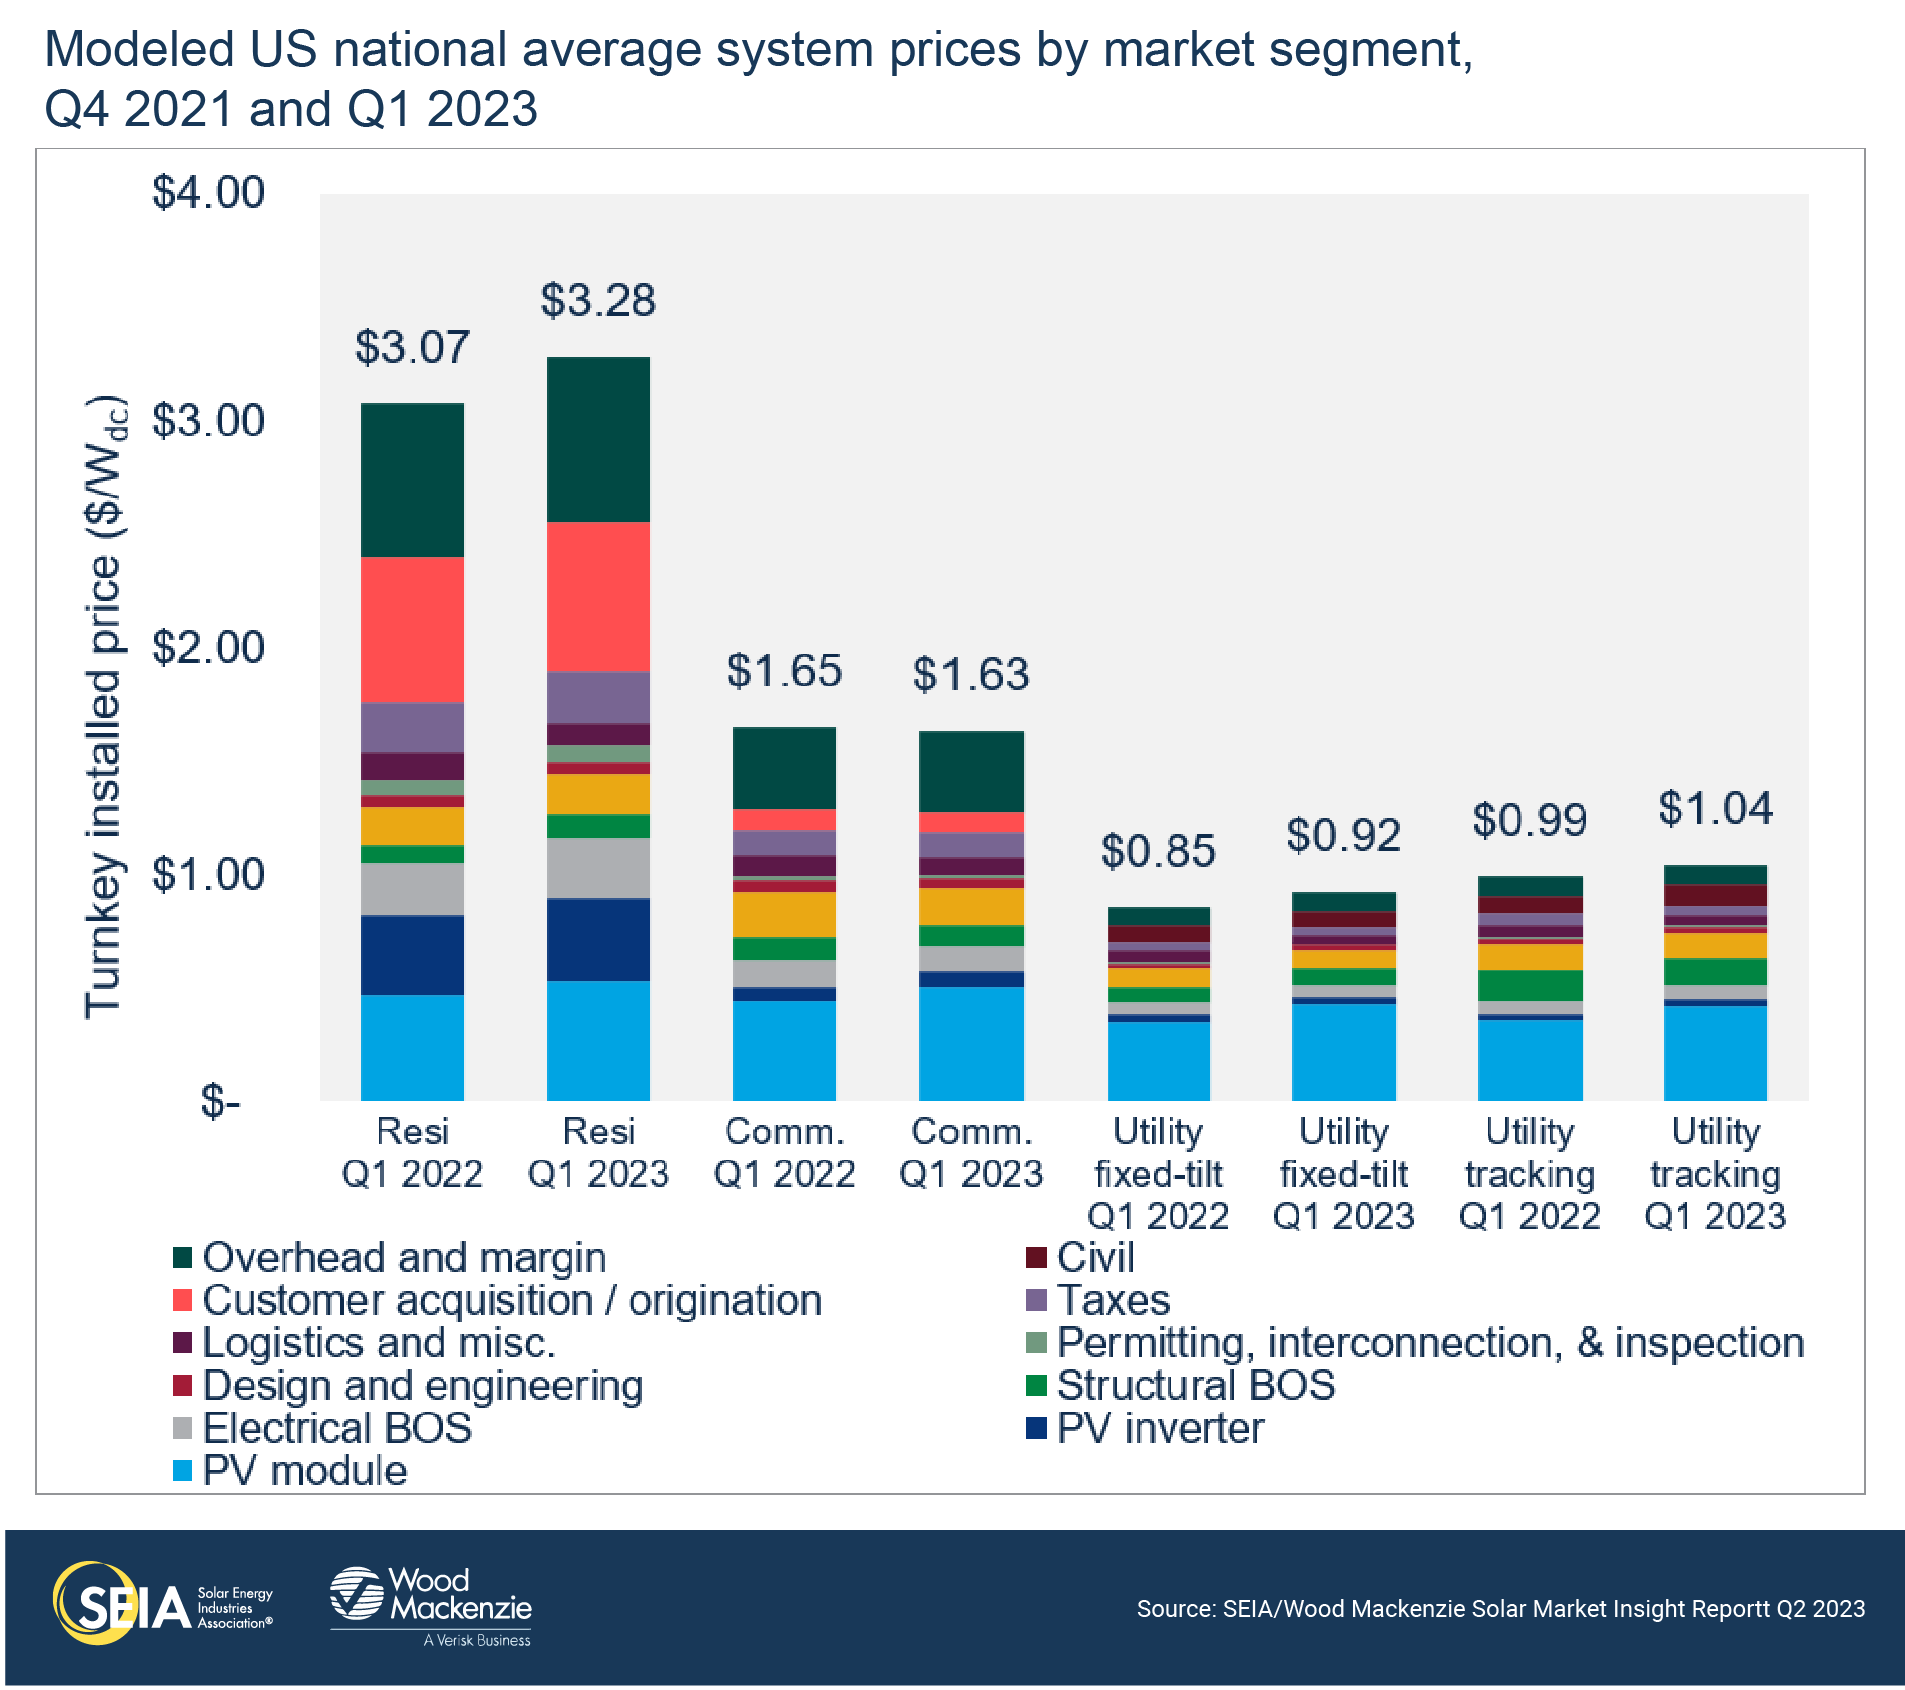
This year began with cost relief for the distributed generation segment. Prices spiked in the last few quarters as the anticircumvention investigation and UFLPA continued to limit module supply. As polysilicon prices started to decline and Tier 2 manufacturers took up more market share, module prices dropped in Q1 2023 compared to Q4 2022 in the distributed segments. Despite this relief, system prices remain high compared to Q1 2022 for all segments except the commercial segment, which was down 1% year-over-year. The residential segment was up 7% and the utility fixed-tilt and tracker segments were up 8% and 5%, respectively, in Q1 2023 compared to Q1 2022.
About the Report
U.S. solar market insight® is a quarterly publication of Wood Mackenzie and the Solar Energy Industries Association (SEIA)®. Each quarter, we collect granular data on the U.S. solar market from nearly 200 utilities, state agencies, installers and manufacturers. This data provides the backbone of this U.S. Solar Market Insight® report, in which we identify and analyze trends in U.S. solar demand, manufacturing and pricing by state and market segment over the next five to ten years. All forecasts are from Wood Mackenzie, Limited; SEIA does not predict future pricing, bid terms, costs, deployment or supply. The report includes all 50 states and Washington, D.C. National totals reported also include Puerto Rico and other U.S. territories. Detailed data and forecasts for 50 states and Washington, D.C. are contained within the full version of the report.
References and Contact
- References, data, charts and analysis from this executive summary should be attributed to “Wood Mackenzie/SEIA U.S. solar market insight®.”
- Media inquiries should be directed to Wood Mackenzie’s PR team ([email protected]) and Morgan Lyons ([email protected]) at SEIA.
- All figures are sourced from Wood Mackenzie. For more detail on methodology and sources, click here.
About the Authors
Wood Mackenzie Power & Renewables | U.S. Research Team
Michelle Davis, Principal Analyst (lead author)
Sylvia Leyba Martinez, Senior Analyst
Zoe Gaston, Principal Analyst
Sagar Chopra, Solar Analyst
Caitlin Connelly, Research Associate
Matthew Sahd, Research Associate
Matt Issokson, Research Analyst
Elissa Pierce, Research Associate
Chris Seiple, Senior Vice President
Solar Energy Industries Association | SEIA
Shawn Rumery, Senior Director of Research
Colin Silver, Chief of Staff and Chief Content Officer
Tyler Thompson, Research Analyst
Justin Baca, Vice President of Markets & Research
Note on U.S. solar market insight report title: The report title is based on the quarter in which the report is released, not the most recent quarter of installation figures.
License
Ownership rights
This report (“Report”) and all Solar Market Insight® (“SMI”)TM reports are jointly owned by Wood Mackenzie and the Solar Energy Industries Association (SEIA)®(jointly, “Owners”) and are protected by United States copyright and trademark laws and international copyright/intellectual property laws under applicable treaties and/or conventions. Purchaser of Report or other person obtaining a copy legally (“User”) agrees not to export Report into a country that does not have copyright/intellectual property laws that will protect rights of Owners therein.
Grant of license rights
Owners hereby grant user a non-exclusive, non-refundable, non-transferable Enterprise License, which allows you to (i) distribute the report within your organization across multiple locations to its representatives, employees or agents who are authorized by the organization to view the report in support of the organization’s internal business purposes, and (ii) display the report within your organization’s privately hosted internal intranet in support of your organization’s internal business purposes. Your right to distribute the report under an Enterprise License allows distribution among multiple locations or facilities to Authorized Users within your organization.
Owners retain exclusive and sole ownership of this report. User agrees not to permit any unauthorized use, reproduction, distribution, publication or electronic transmission of any report or the information/forecasts therein without the express written permission of Owners.
Disclaimer of warranty and liability
Owners have used their best efforts in collecting and preparing each report.
Owners, their employees, affiliates, agents, and licensors do not warrant the accuracy, completeness, correctness, non-infringement, merchantability, or fitness for a particular purpose of any reports covered by this agreement. Owners, their employees, affiliates, agents, or licensors shall not be liable to user or any third party for losses or injury caused in whole or part by our negligence or contingencies beyond Owners’ control in compiling, preparing or disseminating any report or for any decision made or action taken by user or any third party in reliance on such information or for any consequential, special, indirect or similar damages, even if Owners were advised of the possibility of the same. User agrees that the liability of Owners, their employees, affiliates, agents and licensors, if any, arising out of any kind of legal claim (whether in contract, tort or otherwise) in connection with its goods/services under this agreement shall not exceed the amount you paid to Owners for use of the report in question.
related content
You May Also Like