Solar Market Insight 2013 Q3
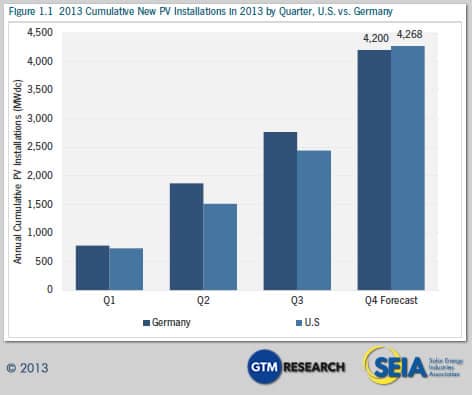
The U.S. installed 930 megawatts (MW) of photovoltaics (PV) in Q3 2013, up 20 percent over Q2 2013 and 35 percent over Q3 2012. This represents the second largest quarter in the history of the U.S. solar market and the largest quarter ever for residential PV installations. Even more importantly, 2013 is likely to be the first time in more than 15 years that the U.S. installs more solar capacity than world leader Germany, according to GTM Research forecasts.
Purchase the full report | Press Release | Infographic
The quarterly SEIA/GTM Research U.S. Solar Market Insight™ report shows the major trends in the U.S. solar industry. Learn more about the U.S. Solar Market Insight Report.
Key Findings
- Photovoltaic (PV) installations reached 930 MW in Q3 2013, up 20% over Q2 2013. This represents the second-largest quarter for solar installations in U.S. history
- While the utility solar sector represented more than half of new PV capacity installed, the residential market showed significant growth and posted the segment’s largest quarter in history with 186 MW installed
- The non-residential sector has suffered from a number of contracting state markets and we anticipate a flat 2013; however, we expect a strong resumption of growth in 2014
- 2013 may be the first year in more than a decade in which the U.S. installs more solar capacity than Germany
- Blended average PV system prices fell 4.2% in Q3 2013 compared to the previous quarter, reaching a new low of $3.00/W
- We forecast that the U.S. will install a total of 4.3 GW of new PV in 2013, up 27% over 2012
- The wave of concentrating solar power installations slated for completion at the end of this year kicked off with the 280 MWac Solana project, which came online in October 2013
1. Introduction
As we approach the end of 2013, it remains clear that this will be a banner year for solar in the United States. Installations have already surpassed the 10 GW cumulative mark, and by the end of the year, more than 400,000 individual solar projects will be operating across the country. We forecast that, by year’s end, installations will have grown 27% relative to 2012, with an even more impressive 52% growth rate in the residential sector alone.
Even more monumental for those who have been tracking the global solar market for years, 2013 will likely be the first time in more than fifteen years that the U.S. installs more solar capacity than Germany, according to GTM Research forecasts.
Underneath the top-level growth that has become common within the industry, the market is complex and in flux, with varying trends across geographies, market segments, and customer types. Among the key trends to monitor:
- The residential market continues to see the most rapid growth of any segment in the U.S. solar market. Through Q3, residential PV installations were up 49% year-over-year and we anticipate further expansion to 52% by the end of Q4. As we have noted in the past, the economics of residential solar are highly attractive in a number of states today (most notably California, Hawaii, and Arizona), but challenges to net energy metering regulations present a looming threat to the market. Though the debate over net metering will certainly continue for years, the recent outcomes from several states are promising.
- The non-residential market has seen the most difficulty in 2013 and we forecast that installations will remain flat year-over-year. Downturns across a number of major state markets (most notably New Jersey and Hawaii) have essentially been offset by growth in other states such as Massachusetts, Arizona, and Tennessee. We anticipate a meaningful return to growth in 2014 as a number of state-level programs are likely to result in significantly increased installations, most notably in New York, as well as continued expansion in California and Massachusetts.
- The utility market has seen consistent, strong installations through Q3 and we anticipate that the market will have a quarter with over 1 GW of installations in Q4, the first time any individual market segment has exceeded that mark. As we have noted in previous editions of this report, though the utility market will remain the largest segment in terms of installations through at least 2016, the rate of newly signed contracts with utilities has slowed and led a number of top utility-scale project developers to seek opportunities in emerging markets outside the U.S.
Finally, 2013 has been a good year for the solar market from a legislative and regulatory perspective. The industry has achieved broadly favorable outcomes across many different geographies. This includes net metering decisions in California, Arizona, Louisiana, and Idaho, as well as new solar deployment programs in Minnesota, Georgia, Massachusetts, and New York.
2. Photovoltaics
Photovoltaics (PV), which convert sunlight directly to electricity, continue to be the largest component of solar market growth in the U.S.
2.1. Installations
The U.S. installed 930 MW of PV in Q3 2013, up 20% over Q2 2013 and 35% over Q3 2012. This represents the second-largest quarter in the history of the U.S. market and the largest quarter ever for residential PV installations.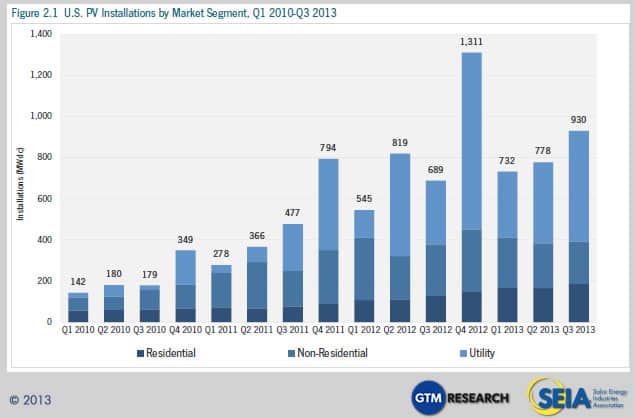
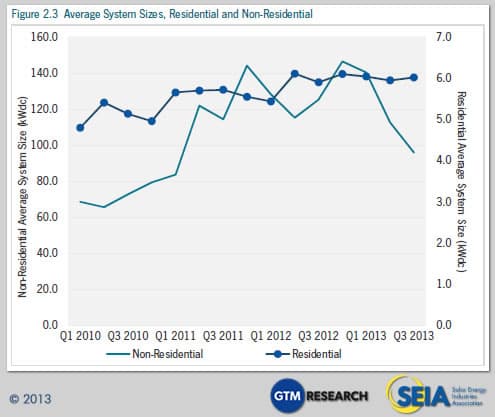
2.1.1. System Size Trends
Average system sizes in the residential and non-residential markets have experienced divergent trends in recent quarters. While residential system sizes have grown incrementally over time, steadying around an average of 6.0 kW, the non-residential market has seen average system sizes dip below 100 kW for the first time since 2011. This is a particularly positive sign for the non-residential market, where it has long been difficult to finance smaller projects. The market potential for small commercial installations is enormous, so this trend line may reflect strength in a market segment that could become vital to the non-residential market’s recovery.
2.1.2. Market Segments
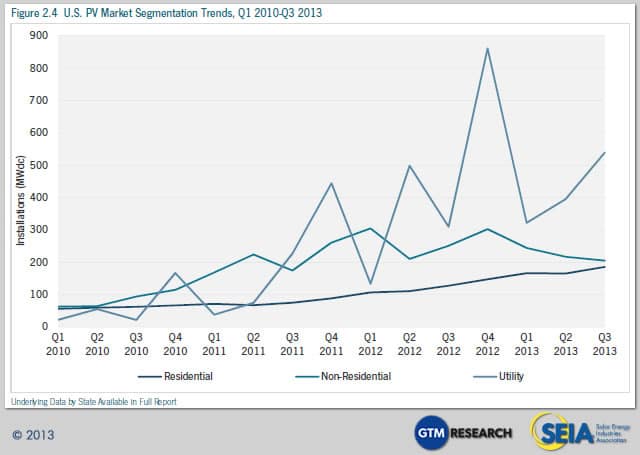
2.1.3. Residential
After a slight downturn in Q2 2013, the residential market resumed its steady incremental quarterly growth in Q3. Nearly 31,000 individual residential installations were completed in the third quarter, bringing the cumulative total in the U.S. to 360,000. Twenty of the 28 states we track grew on a quarterly basis. Most notable among these:
- Arizona grew 1.7 MW in Q3, up 11% quarter-over-quarter, amidst uncertainty surrounding net energy metering regulations in the state and dwindling state-level incentives.
- California grew 17.6 MW to add 99 MW in Q3, up 22% over last quarter. We anticipate a strong quarter in Q4 as well, potentially making California the first state to install over 100 MW of residential solar in a single quarter.
New Jersey and Hawaii, both historically ranked among the strongest residential markets, slowed in Q3 and accounted for a combined 7.8 MW of reduced installations from last quarter.
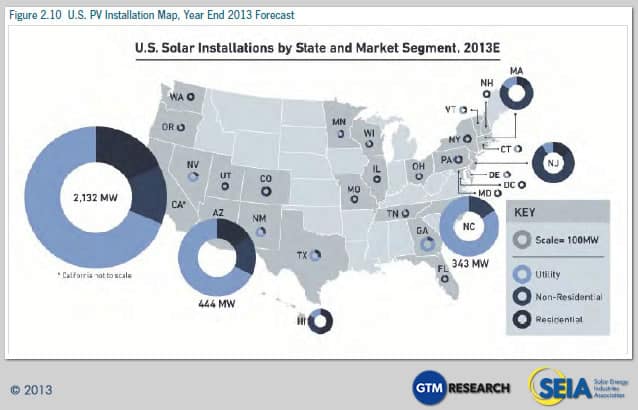
Note: Quarterly installations and forecasts for 28 states available in the full report
2.1.4. Residential Third-Party Ownership
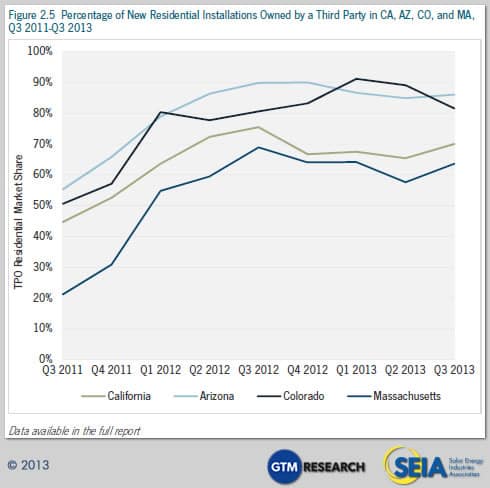
In most mature state markets, third-party-owned (TPO) residential PV systems continue to represent an attractive option for many homeowners.
Arizona, California, and Massachusetts saw TPO market share rebound in Q3 2013, yet in all three states, TPO remains below its peak in the second half of 2012. Arizona’s TPO market share saw a minimal uptick that can be attributed to national TPO providers rushing to install systems amidst impending net metering uncertainty in Q4 2013. Meanwhile, some Arizona installers report that a rebound in the housing market has led to an increased number of systems being financed through mortgages and home equity loans. In Massachusetts, regional banks are now providing loans to homeowners for the purchase and installation of solar systems. In California, TPO market share increased but remains below its 2012 peak due to the increased availability of residential solar loans and PACE financing. Lastly, Colorado saw a 7.5% downturn in TPO market share as Solar*Rewards incentives for TPO systems have dropped by half relative to Q1 2013.
2.1.5. Non-Residential
The non-residential market’s slow year continued in Q3 with fewer installations on both a quarterly and annual basis. Only nine of our 28 tracked states saw a quarterly increase in non-residential installations. Two of those states are the same markets that showed strong residential growth: Arizona and California. Additionally, Massachusetts’ non-residential market had a strong Q3, with 62% quarterly growth. Meanwhile, the downturns in New Jersey and Hawaii hit the non-residential market as well, with New Jersey shrinking by more than 30 MW relative to Q2.
It is worth noting that this trend would look quite different if we were using different criteria to define the non-residential market. Our definition, which classifies non-residential projects as those on the customer side of the meter with a retail, non-residential power purchaser, does not include the so-called wholesale distributed generation segment – generally defined as projects on the utility side of the meter that are under 20 MW. Although 2013 has been a slow year for non-residential projects, it has been a banner year for wholesale DG, thanks largely to a booming market for 1 MW to 5 MW projects in North Carolina.
In fact, the wholesale DG market accounted for a total of 164 MW in the first three quarters of 2013, up from 98 MW during the same period in 2012.
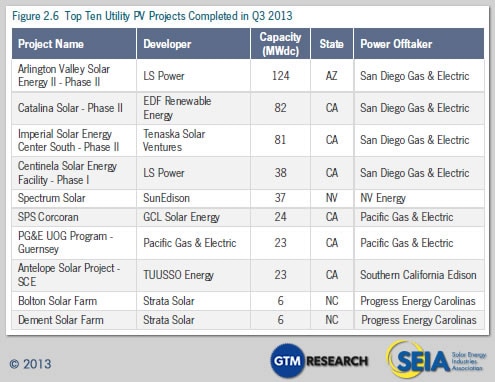
2.1.6. Utility
There were 52 utility PV projects completed in Q3 2013, totaling 539 MW of capacity. As usual, the majority of the large projects came from California, but one 37 MW project was completed in Nevada by SunEdison. Pipeline replenishment was minimal as the contracted pipeline of projects increased from 12.1 GW to 12.6 GW, of which 4.3 GW is currently in construction with expected completion in the next two to three years.
2.2. Full Report Excerpt
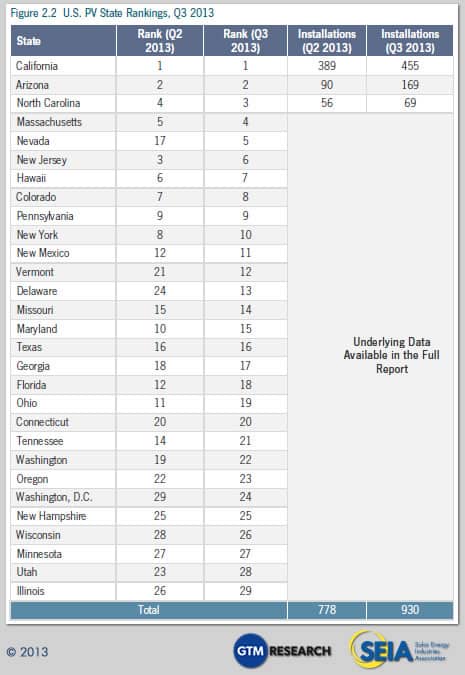
This section showcases an abbreviated sample of the type of state-specific information available in the full U.S. Solar Market Insight report, available for purchase through GTM Research with discounted rates for SEIA members.
2.2.1. Arizona: Market Rebounds Amidst Net Metering Reforms
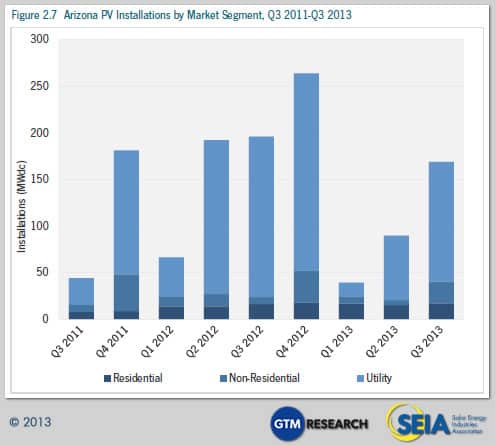
The Arizona solar market experienced a major rebound in Q3 2013. This resurgence is linked to both the drawn-out development cycles for large-scale commercial installations and the first wave of residential projects pushed through to completion under the outgoing net metering policy.
Within the residential market, two key drivers of growth include installers keeping up with the lower upfront rebates and the first of two waves of demand pull-in, brought on by Arizona Public Service’s (APS) push to revamp net energy metering (NEM). Earlier in the summer, APS proposed that the Arizona Corporation Commission (ACC) either introduce monthly fixed charges for residential NEM customers, or replace NEM altogether with a bill credit based on wholesale electricity rates. Equally important, APS proposed to grandfather new residential systems in under the current NEM scheme with interconnection applications submitted by October 15, 2013. In response, installers rushed to secure deals before the tentative mid-October deadline, as evidenced by the depletion of all funding for residential rebates by late September.
Q3 2013’s moderate uptick in the residential market to 16.9 MW installed is ultimately a prelude to even larger growth throughout the next six months due to the ACC’s final ruling on NEM rules for 2014. Key highlights of the decision include the following:
- Residential solar customers who have signed a contract with an installer and submitted an interconnection application to APS by December 31, 2013 will be grandfathered in under current NEM rules for the next twenty years.
- Beginning on January 1, 2014, new solar customers must pay $0.70/kW per month, which amounts to a $4.90 average monthly fee that falls well below APS’ original proposal. The fee will remain in effect until the results of the next rate case proceeding take effect, which will be filed in 2015.
Given the ACC’s ruling, our bullish near-term outlook for the residential market reflects installers rushing to land customers both before APS’ proposed October 15 deadline and before the ACC’s official December 31 deadline to grandfather systems in under current NEM rules.
2.3. System Prices
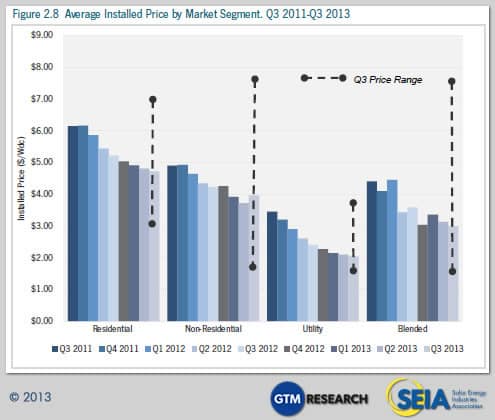
Q3 2013 saw continued average installed price declines across all market segments in the U.S. compared to one year ago.
Quarter over quarter, the national average system price declined by 4.2%, falling from $3.13/W to $3.00/W, while dropping 16.4% from $3.59/W one year ago. This capacity-weighted number is heavily impacted by the volume of utility-scale solar installed in a given quarter. For the second straight quarter, utility PV capacity accounted for more than half of all new capacity installed, and for that reason, had a relatively larger impact on the blended average system price. Individually, the residential and utility segments saw price decreases on a quarter-over-quarter basis, while the non-residential market increased quarter-over-quarter. (It should be noted that prices reported in this section are weighted averages based on all systems that were completed in Q3 across many locations and that the weight of any individual location can influence the average.)
- From Q3 2012 to Q3 2013, residential system prices fell 9.7% percent, from $5.22/W to $4.72/W. Quarter over quarter, installed costs declined by 2% percent. Installed prices came down in most major residential markets including California, Arizona, and New Jersey.
- Non-residential system prices fell 6.1% percent year-over-year, from $4.22/W to $3.96/W. Although quarter-over-quarter installed costs increased by 6.5%, the Q3 national weighted average masks quarterly reductions seen in most established state markets, which ranged from 2% to 10%.
- Utility system prices once again declined quarter-over-quarter and year-over-year, down from $2.40/W in Q3 2012 and $2.10/W in Q2 2013, settling at $2.04/W in Q3 2013.
On the whole, however, installed PV prices vary greatly not only state to state, but also project to project. Common residential system prices ranged from less than $3.00/W to just above $7.00/W. Non-residential prices hit levels as low as $1.85/W and as high as $7.75/W. Utility prices also display high variability: a 50-MW-plus fixed-tilt installation will be significantly less expensive than a 1 MW pilot project that employs dual-axis tracking. (Note that the lowest installed cost of power does not necessarily yield the lowest levelized cost of energy, an important metric for measuring project returns, due to factors such as differing amounts of sunlight striking the exact same type of solar system installed in different geographic regions.)
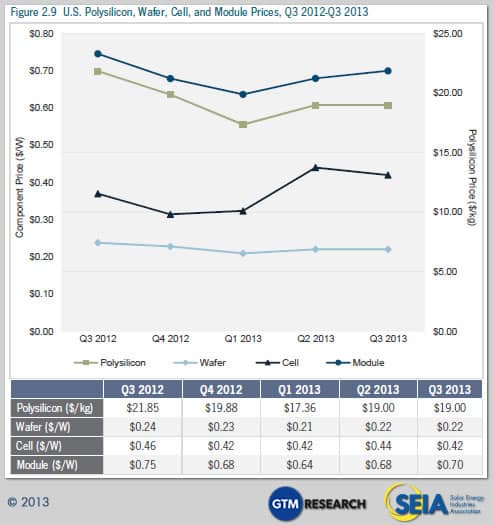
2.4. Component Pricing
2.4.1. Polysilicon, Wafers, Cells and Modules
Pricing for polysilicon and PV components was stable in Q3 2013 due to strong demand pickup from Japan, the EU, and China, as well as a more consolidated supply chain. Blended polysilicon prices stayed flat at $19/kg, while Tier 1 Chinese delivered module ASPs were up to $0.70/W, 3% higher than Q2 2013 levels of $0.68/W.
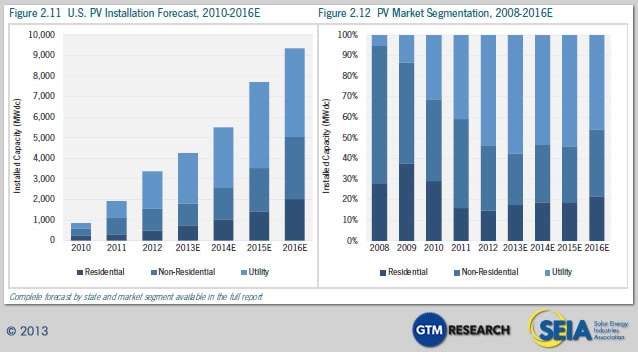
2.5. Market Outlook
This quarter, our 2013 forecast has been revised slightly downward from 4,372 MW to 4,268 MW. While the residential forecast remains essentially unchanged and the utility forecast is up slightly, the non-residential forecast has been reduced by 70 MW. Overall, our forecast calls for significant growth across market segments in Q4 – an aggressive forecast that has been borne out in previous years but remains dependent on a number of positive factors remaining in place. If there is risk to our Q4 forecast, it is likely to the downside and we will be closely monitoring the market to determine whether a downward revision is necessary.
Our forecasts in later years remain largely the same at a high level, though we have increased our expectations for utility project completions in 2015 and 2016 due to further visibility into the project pipeline.
3. Concentrating Solar Power
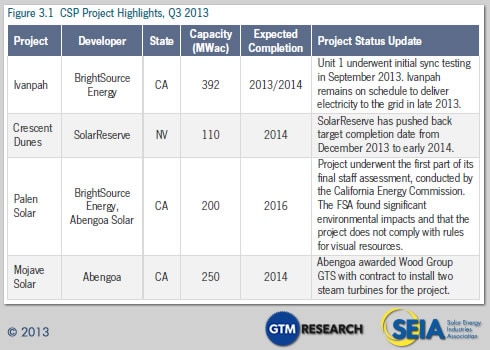
BrightSource Energy’s Ivanpah project continues to dominate market news in the concentrating solar power industry in Q3 2013. The CSP project is on schedule to deliver electricity to the grid in late 2013 and full operation in late 2013/early 2014.
A few additional developments are notable outside of the Ivanpah projects, including:
- SolarReserve delayed its Crescent Dunes project’s expected date of completion to 2014
- Wood Group GTS will construct two steam turbines for the Mojave Solar Project
- The Palen Solar project confronts new challenges with respect to permitting after a less than favorable impact study conducted by the California Energy Commission
- Abengoa Solar’s 280 MWac Solana project achieved commercial operation in October 2013
About
U.S. Solar Market Insight® is a quarterly publication of GTM Research and the Solar Energy
Industries Association (SEIA)®. Each quarter, we collect granular data on the U.S. solar market from nearly 200 utilities, state agencies, installers, and manufacturers. This data provides the backbone of this Solar Market Insight® report, in which we identify and analyze trends in U.S. solar demand, manufacturing, and pricing by state and market segment. We also use this analysis to look forward and forecast demand over the next five years.
* References, data, charts or analysis from this executive summary should be attributed to “SEIA/GTM Research: U.S. Solar Market Insight®.”
* Media inquiries should be directed to Mike Munsell ([email protected]) at GTM Research and Ken Johnson ([email protected]) at SEIA.
* All figures sourced are from GTM Research. For more detail on methodology and sources, visit www.gtmresearch.com/solarinsight.
AUTHORS
GTM Research:
Shayle Kann, Vice President
Shyam Mehta, Senior Analyst
MJ Shiao, Senior Analyst
Cory Honeyman, Solar Analyst
Nicole Litvak, Solar Analyst
Jade Jones, Solar Analyst
SEIA:
Justin Baca, Director of Research
Will Lent, Research & Policy Analyst
Shawn Rumery, Research Associate
Our coverage in the U.S. Solar Market Insight reports includes 28 individual states and Washington, D.C. However, national totals reported include all 50 states, Washington, D.C., and Puerto Rico.