Solar Market Insight Report 2013 Q2
Executive Summary
U.S. Solar Market Insight® is a quarterly publication of GTM Research and the Solar Energy Industries Association (SEIA)®. Each quarter, we survey nearly 200 utilities, state agencies, installers, and manufacturers to collect granular data on the U.S. solar market. This data provides the backbone of this Solar Market Insight® report, in which we identify and analyze trends in U.S. solar demand, manufacturing, and pricing by state and market segment. We also use this analysis to look forward and forecast demand over the next five years. Get the full report
Key Findings
Photovoltaics (PV and CPV)
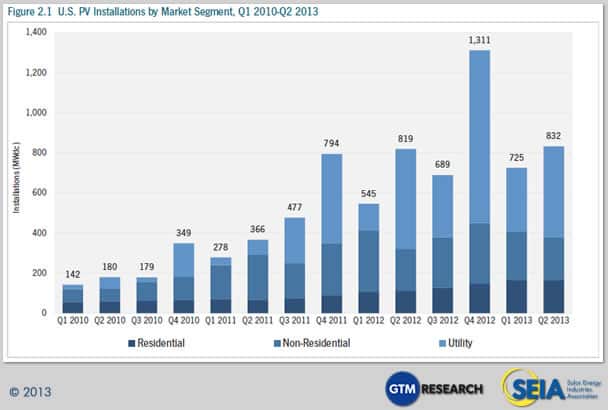
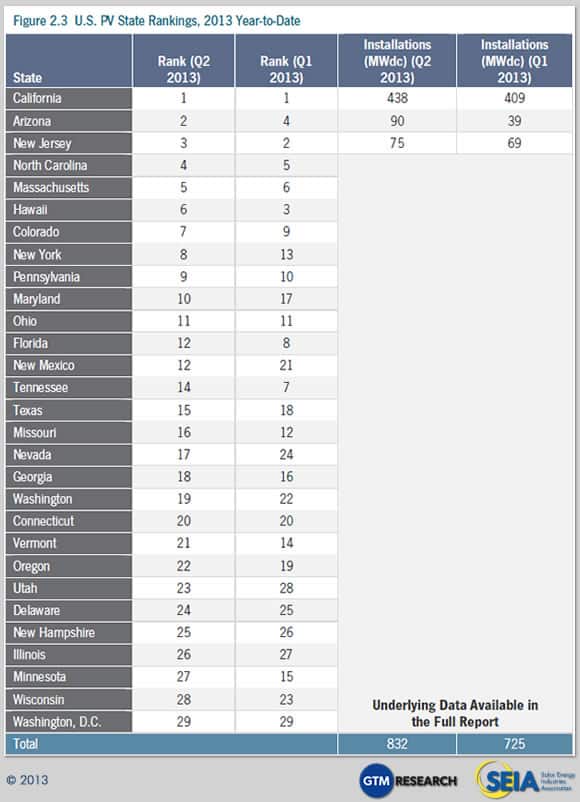
- Photovoltaic (PV) installations totaled 832 MW in Q2 2013, up 15% over Q1 2013
- Cumulative operating PV capacity in the U.S. now stands at 8,858 MW
- The residential market was flat quarter-over-quarter in Q2, breaking its streak of incremental quarterly growth
- The non-residential market was down in Q2, continuing a relatively light year for the segment
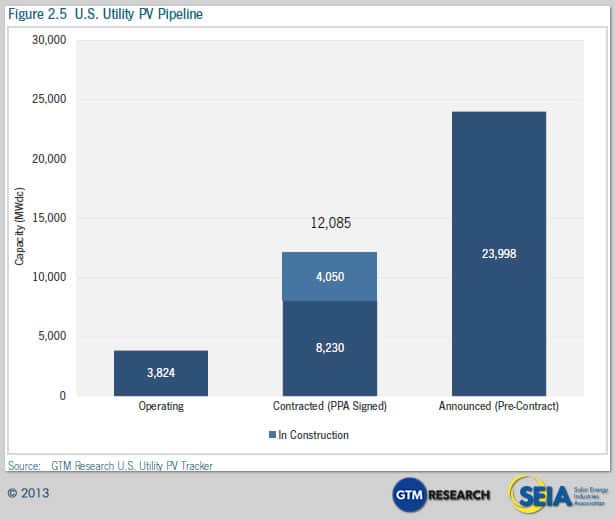
- The utility segment completed 38 projects totaling 452 MW; currently, there are an additional 4.1 GW of utility PV under construction
- We anticipate that 4.4 GW of PV will be installed in 2013, up 30% over 2012
- The average residential PV system prices fell to $4.81/W, while the average non-residential system price dropped to $3.71/W
Concentrating Solar Power (CSP)
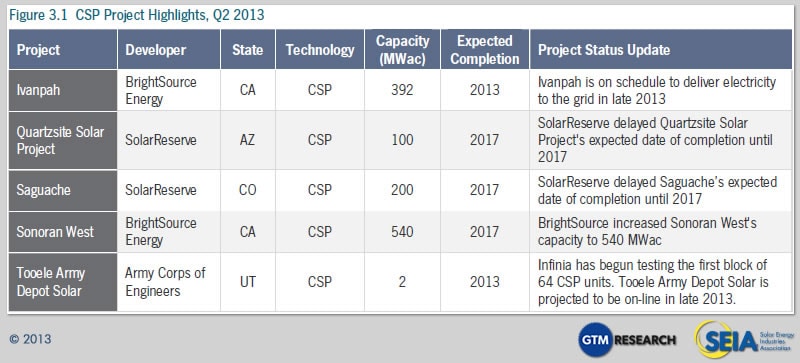
- Despite zero CSP installations in Q2 2013, we maintain bullish expectations for 2013 with over 900 MWac slated to come on-line by the end of this year
- BrightSource Energy’s 392 MWac Ivanpah CSP project is on schedule to deliver electricity to the grid in late 2013
1. Introduction
In 2013, the U.S. solar market will achieve a number of significant milestones. Among them:
- Over 100,000 individual solar systems will be installed by year’s end
- Cumulative installed solar photovoltaic (PV) capacity will surpass 10 gigawatts
- The U.S. share of global solar installations will reach a high of 13%, up from 5% in 2008
- A solar project will be installed, on average, every four minutes in the U.S.
All these achievements are a result of a continually growing market. We forecast that 4.4 GW of PV and 912 MW of concentrating solar power (CSP) will be installed in 2013, up from 3.4 GW of PV and zero CSP in 2012. Still, the market is not without uncertainty. We identify three key developments that present risks for the market moving forward:
- Net Energy Metering and Rate Design Battles: Across a number of states, solar companies and advocates are engaged in discussions and, in some cases, skirmishes with utilities over the future of net energy metering (NEM), a process through which owners of distributed generation (DG) solar systems may sell excess electricity back into the grid. NEM is the backbone of DG deployment in the U.S. The fundamental question at hand is how to appropriately value DG in order to properly compensate DG system owners, while maintaining grid reliability and fair pricing for all ratepayers. The next twelve months will be vital in determining the outcome of these debates, as regulators and policymakers in a number of key states (particularly Arizona and California) will make decisions impacting the future of NEM. The importance of this issue cannot be overstated, especially for the residential solar market, as the outcomes will strongly impact state markets for years to come.
- Non-Residential PV’s Tepid Growth: Despite strong overall growth figures for solar in the U.S., the commercial (or non-residential) market has been slow thus far in 2013. Over the first half of the year, the non-residential market shrank 11% relative to the same period in 2012. Although some of this downturn can be attributed to specific large state markets (such as New Jersey) cooling off, the non-residential market has generally been slow across most state markets. While we anticipate a resumption of growth in the second half of the year led by states such as New York and California, the commercial segment will need to gain steam in order to meet most market participants’ expectations.
- The Reduction in Utility Solar Procurement: Deployment figures in the utility solar market continue to impress, and we anticipate a record year in 2013 with over 2.4 GW of utility PV and 912 MW of CSP installed. However, utilities in a number of key states (most notably California) have slowed down their procurement of power from new solar projects, leaving some developers with stranded early-stage assets. Whereas the bulk of signed power purchase agreements (PPAs) to date have been driven primarily by state renewable portfolio standards (RPS), the next wave will likely need to be driven by cost-competitiveness. So the question for the U.S. utility solar market is when utilities will begin to consider centralized solar a viable, economic source of generation. Some developers argue this transition has already begun, while others anticipate a slow ramp over the course of a decade or more.
In spite of these potential risks, we remain bullish on the near-term prospects of the U.S. solar market. Our forecast calls for solar installation levels to continue to grow across market segments and most states through 2016, ultimately rising above 9 GW in annual installations and over 1 million cumulative installations.
2. Photovoltaics
Photovoltaics (PV), which convert sunlight directly to electricity, continue to be the largest component of solar market growth in the U.S.
2.1 Installations
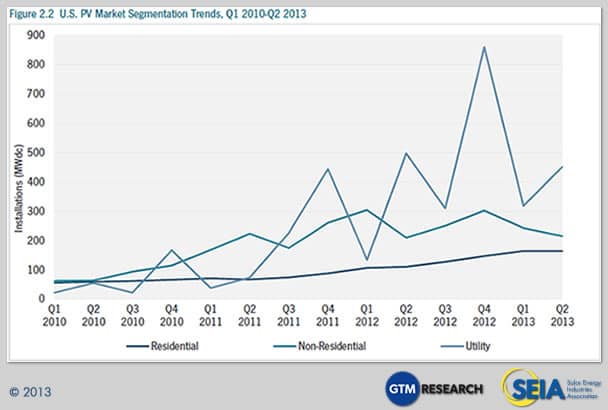
The U.S. installed 832 MW of PV in Q2 2013. This represents 15% growth over Q1 2013 and a 1.5% increase from Q2 2012. As always, it is important to consider each market segment individually when seeking meaningful conclusions regarding the U.S. solar market. In this light, the residential market remained flat quarter-over-quarter, the commercial market shrank 11%, and the utility market grew 42%. It is worth noting that Q2 is often somewhat lumpy, particularly in the commercial market – for example, the commercial market shrank 30% in Q2 2012 but grew 33% in Q2 2011. Overall, Q2 2013 was somewhat softer than expected, but anecdotal evidence combined with preliminary data suggest that Q3 will be substantially stronger.
2.1.1 Residential
The residential market experienced a slight hiccup in Q2 2013, breaking its streak of incremental quarterly growth with a flat quarter. Still, the market both within and among states remained relatively consistent. Notable state trends included:
Arizona: Down 8% from Q1 2013. We anticipate a stronger second half as installers rush to complete projects ahead of potential net metering revisions.
California: Up 4% over Q1 2013. Despite the end of California Solar Initiative incentives, the CA residential market continues to thrive and the outlook remains strong, pending changes to rate design and net metering.
Hawaii: Down 18% from Q1 2013. Developers in Hawaii report more difficulty in this market in 2013 as a combined result of changes to building permit fees and the state PV tax credit, as well as the increasing saturation of some key geographies.
2.1.2 Residential Third-Party Ownership
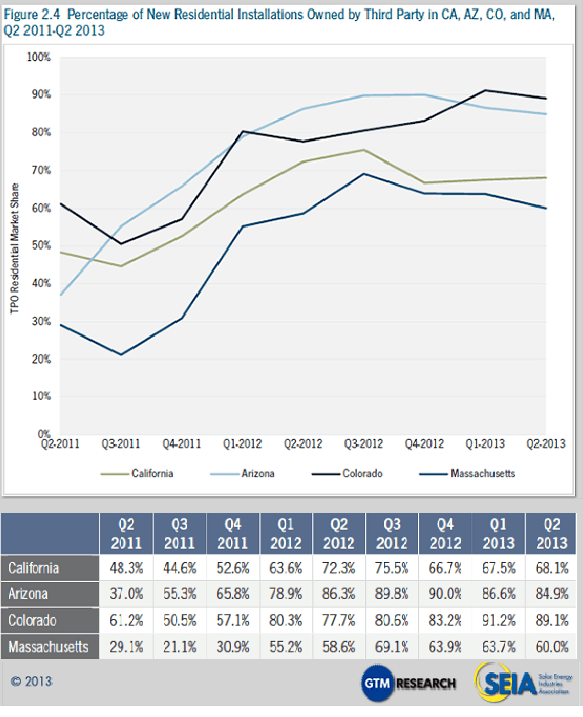
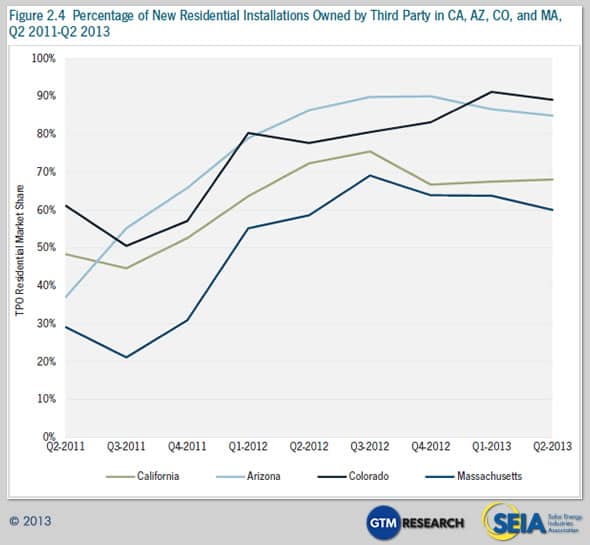
In most mature state markets, third-party-owned (TPO) residential PV systems continue to prove an attractive option for many homeowners.
For the last three quarters, Arizona and Massachusetts have experienced a slight reversal of TPO market share growth. In Arizona, some players report that a rebound in the housing market has led to an increased number of systems being financed through mortgages and home equity loans. In Massachusetts, regional banks are now providing loans to homeowners for the purchase and installation of a solar system. In California, TPO market share increased, although it is well below the state’s 2012 peak due to increased availability of both residential solar loans and PACE financing. Lastly, Colorado saw a slight downturn in TPO market share, but the state remains the national leader at 89%.
As the TPO residential space matures, there are a number of companies that have emerged as market leaders. These companies are increasing the rate at which they deploy systems, which allows for the negotiation of better equipment supply contracts and access to lower cost of capital, which is critical as state-level incentives are threatened or changed in some states.
A major factor that will impact the viability of the TPO business model is the role utilities will play in the distributed generation (DG) market. It is still possible that utilities may enter the residential PV market, offering existing customers discounts on retail rates by owning and operating residential systems themselves. Some utilities have already invested in project finance funds created by TPO providers or have directly invested equity in these companies, but generally through the utilities’ unregulated independent power producer (IPP) arms. In turn, utility investment in DG provides more opportunities for market growth across the U.S. because of utilities’ access to and business relationships with existing customers.
At the state level, there is a proposal under Massachusetts’ SREC II program aimed at increasing residential direct ownership market share. The proposal qualifies a homeowner that owns a PV system to sell the first ten years of SRECs within the first three years of commercial operation, effectively turning bundled SRECs into an upfront rebate.
The addressable residential market is still massive compared to the number of customers that have gone solar, leaving an enormous opportunity for growth, and no single strategy to deliver systems to residential rooftops has proven dominant. In the near term, it is expected that TPO PV systems will continue to drive the residential market. Looking toward 2014, however, it can be expected that there will be a myriad of entrants into the residential value chain as either financiers, service providers, or both.
2.1.3 Non-Residential
The non-residential market has been slow in the first half of 2013 across many states. In Q2, only thirteen out of the 28 states we track showed quarterly growth in the non-residential market. Among those, the only major state market was California. The slowdown in growth within the non-residential sector is due to the confluence of several established state markets hitting a downturn simultaneously. This downturn can be traced to regulatory uncertainty issues, interconnection hurdles, and the elimination of or reduction to state level incentives. Most notably, non-residential installations dropped in Massachusetts due to uncertainty surrounding the Solar Credit Clearinghouse Auction, in Arizona due to the removal of performance based incentives for commercial projects in APS territory, and in Hawaii due to more commercial projects needing interconnection studies. Meanwhile, we expect the second half of 2013 will see higher growth rates from established state markets including California and New York and emerging state markets such as Georgia. View the top brands going solar>>
2.1.4 Utility
There were 38 individual utility PV projects completed in Q2 2013 totaling 452 MW of new installed generating capacity. All ten of the largest projects completed were installed in either California or Arizona, reflecting the utility market’s continued dependence on a few key state markets. Meanwhile, the utility PV pipeline grew marginally in Q2, reaching 12.1 GW of projects with PPAs in place and 4.1 GW of projects currently under construction.
2.1.5 Full Report Excerpt | California: Growth Continues Beyond the California Solar Initiative
This section showcases a sample of the type of state specific information available in the full U.S. Solar Market Insight report available for purchase through GTM Research with discounted rates for SEIA members.
Note: Historical and forecasted installation figures by state and by market segment, as well as state-by-state market analysis, are available in the full report
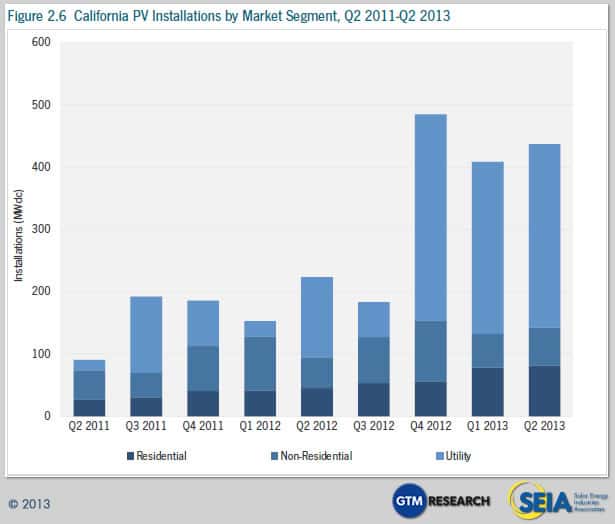
California’s PV market has seen continued growth amidst the dwindling incentives offered by the California Solar Initiative. Q2 2013 ranks as the strongest second quarter in the state’s history, with installations up 78% in the residential market and 26% in the non-residential market year-over-year. For residential and non-residential projects, higher retail rates have enabled project developers to secure a growing number of customers based purely on net metering (NEM), the federal 30% Investment Tax Credit, and accelerated depreciation.
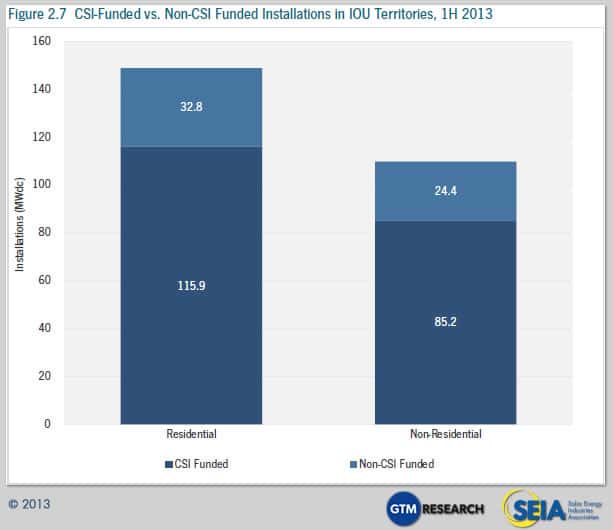
In the residential market, utilities PG&E and SDG&E are both no longer accepting California Solar Initiative (CSI) applications for residential projects. On the non-residential side, rebates remain available at levels ranging from $0.025 to $0.044/kWh for commercial projects and $0.088 to $0.150/kWh for government/nonprofit projects depending on the utility. As CSI nears planned completion across the IOU territories, Figure 2.7 reveals that a significant portion of projects are being installed without state-level rebates. Over 20% of installations have forgone incentives in both the residential and non-residential market segments during the first half of 2013.
The following trends are likely to emerge in the second half of 2013:
- Incremental growth in residential installations as CSI incentives end as planned
- A spike in non-residential installations in Q4 and then normalization of demand after installers rush through projects to take advantage of remaining CSI incentives
Amidst the diminishing role of state-level incentives, the market’s focus has shifted to California’s ongoing discussion over rate design and NEM reforms outlined in the state assembly bill, AB 327.
While some solar advocates have opposed the bill’s proposal to flatten the tiered electricity rates from five to as few as two (which would negatively impact the value proposition of net metering), recent amendments to the bill’s plans for NEM have garnered support from the majority of solar advocates. First, the current NEM tariff will remain in place through the earlier date of July 1, 2017 or when each utility hits a pre-defined capacity cap. Equally important, the bill sets in place a process through which the CPUC will introduce a new, uncapped NEM program to take effect when the current one expires.
The bill, if passed, would carry national implications because of California’s stature as the largest and most mature solar market, and its status as a policy proving ground for others to follow or learn from. However, the heated debate in California regarding the true value of solar will play out over the next two years.
2.2 Installed Price
Q2 2013 saw continued average installed price declines across all market segments in the U.S.
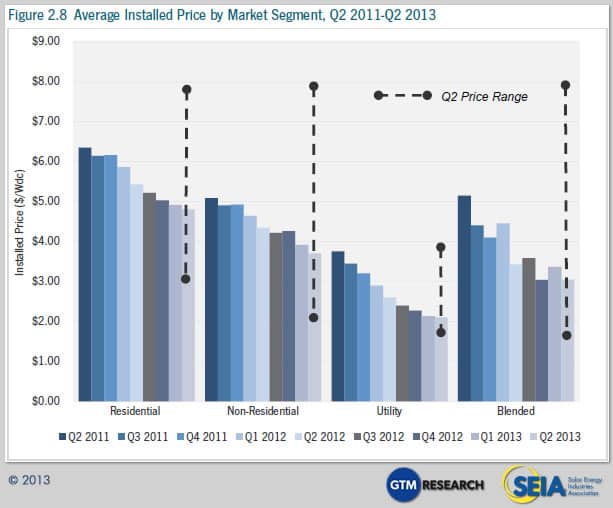
Quarter-over-quarter, the national average price declined by 9.3% from $3.36/W to $3.05/W, while dropping 11.1% from $3.43/W one year ago. This capacity-weighted number is heavily impacted by the volume of utility-scale solar installed in a given quarter. Since utility PV capacity accounted for 54% of installations in Q2 2013, but only 44% last quarter, utility PV had a relatively larger impact on the blended average system price. Individually, the residential, non-residential, and utility segments all saw price decreases quarter-over-quarter. (It should be noted that prices reported in this section are weighted averages based on all systems that were completed in Q2 across many locations.)
- From Q2 2012 to Q2 2013, residential system prices fell 11.5% percent, from $5.43/W to $4.81/W. Quarter-over-quarter, installed costs declined by 2.2% percent. Installed prices came down in most major residential markets including California, Arizona, and New Jersey. As described below, residential prices vary significantly from state to state, in part due to the maturity of the state’s solar market. It was not uncommon for final installed prices to be in the $4.00/W range.
- Non-residential system prices fell 14.7% percent year-over-year, from $4.35/W to $3.71/W, while quarter-over-quarter, installed costs decreased by 5.4%. States with SREC markets, such as New Jersey and Delaware, saw significant price declines since installers must continue to keep margins razor-thin given low SREC prices. Also of note, Pennsylvania’s non-residential system prices dropped by 13% quarter-over-quarter amidst its own fledgling SREC market and a state rebate program set to expire at the end of 2013.
- Utility system prices once again declined quarter-over-quarter and year-over-year, down from $2.60/W in Q2 2012 and $2.14/W in Q1 2013, settling at $2.10/W in Q2 2013. This relatively small price decline is linked to the disproportionately higher number of smaller projects coming on-line in Q2 2013 compared to last quarter, resulting in a relatively smaller drop-off in system prices.
On the whole, however, installed PV prices vary greatly not only state to state, but also project to project. Figure 2.8 displays this wide range of installed prices in Q2 2013. Common residential system prices ranged from less than $3.00/W to almost $8.00/W. Non-residential prices hit levels as low as $2.00/W and as high as $8.00/W. Utility prices also display high variability: a 50-MW-plus fixed-tilt installation will be significantly less expensive than a 1 MW pilot project that employs dual-axis tracking. (Note that the lowest installed cost of power does not necessarily yield the lowest levelized cost of energy, an important metric for measuring project returns, due to factors such as differing amount of sunlight striking the exact same type of solar system installed in different geographic regions.)
2.3 Component Pricing
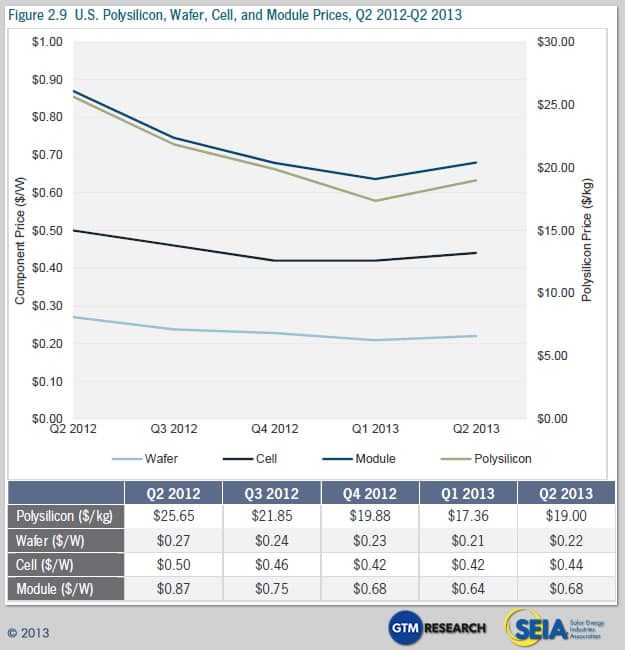
Pricing for polysilicon and PV components increased for the first time in more than two years in Q2 2013 due to strong demand pick-up from Japan, the EU, and China and a more consolidated supply chain. Blended polysilicon prices increased by 9% to $19/kg, while blended module ASPs for Q2 were up to $0.68/W, 7% higher than Q1 2013 levels of $0.64/W. Module pricing in particular was affected by increasing prices for Taiwanese cells, some of which are purchased by Chinese module suppliers for use in U.S.-bound products in order to avoid import duties on Chinese cell production. Module pricing has already climbed further to levels of around $0.70/W in Q3 2013.
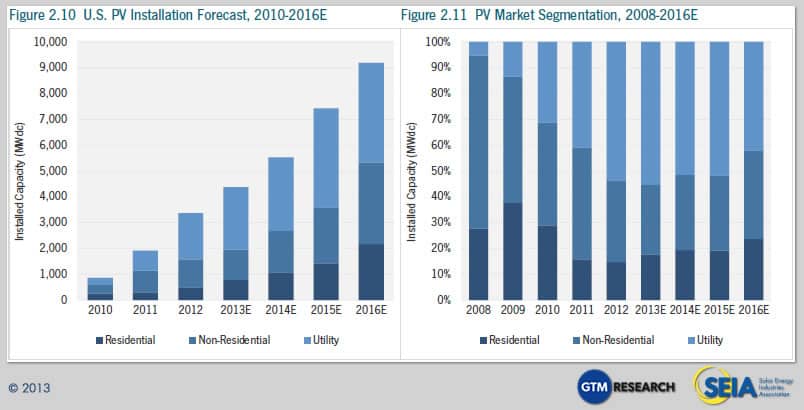
2.4 Market Outlook
Our overall forecasts have remained relatively steady this quarter. For 2013, our total U.S. forecast has stayed unchanged due to a slower-than-expected commercial market but stronger-than-expected utility market in Q2 2013. In contrast with the more volatile commercial and utility market segments, our residential forecast for 2013 remains steady. In the second half of 2013, our highest expectations for growth lie in the California and Arizona residential markets and in the California, Massachusetts and New York commercial markets. The only notable forecast revision has to do with utility project timelines, whose updates have led to a more bullish 2014-2015 forecast and a slightly more bearish 2017. We continue to expect the residential market to increase its share of the market over the next few years, while remaining smaller than both other market segments.
3. Concentrating Solar Power
BrightSource Energy’s Ivanpah project continues to dominate market news in the concentrating solar power industry in Q2 2013. Phase 1 of the project is more than 95% complete. Units 2 and 3 are more than 92% and 89% complete, respectively. The entire project is projected to come on-line by Q4 2013, and the first phase is expected to be operational in the late summer of 2013.
A few additional developments are notable outside of the Ivanpah projects, including:
- The capacity (MWac) of BrightSource’s Sonoran West project was increased to 540 MWac
- SolarReserve delayed its Saguache project’s expected date of completion to 2017
- The Quartzsite Solar Project, developed by SolarReserve, is now expected to be completed in 2017