U.S. Solar Market Insight 2012 Year in Review
U.S. Solar Market Insight® is a quarterly publication of GTM Research and the Solar Energy Industries Association (SEIA)®. Each quarter, we survey nearly 200 utilities, state agencies, installers, and manufacturers to collect granular data on the U.S. solar market. This data provides the backbone of this Solar Market Insight® report, in which we identify and analyze trends in U.S. solar demand, manufacturing, and pricing by state and market segment. We also use this analysis to look forward and forecast demand over the next five years.
View more resources like the press release, infographic and webinar>>
Introduction
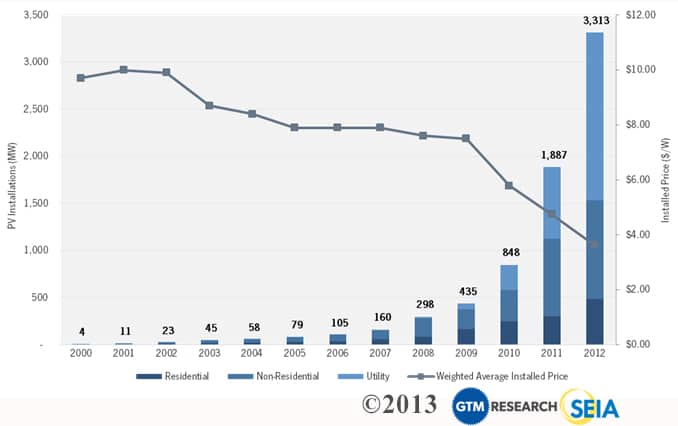
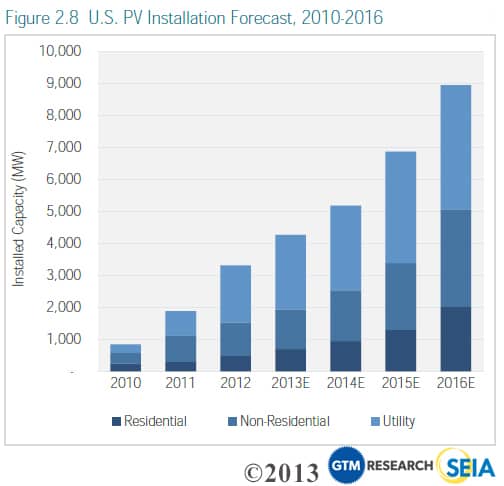
2012 was a historic and busy year for the U.S. solar market. Photovoltaic (PV) installations grew 76% over 2011, to total 3,313 megawatts (MW) in 2012, with an estimated market value of $11.5 billion. Each market segment (residential, non-residential, and utility) showed growth over 2011, while the overall marketsin most U.S. states expanded as well. Installed prices for PV systems fell 27% during 2012 and at least 13% in each market segment. Nearly 83,000 homes installed solar PV, and cumulative PV installations in the U.S. surpassed 300,000.
Apart from installation growth, four trends and events strongly shaped the market in 2012:
- Trade Dispute Resolution: The U.S. government concluded its investigation of Chinese PV cell imports to the U.S., which resulted in the creation of tariffs on these cells. Although the ultimate impact of this decision is difficult to gauge, Chinese module shipments to the U.S. decreased significantly. PV prices, however, continued to fall. Meanwhile, global trade tensions continue and ongoing investigations in Europe and China could result in new tariffs.
- Ongoing Manufacturing Consolidation: PV manufacturers saw little relief from global oversupply in 2012 as manufacturer margins remained depressed and less-competitive facilities were shuttered around the world.
- The Third-Party-Owned (TPO) Residential Solar Revolution: Residential solar leases and power purchase agreements (PPAs) continued to gain popularity throughout 2012. Third-party-owned systems accounted for over 50% of all new residential installations in most major residential markets, with Arizona topping 90%. New vendors entered the space to provide unique twists on the business model or offer ancillary services such as customer lead generation. GTM Research forecasts that the third-party-owned residential solar market will maintain its momentum and become a $5.7 billion market by 2016.
- Mega-Scale Solar Coming to Fruition: After years of announcements and preliminary milestones, the first wave of truly utility-scale solar came on-line in 2012. Eight of the ten largest PV projects operating today were completed in 2012, some of which were recipients of the DOE Loan Guarantee program. This trend should continue in 2013, with more than 4,000 MW of utility solar projects currently under construction and more than 8,000 MW of projects with PPAs in place and yet to begin construction.
One trend already apparent in 2013 is diversification in project financing. Market participants have laid the groundwork for a variety of new ways to finance solar projects. Some of these have been introduced already and now need to scale, while others will become a reality for the first time this year. Examples of such structures include solar real estate investment trusts (REITs), crowdfunded solar projects, securitized solar assets, and solar inclusion in master limited partnerships (MLPs).
Key Findings

Photovoltaics (PV)
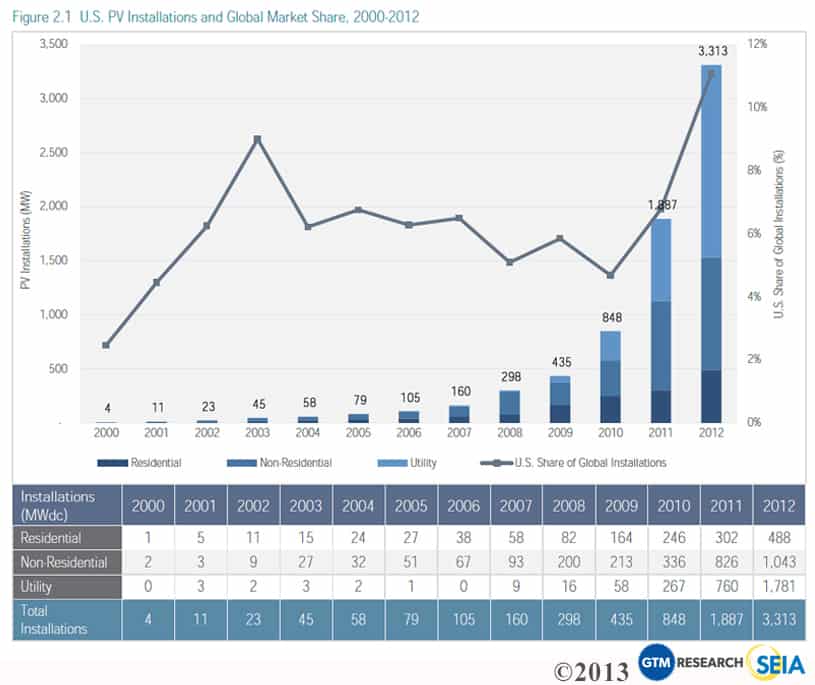
- Annual U.S. PV installations grew 76% in 2012 to reach 3,313 MW.
- The U.S. accounted for 11% of all global PV installations in 2012, its highest market share in at least fifteen years.
- Cumulative PV capacity operating in the U.S. as of the end of 2012 stood at 7,221 MW.
- Eight of the ten largest PV projects currently in operation in the U.S. were completed in 2012.
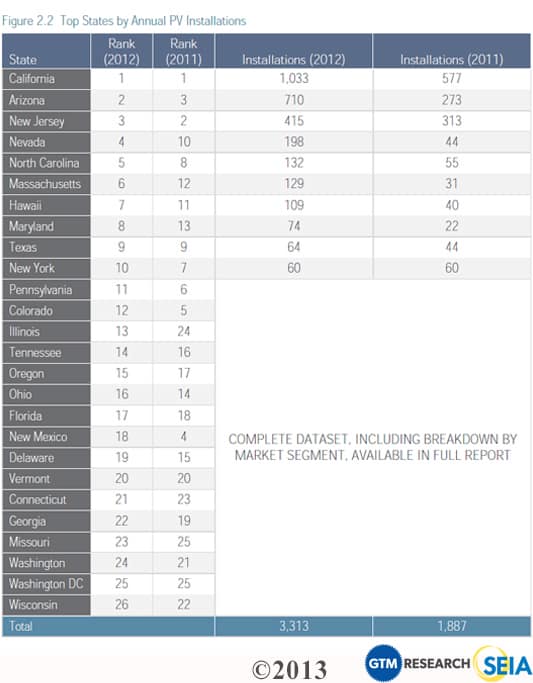
- Eleven states installed over 50 MW each in 2012, up from eight in 2011.
- There were over 90,000 PV installations in 2012 in the U.S., including 83,000 in the residential market alone.
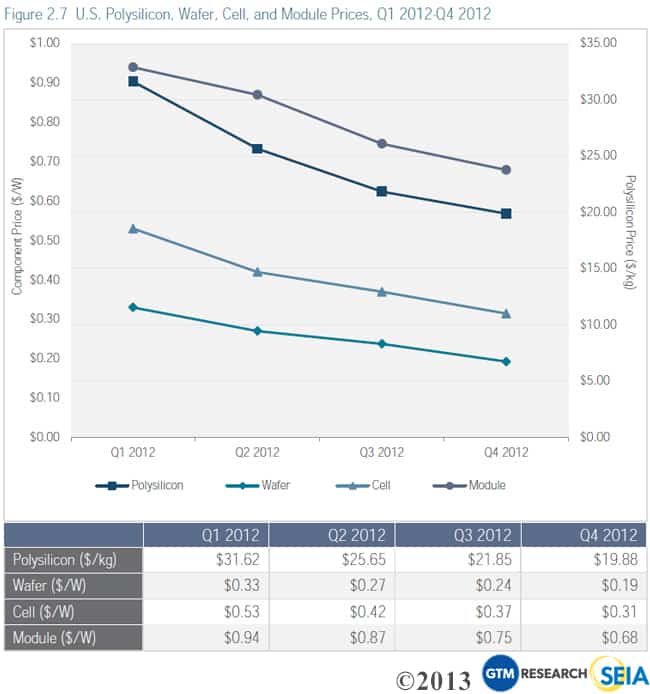
- The blended average sales price for PV modules for Q4 2012 was $0.68/W, a staggering 41% below the Q4 2011 price of $1.15/W.
- Weighted average U.S. PV system prices fell 27% in 2012, to $5.04/W in the residential market, $4.27/W in the non-residential market, and $2.27/W in the utility market by the end of 2012.
- We forecast the U.S. market to grow 30% in 2013 with 4.3 GW of new PV installations anticipated during 2013 across all market segments.
Concentrating Solar Power (CSP and CPV)
- Cogentrix’s 30 MW concentrating PV (CPV) Alamosa Solar project came online.
- All phases of BrightSource’s 392 MW Ivanpah project are on track to come on-line in 2013.
- Abengoa’s 280 MW Solana Generating Station is over 80% complete and is on track to be online in 2013.
- Construction of the Power Tower at SolarReserve’s 110 MW Crescent Dunes Solar Energy Project was completed.
Photovoltaics (PV)
Photovoltaics (PV), which convert sunlight directly to electricity, continue to be the largest component of solar market growth in the U.S.
Installations
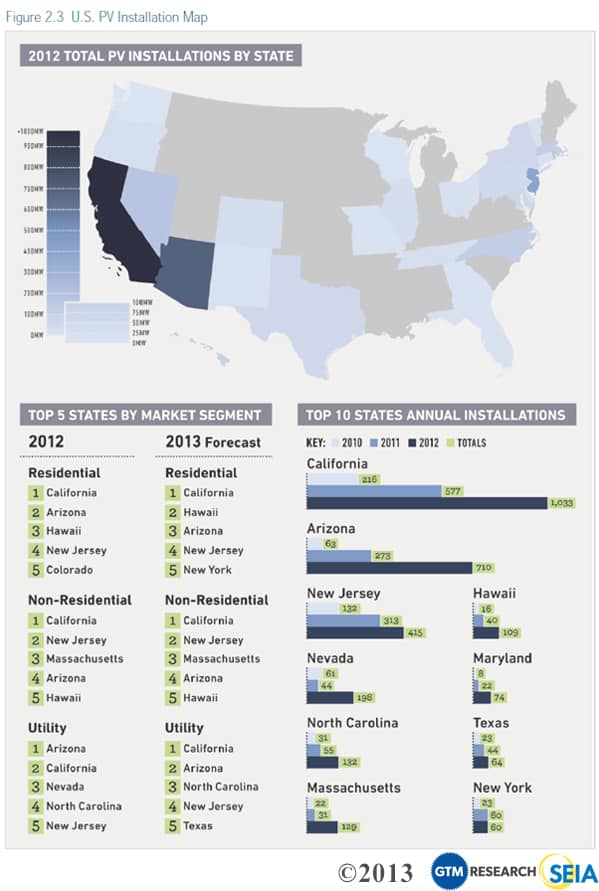
The U.S. installed 3,313 MW of PV in 2012, representing 76% annual growth over 2011. The U.S. market significantly outpaced the growth of the global market, and the U.S. market share of global installations rose above 10% for the first time in recent history.
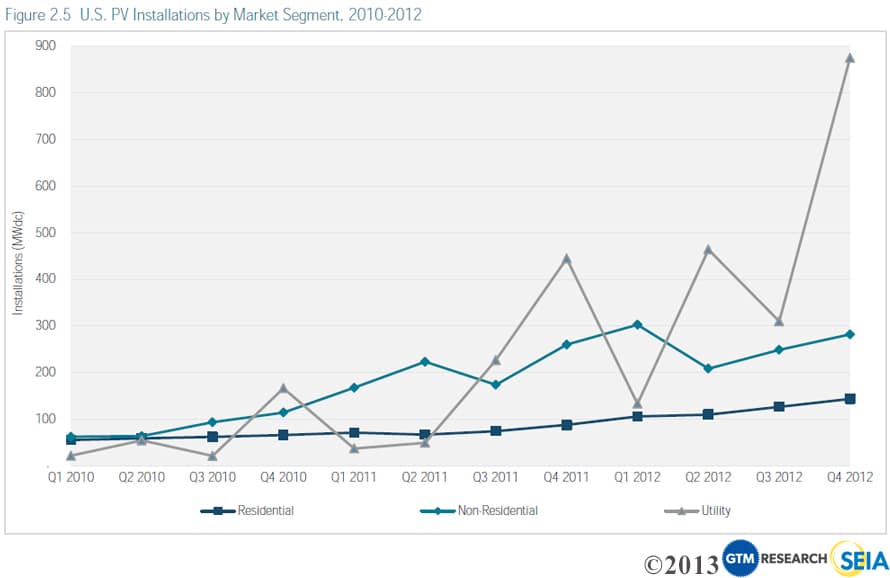
Of the 3,313 MW installed in 2012, 1,300 MW (39.2%) came online in the fourth quarter, making the quarter by far the largest in the history of the U.S. solar market. Both the residential and utility markets experienced their largest quarter ever. In the case of the utility market, Q4 2012 was nearly double the size of the next largest quarter (Q2 2012). In total, the 1,300 MW installed in Q4 2012 represented 89% growth over Q3 2012 and 64% growth over Q4 2011.
California remained the largest state market in 2012, though the state’s historically dominant non-residential market was at times surpassed by New Jersey’s during the year. Arizona came in second, thanks largely to the completion of a number of utility-scale projects in the state. New Jersey had an impressive 415 MW installed during the year, but that growth will undoubtedly slow in 2013, as the market is overbuilt relative to the state’s renewable portfolio standard (RPS) schedule. Both North Carolina and Massachusetts grew significantly in 2012, driven particularly by ground-mounted projects between 1 MW and 10 MW. Nevada took fourth place thanks largely to a number of utility-scale projects reaching completion. Overall, a few states (specifically Colorado and Pennsylvania) declined year-over-year when individual utility projects are removed from the equation.
Residential
- 144 MW installed in Q4 2012, representing 13% quarterly growth over Q3 2012
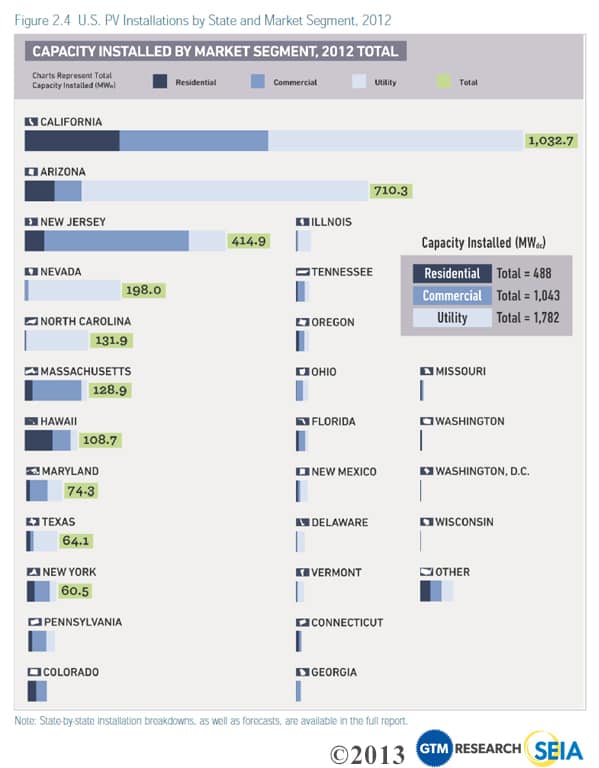
- 488 MW installed in 2012, representing 62% annual growth over 2011
The residential market maintained its relatively steady growth throughout 2012. Compared to other segments, residential installations tend to experience the least quarterly fluctuation. In eleven of the past twelve quarters, the residential market has grown between 4% and 21%. In 2012, the California, Hawaii, Arizona, and Massachusetts residential markets showed notable growth. The only major state residential market to shrink year-over-year was Pennsylvania, which fell from 17 MW in 2011 to 7 MW in 2012.
Non-Residential
- 282 MW installed in Q4 2012, representing 13% quarterly growth over Q3 2012
- 1,043 MW installed in 2012, representing 26% annual growth over 2011
2012 was a tumultuous year in the non-residential market. The year started strong with high installation rates in California and New Jersey, both of which then began to trend downward mid-year. While California recovered and had its largest non-residential quarter ever in Q4, New Jersey installations continued to fall, depressing overall growth figures. Still, there were pockets of significant growth in a number of states including Massachusetts, which grew more than fourfold over 2011. Other notable growth states included Hawaii, Maryland, and New York.
Utility
- 1,782 MW installed in 2012 from 152 projects, up 134% over 2011
- Project pipeline with PPAs in place stands at 10.5 GW, of which 3.1 GW are currently in construction
The utility market grew more than any other in 2012, more than doubling over 2011 to reach 1,781 MW installed. Of this total, 874 MW came online in the fourth quarter alone. In fact, eight of the ten largest projects currently in operation were completed in 2012. The size of the contracted utility PV project pipeline has remained relatively steady over the past year, which implies that the rate of new procurement from utilities has kept pace with newly completed installations. Over the next two years, we expect some depletion in the pipeline as late-stage projects are completed. While some new PPAs will be signed, utility procurement has generally slowed down as a number of the most important utilities have met, or expect to meet, their RPS obligations. Still, pockets of new utility PV growth – particularly for systems sized in the 1 MW to 5 MW range – will exist in 2013 in locations such as North Carolina and California.
Installed Price
2012 was another banner year for installed price reductions for all types of installations in the U.S. Year-over-year, the national average price declined by 26.6%, from $4.10/W to $3.01/W. Quarter-over-quarter, the national weighted-average system price fell by 15.9% percent, from $3.58/W to $3.01/W. This capacity-weighted number is heavily impacted by the volume of utility-scale solar installed in a given quarter, and there was substantially more in Q4 2012 compared to Q3 2012. Individually, average residential and utility prices decreased, while non-residential prices were up slightly quarter-over-quarter. (It should be noted that prices reported are weighted averages based on all systems that were completed in Q4 in many locations.)
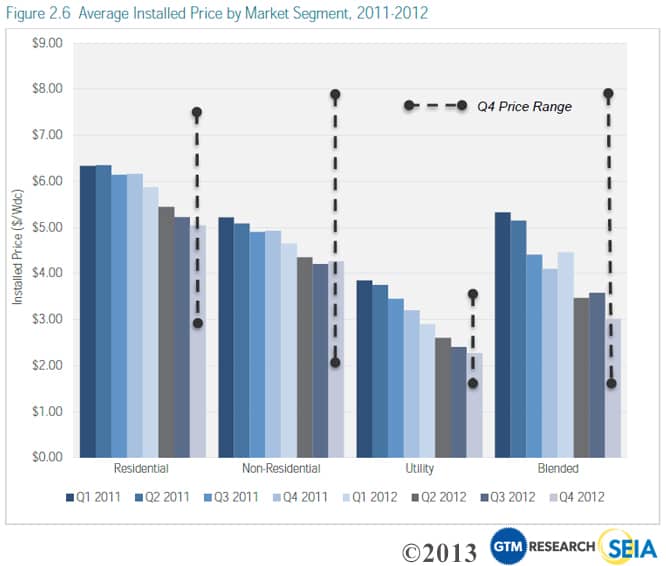
- From Q4 2011 to Q4 2012, residential system prices fell 18.1% percent, from $6.16/W to $5.04/W. Quarter-over-quarter, installed costs declined by 3.5% percent. Installed prices came down in most major residential markets, including California, Arizona, New Jersey, and Massachusetts, and in a number of states fell below $4.00/W.
- Non-residential system prices fell 13.3% percent year-over-year, from $4.65/W to $4.27/W. Quarter-over-quarter, installed costs actually increased by 1.4%, primarily due to a large quantity of higher-cost, government projects connected in California. SREC states, such as New Jersey and Massachusetts, saw the most significant price declines.
- Utility system prices once again declined quarter-over-quarter and year-over-year, down from $3.20/W in Q4 2011 and $2.40/W in Q3 2012 to settle at $2.27/W at the end of 2012.
On the whole, however, installed PV prices vary greatly not only state-to-state, but also project-to-project.
Figure 2.6 displays this wide range of installed prices in Q4 2012. Residential system prices ranged from less than $4.00/W to more than $7.00/W. Non-residential prices were as low as $2.25/W and as high as $8.00/W. Utility prices also display high variability: a 50-MW-plus fixed-tilt installation will be significantly less expensive than a 1 MW pilot project that employs dual-axis tracking. (Note that the lowest installed cost of power does not necessarily yield the lowest levelized cost of energy, an important metric for measuring project returns, due to location.)
Component Pricing
Pricing for polysilicon and PV components remained soft in Q4 2012 due to the persistence of the global oversupply environment that the industry has faced since early 2011. Blended polysilicon prices declined by 15% to fall below $20/kg. Blended module ASPs for Q4 2012 were down to $0.68/W, a staggering 41% lower than Q4 2011 levels of $1.15/W. As the International Trade Commission (ITC) issued its final decision in the antidumping (AD) and countervailing duty (CVD) investigations against Chinese c-Si cell manufacturers, GTM Research maintains that tariffs will not have a material impact on pricing in the U.S.; manufacturers are expected to continue to obtain U.S.-bound cells via tolling from Taiwan with an estimated cost impact of less than $0.10 per watt. This does not necessarily prohibit Chinese manufacturers from pricing modules well below their domestic competitors. Coupled with further conversion cost reductions and the continuing decline in ASPs, pricing could continue to fall in 2013, both globally and in the U.S.
Market Outlook
GTM Research forecasts that 4.3 GW of PV will be installed in the U.S. in 2013. This would represent 29% growth over 2012 – certainly down from the previous few years’ growth rate, but still well above the global growth rate. The primary reason for reduced growth will be the utility market. Whereas utility installations increased by 134% in 2012, we expect only 31% growth in 2013. On a quarterly basis, we anticipate 2013 to proceed similarly to the past few years, with a strong Q1, a mid-year downturn and a significant recovery toward the end of the year.
Looking beyond 2013, there are three major trends:
- Consistent, albeit more moderate, market growth: Our forecast calls for a 28% compound annual growth rate (CAGR) for the 2013-2016 period, down from 82% for the 2009-2012 period but more sustainable in the longer term.
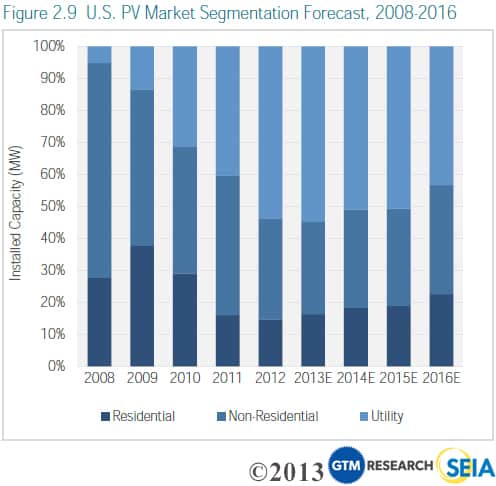
- The new rise of distributed generation: Whereas the past few years could be described as the rise of utility PV, we anticipate a resurgence in distributed generation in the coming years.
- 2016 installation boom: Assuming the ITC is not extended past its current expiration date of December 31, 2016, the final year of the ITC will be a banner year for the U.S. solar market as developers rush to complete projects.
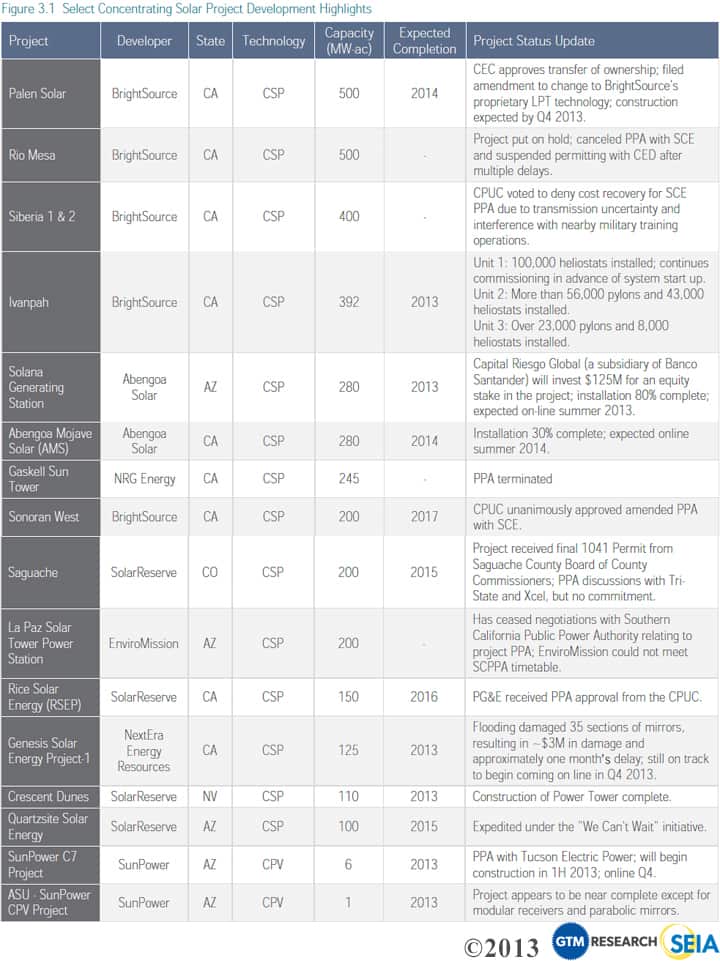
Concentrating Solar Power
There was no concentrating solar capacity installed in the fourth quarter of 2012 and just 30 MWac came online over the course of the year. However, the development of several large CSP installations progressed significantly in 2012:
- BrightSource’s Ivanpah project is on track to be completed in 2013.
- Abengoa’s Solana Generating Station is over 80% complete and is on track to come online in summer 2013.
- Construction of the Power Tower at SolarReserve’s Crescent Dunes Solar Energy Project was completed.
- SunPower’s C7 Project at ASU is nearing completion.
Figure 3.1: Select Concentrating Solar Project Development Highlights
Click on the headings to sort
More Resources
2012: The Solar Year-in-Review Webinar (free)
 Access the archived recording of SEIA and GTM Research's review of the U.S. Solar Market InsightTM: 2012 Year-in-Review report, a look back 2012 highlights and accomplishments, a Q4 2012 data review and a forecast of what's to come for the remainder of 2013. The webinar will highlight trends throughout the U.S. market as well as some state-specific overviews. Listen now
Members-only Resources
 Spread the news about solar's historic quarter and promote your company’s 2012 growth by using the template press release and letter-to-the-editor provided by SEIA. Get the Solar Data Cheat Sheet, a one-page resource of top-line data from our major reports.
Press Release
 Thursday, March 14, 2013 - WASHINGTON, DC and BOSTON, MA - GTM Research and the Solar Energy Industries Association® (SEIA®) today released U.S. Solar Market Insight: Year-in-Review 2012, the definitive analysis of solar power markets in the U.S. With another record-breaking year, solar is the fastest...read more
Fact Sheet
 2012 was a historic year for the U.S. solar industry. There were 3,313 megawatts (MW) of photovoltaic (PV) capacity installed throughout the year, which represents 76% growth over 2011’s record deployment totals. The fourth quarter of 2012 was also the largest quarter on record as 1,300 MW came online...read more
Infographic
 In 2012, the U.S. solar industry installed 3.3 GW of solar capacity, growing 76% over 2011's total. What happened in your state? Find out! According to the U.S. Solar Marker Insight Year-in-Review 2012 report by SEIA and GTM Research, 2012 was a record year for many states. California became the first state to...read more
State-by-state Graphics
 #10: Texas The Lone Star state is ranked second for rooftop solar POTENTIAL, but all the way down at ten for 2012 installations. That’s why we’ve named it, “Most Untapped Potential.” If you include all the usable land (not just rooftops) in Texas, you’ll have twice the solar potential of any other state...read more
Google Hangout
 What's the state of the solar industry? Find out by watching a recording of our Google Hangout hosted live 11am on March 14, 2013. Guests include: Rhone Resch (President and CEO of SEIA), Shayle Kann (Director at GTM Research), Arno Harris (Chairman of the SEIA Board and CEO of Recurrent...read more
Spread the Word
 It has been a colossal year for solar, and we have all the data to prove it. The Solar Market Insight 2012 Year-in-Review by SEIA and GTM Research reveals that the solar market grew by a huge margin in 2012 – beating the anticipated annual growth for the year by 3 percent! Help us spread the word...read more