
The quarterly SEIA/Wood Mackenzie Power & Renewables U.S. Solar Market InsightTM report shows the major trends in the U.S. solar industry. Learn more about the U.S. Solar Market Insight Report. Released March 16, 2021.
1. Key Figures
- In 2020, the U.S. solar market installed a record 19.2 GWdc of solar capacity, a 43% increase over 2019.
- Solar accounted for 43% of all new electricity-generating capacity added in the U.S. in 2020, representing solar’s largest ever share of new generating capacity and ranking first among all technologies for the second year in a row.
- In Q4 2020, the U.S. solar market also set a record for quarterly installations with just over 8 GWdc of solar PV, up 32% year-over-year. The industry worked through massive backlogs of projects awaiting interconnection while utility-scale projects rushed to meet the previously anticipated decline in the investment tax credit (ITC) rate.
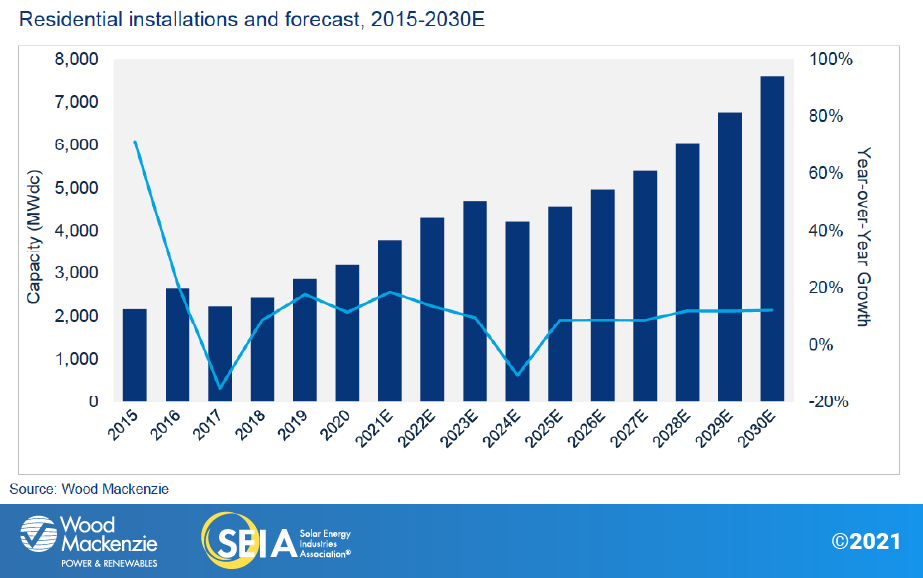
- Residential deployment was up 11% from 2019, reaching a record 3.1 GW. This was lower than the 18% annual growth in 2019, as residential installations were significantly impacted by the pandemic in the first half of 2020.
- Non-residential installations declined 4% from 2019, with 2 GW installed. The pandemic impacted this segment through delayed project interconnections and prolonged development timelines, but we expected a down year even before the pandemic as this segment has faced obstacles to sustained growth for many years.
- A historic 6.3 GWdc of utility-scale projects were installed in Q4 2020, bringing the annual total just shy of 14 GWdc.
- A total of 5 GWdc of new utility solar power purchase agreements were announced in Q4 2020, bringing the volume of project announcements in 2020 to 30.6 GWdc and the full utility-scale contracted pipeline to a total of 69 GWdc.
- The 2-year extension of the ITC in the final days of 2020 has led to a 17% increase in deployment in our 2021 – 2025 forecast.
- In this 2020 Year in Review report, Wood Mackenzie has released 10-year outlooks for the first time. We expect a cumulative 324 GWdc of solar capacity additions over the next decade, more than three times greater than what has been installed through 2020. This growth will be spread across all market segments as distributed solar customers, utilities, states, and corporations push to decarbonize the grid.
2. Introduction
The year 2020 was a record-setting year for the solar industry, and it won’t be the last. The fourth quarter exceeded the prior quarterly record set in Q4 2016 by 22%, with just over 8 gigawatts-direct current (GWdc) of solar photovoltaic (PV) capacity installed. The year ended with a total of 19.2 GWdc installed, an astonishing 43% more than capacity added in 2019 – all in the midst of a global pandemic.
Residential solar volumes were up 28% from Q3 for a total of 963 MW. Pent up demand from the second quarter (during the worst impacts of Covid-19 restrictions) combined with a surge in interest in home improvements, resulting in record-setting sales pipelines in the second half of the year. Fourth quarter installations reflect those sales pipelines, which are likely to carry over into the first quarter of 2021. Non-residential solar (which includes commercial, government, nonprofit and community solar) increased 73% from Q3 as utilities made their way through interconnection backlogs. Utility solar had its largest quarter and largest year on record with annual capacity additions up 65% from last year.
Additionally, solar PV accounted for 43% of all new electricity-generating capacity additions in 2020, the largest share in the industry’s history and the second consecutive year that solar ranked first among all generation technologies. Solar and wind made up 81% of new capacity in 2020, far more than the prior record of 68% in 2015. Finally, geographic diversity also continued to increase in 2020 with 27 states each adding more than 100 MWdc.

The two-year extension of the ITC results in more than 11 GW of additional capacity
The year-end extension of the ITC came as welcome news, allowing the industry to continue the momentum from a record-breaking second half of 2020. From 2021 to 2025 (the last year that projects must be completed to qualify for ITC levels above 10%), our outlooks have increased by 25% for residential, 15% for non-residential, and 15% for utility scale. Overall, the 5-year outlook increased by 17.7 GWdc or 17%.
The next decade will see the total operating solar fleet more than quadruple
But growth in the U.S. solar market is only partially driven by the ITC extension. Residential solar sales continue to exceed expectations as loan providers roll out attractive products, interest in home improvement surges, and customers suffering through power outages from extreme weather events seek energy resilience. Utility solar pipelines continue to grow, driven by a proliferation of decarbonization targets from a variety of offtakers. And while non-residential solar growth is expected to moderate after an initial surge in 2021, long-term growth will accelerate as costs decline and financing options become more widely available. In total, the operating solar fleet is expected to quadruple from nearly 100 GWdc of capacity installed today to more than 400 GWdc installed by 2030.


3. Market segment outlooks
3.1. Residential PV
Key figures
- 3,194 MWdc installed in 2020, the largest year on record
- Up 11% from 2019
Fourth quarter residential solar set records – expect more of the same in 2021
Residential solar rebounded after the initial shock of the pandemic. The last quarter of the year is always massive for residential solar, as installers rush to complete projects prior to year-end incentive expirations. Given the original ITC stepdown, massive sales pipelines, and motivated customers who were stuck at home, it’s no wonder Q4 2020 hit nearly 1 GW of additions. Several major state markets set records for quarterly volumes, including Arizona, California, and Texas.
The first quarter of 2021 could be equally large, counter to the typical slowdown of residential solar in the first quarter. While many installers report gradual progress through project backlogs, permitting delays in some areas continue to extend project timelines, causing some spillover into Q1 2021. Additionally, the overall construction boom and high demand for solar and storage in the latter half of 2020 have created labor shortages and equipment delays, further exacerbating this spillover. And finally, high sales volumes have continued; some installers report they are busier than ever during a time when they normally expect a slowdown in sales. With all of these factors in mind, Wood Mackenzie is forecasting 18% growth in residential solar in 2021.
Another reason for high expected volumes in the first half of 2021 is a surge in demand caused by the Texas winter storms in mid-February. EnergySage – an online platform for solar sales – reported that traffic to its website from Texas increased by more than 200% during the week of the storm. This mimics the surge in customer interest in California following mandated power shutoffs due to the October 2019 wildfires. These types of events will continue to drive customer interest in solar and solar-plus-storage, with knock-on effects in other markets.
Despite all of these upward trends, not every residential installer had the same experience in 2020. Small and medium-sized installers (those that do less than 50 deals per month) were more likely to experience sales declines for the year. These installers typically rely on high proportions of cash sales, a financing model that fewer residential customers were able to accommodate in the midst of an economic recession.
It would be an oversight not to mention the intense pace of financial product innovation in the residential solar market in 2020. New solar loan products and terms, pricing promotions, and point-of-sale technology enhancements have all contributed to increased residential solar sales in 2020 and will continue to drive growth in the coming years.
Residential solar will be boosted by the ITC, reaching 4.7 GW of installations in 2023
Looking ahead, we expect residential solar will reach double-digit growth in each of the next three years. The majority of the market will be customer-owned thanks to the dominance of residential solar loans, and a higher ITC value, makes these sales even more compelling. This is particularly true in the high growth markets of Texas and Florida, where retail electricity rates are not as high as in California or the Northeast. The most significant increases to our outlooks are in 2022 (which was previously the first year of ITC-related market contraction) and 2023 (which is now characterized by demand pull-in before the ITC phases down).
One state that defies this general trend is California. The regulatory proceeding to determine the next generation of net energy metering policy – referred to in the industry as NEM 3.0 – has officially kicked off. We expect implementation of new rules to begin affecting the market in late 2022 or early 2023. As a conservative approach to our forecast, Wood Mackenzie expects modest contraction in 2023 as the market adapts to a new compensation regime. This pulls down national residential growth in 2023 to 10%, but outside of California, we are forecasting 18% growth that year. As details of the successor program emerge over the next 18 months, the uncertainty around the market impacts will begin to clear.
Long-term, strong residential solar fundamentals will lead to annual growth of 9% to 12%, exceeding 7 GWdc of annual additions in 2030. The share of homes with solar will grow from 4% today to 13.4% by 2030.
3.2. Non-residential PV
Key figures
- 2,074 MWdc installed in 2020
- Down 4% from 2019
Project delays lead to a down year for non-residential solar
Non-residential solar is the only segment that did not set records in 2020. Installation volumes did recover significantly in the fourth quarter, growing 73% over Q3 as states like New York and Massachusetts made progress on interconnecting backlogs of installed projects. But compared to the other market segments, non-residential solar experienced the worst project delays related to the pandemic. Developers report that delays related to permitting and interconnection or approval processes at the municipal or county level reached anywhere from 45 to 90 days at their worst point. Ultimately, 2020 ended slightly lower than 2019, but many projects targeting 2020 will end up coming online in 2021.
Fortunately, the two-year extension of the ITC will help improve economics for non-residential projects over the next few years. But the most immediate impact of the ITC extension was to provide developers with breathing room at the end of the year. The year-end step down typically induces an anxious rush to safe-harbor equipment, sign PPAs, or reach other critical project milestones. The extension gave developers some relief in reaching those milestones.
Thanks to project spillover, the ITC extension, and the cadence of several state community solar programs, we expect 2021 to grow 25% over 2020. Our community solar outlook peaks in 2021 as projects in New York and Massachusetts reach completion, and project installations pick up in Illinois, Maine, Maryland, and New Jersey. Onsite non-residential solar (excluding community solar) is also expected to grow 18%, as the ITC extension greases the wheels of projects in development.
However, by 2022 growth in non-residential solar will be much more modest, driven almost entirely by state-level dynamics. Commercial solar remains highly policy-dependent: installations swell and contract with the opening and closing of state-level programs. In 2022 and 2023, community solar installations in states including Illinois, Maine, Massachusetts, Minnesota, New Jersey and New York will start to dwindle as pipelines of qualifying projects are built out. The Massachusetts market will experience a pause in 2022, as the second 1600 MW capacity allocation of the SMART program isn’t expected to open until later this year, driving more significant growth in 2023. (More details on Massachusetts dynamics can be found in the full report). ITC-driven growth in onsite commercial installations compensates for the slowdown in community solar, resulting in overall non-residential growth of 3% in 2022 and 2% in 2023.
Longer-term, non-residential solar won’t grow meaningfully until costs decline
Unsurprisingly, non-residential solar will contract slightly in 2024 and 2025 as the ITC steps down. Despite overall long-term optimism in the industry, non-residential solar continues to experience multiple pain points and transaction friction that can only be overcome with strong state-level incentive programs. Not only are community solar pipelines expected to dwindle, but originations of traditional onsite non-residential solar are expected to be depressed for several years in the wake of the pandemic. Commercial real estate lending – an indicator of commercial business health – has had credit standards tighten within the last year, as banks fear credit quality degradation. Even prior to the pandemic, the market for small and medium onsite non-residential solar (projects less than 1 MW) has been shrinking since 2017 while the ITC was still at 30%.
It’s very possible that new community solar programs or state-level incentive programs will crop up within the next few years. But given the lengthy project timelines of non-residential solar, it would take several years for any new programs to result in project installations.
Nonetheless, as solar costs continue to decline, and financing solutions for non-residential solar relieve some of the pain points for these projects, growth will pick up in the latter half of the decade. The non-residential segment may have many challenges, but a lack of an addressable market isn’t one of them.

3.3. Utility PV
Key figures
- 6.3 GW installed in Q4 2020, the largest quarter for utility PV in history
- 2020 annual capacity additions reached nearly 14 GW, the largest year on record
- The utility PV contracted pipeline has remained level at 69 GW
The utility solar sector set the record for the most capacity installed in a single year in 2020. In Q4 2020, 6.3 GW of capacity was installed, also making it the largest quarter on record, with more capacity installed in this quarter than in all of 2018 combined. The utility solar segment fell just short of an anticipated 14 GW in 2020, with more projects than expected pushed into 2021. Despite 2020 being the largest year on record, utility solar is likely to beat this record again in 2021. There are currently 11.2 GW of projects under construction for 2021, putting the market on pace to hit 17.5 GW of annual capacity additions.
In 2020 alone, there were 30.6 GW of new utility-scale projects contracted, slightly less than the 34.3 GW of projects announced in 2019. While year-over-year decline might indicate a slowdown, the combined 64.9 GW of projects contracted in these two years exceeds the total volume of all projects contracted prior to 2019. The industry is growing at a rapid rate and will likely continue to do so in response to continued expansion of state-level renewable energy targets, utilities’ self-enforced carbon reduction plans, a renewed focus on clean energy deployment at the federal level, and large corporate offtakers looking to meet net zero carbon emissions goals.

The next five years are likely to be a momentous time for utility solar, with both upside potential and downside risks. Through 2020, there was a rush to get projects signed and eligible for the federal ITC before it phased down to 10%. This created a surge of demand, contributing to the record-setting 69 GW pipeline.
While the two-year ITC extension gives some developers flexibility to push back project completion dates by a year or two, most will continue to bring their projects online as scheduled due to offtaker requirements. This will likely result in more than 19 GW of utility-scale solar projects deployed in 2023 alone. Years 2024 and 2025 will see lower annual capacity additions as utilities begin to ramp up procurement, resulting in annual totals above 19 GWs again in 2026.
From 2026 through 2030, annual capacity additions will continue to grow from 19 to 41.8 GW. The tremendous surge in utility solar in the latter part of the decade is due to a confluence of factors. Cost declines in large-scale battery storage, increasing cost competitiveness of utility-scale solar, robust clean energy targets from governments, corporations and utilities, growth in economy-wide electricity demand, and the need to replace retiring coal and natural gas plants will drive a huge volume of new solar deployment.
As part of this shift, we will see offtakers become more sophisticated as they select projects with the lowest risk. We will see a growing number of projects that offer firmed shape delivery rather than just generated energy, especially as the number of solar plus storage projects are brought online.
There is considerable upside opportunity during this time. President Biden re-joined the Paris Climate Accord in February, which has already driven a handful of power offtakers to revisit and possibly increase their renewable energy procurement targets. And the possibility of a national federal policy demanding more renewables or carbon reduction is already driving states and utilities to adopt new solar and renewables mandates.
Despite significant opportunity, the industry also faces some headwinds and downside risks. Developers continue to report tighter access to tax equity (TE) financing, especially for new entrants. While we have observed some growth in the number of TE providers, the new entrants are often unable to close deals as fast as incumbent financiers, leading to financing delays. Similarly, developers have continued to report challenges in securing engineering, procurement, and construction (EPC) firms. While tightness in the tax equity and EPC markets is unlikely to lead to project cancelations, some delays could occur for less established developers.
Finally, there is a growing concern about solar product imports made with polysilicon from the Xinjiang province, China, due to reports of forced labor in the region and an inability to conduct independent audits. While there is still uncertainty around the extent of the impact to the U.S. solar market, the situation has the potential to delay some portion of U.S. projects.

4. National solar PV system pricing
We employ a bottom-up modeling methodology to capture, track and report national average PV system pricing for the major market segments. Our methodology is based on the tracked wholesale pricing of major solar components and data collected from interviews with industry stakeholders. We report a weighted average of multi-silicon and mono PERC solar modules for the residential, non-residential and utility segments.

In Q4 2020, system pricing fell across all market segments. System pricing fell year-over-year by 2.5%, 6.5%, 9.8% and 7.9% in the residential, non-residential, utility fixed-tilt and utility single-axis tracking markets, respectively. System pricing fell quarter-over-quarter by 0.8%, 0.7%, 1.9% and 1.7% in the residential, non-residential, utility fixed-tilt and utility single-axis tracking markets, respectively.
The residential solar segment was better positioned to handle the surge in Covid-19 cases in Q4 2020, as virtual customer acquisition and permitting processes were more established than in March 2020 when the pandemic first hit the U.S. While new customer acquisition efforts may have required additional investment, they also allowed companies to reach a larger audience and save on travel costs. As a result, average customer acquisition costs did not increase from 2019 to 2020. However, permitting processes were still a pain point for non-residential and utility projects in Q4 2020, as AHJs experienced delays when granting permits.
5. Component pricing
Major module supply chain events that took place in Q3 2020 continued to have significant impacts on module component pricing in Q4. Even though the polysilicon facilities affected by fire incidents and floods started to resume production in early Q4, supply remained constrained compared to demand, resulting in a significant increase in polysilicon prices.
Mono-grade polysilicon prices almost reached $11/kg in early Q4 and then fell to $10/kg by December but increased again in the last two weeks of 2020 due to the year-end production rush. Overall, Q4 polysilicon prices saw an 8% increase quarter-over-quarter and the higher material cost trickled down and caused mono wafer prices to rise by 7% during the same period. Multi and mono PERC cell prices saw little change from Q3 to Q4 2020.
Global average prices for multi modules remained unchanged from Q3 to Q4 but mono PERC module prices increased by 5% from Q3 to $0.22/W in Q4.
In the U.S., mono PERC module prices were at $0.34/W for utility-scale projects in Q4, a similar level to the previous quarter. In November 2020, a ruling by the U.S. Court of International Trade reinstated the Section 201 tariffs for all imported bifacial modules. Bifacial modules that arrived before 8 February 2021 will face a 20% Section 201 tariff, and those that arrive between 8 February 2021 and 7 February 2022 will face an 18% tariff.

About the Report
U.S. solar market insight® is a quarterly publication of Wood Mackenzie and the Solar Energy Industries Association (SEIA)®. Each quarter, we collect granular data on the U.S. solar market from nearly 200 utilities, state agencies, installers and manufacturers. This data provides the backbone of this U.S. solar market insight® report, in which we identify and analyze trends in U.S. solar demand, manufacturing and pricing by state and market segment. We also use this analysis to look forward and forecast demand over the next five years. All forecasts are from Wood Mackenzie, Limited; SEIA does not predict future pricing, bid terms, costs, deployment or supply.
-
References, data, charts and analysis from this executive summary should be attributed to “Wood Mackenzie/SEIA U.S. solar market insight®.”
-
Media inquiries should be directed to Wood Mackenzie’s PR team ([email protected]) and Morgan Lyons ([email protected]) at SEIA.
-
All figures are sourced from Wood Mackenzie. For more detail on methodology and sources, click here.
-
Wood Mackenzie Power and Renewables partners with Clean Power Research to acquire project-level datasets from participating utilities that utilize the PowerClerk product platform. For more information on Clean Power Research’s product offerings, visit https://www.cleanpower.com/
Our coverage in the U.S. Solar Market Insight reports includes all 50 states and Washington, D.C. However, the national totals reported also include Puerto Rico and other U.S. territories. Detailed data and forecasts for 50 states and Washington, D.C. are contained within the full version of this report. To find out more, click here.

Note on U.S. solar market insight report title: WM P&R and SEIA have changed the naming convention for the U.S. solar market insight report series. Starting with the report released in June 2016 onward, the report title will reference the quarter in which the report is released, as opposed to the most recent quarter in which installation figures are tracked. The exception will be our year in review publication, which covers the preceding year’s installation volumes despite being released during the first quarter of the current year.
About the Authors
Wood Mackenzie Power & Renewables | U.S. Research Team
Michelle Davis, Senior Solar Analyst
Colin Smith, Senior Solar Analyst
Bryan White, Solar Analyst
Ravi Manghani, Global Head of Solar
Xiaojing Sun, Senior Solar Analyst
Molly Cox, Solar Analyst
Gregson Curtin, Research Associate
Solar Energy Industries Association | SEIA
Shawn Rumery, Director of Research
Colin Silver, Chief of Staff and Chief Content Officer
Justin Baca, Vice President of Markets & Research
License
Ownership rights
This report (“Report”) and all Solar Market Insight® (“SMI”)TM reports are jointly owned by Wood Mackenzie and the Solar Energy Industries Association (SEIA)®(jointly, “Owners”) and are protected by United States copyright and trademark laws and international copyright/intellectual property laws under applicable treaties and/or conventions. Purchaser of Report or other person obtaining a copy legally (“User”) agrees not to export Report into a country that does not have copyright/intellectual property laws that will protect rights of Owners therein.
Grant of license rights
Owners hereby grant user a non-exclusive, non-refundable, non-transferable Enterprise License, which allows you to (i) distribute the report within your organization across multiple locations to its representatives, employees or agents who are authorized by the organization to view the report in support of the organization’s internal business purposes, and (ii) display the report within your organization’s privately hosted internal intranet in support of your organization’s internal business purposes. Your right to distribute the report under an Enterprise License allows distribution among multiple locations or facilities to Authorized Users within your organization.
Owners retain exclusive and sole ownership of this report. User agrees not to permit any unauthorized use, reproduction, distribution, publication or electronic transmission of any report or the information/forecasts therein without the express written permission of Owners.
Disclaimer of warranty and liability
Owners have used their best efforts in collecting and preparing each report.
Owners, their employees, affiliates, agents, and licensors do not warrant the accuracy, completeness, correctness, non-infringement, merchantability, or fitness for a particular purpose of any reports covered by this agreement. Owners, their employees, affiliates, agents, or licensors shall not be liable to user or any third party for losses or injury caused in whole or part by our negligence or contingencies beyond Owners’ control in compiling, preparing or disseminating any report or for any decision made or action taken by user or any third party in reliance on such information or for any consequential, special, indirect or similar damages, even if Owners were advised of the possibility of the same. User agrees that the liability of Owners, their employees, affiliates, agents and licensors, if any, arising out of any kind of legal claim (whether in contract, tort or otherwise) in connection with its goods/services under this agreement shall not exceed the amount you paid to Owners for use of the report in question.

