
The quarterly SEIA/Wood Mackenzie Power & Renewables U.S. Solar Market Insight report shows the major trends in the U.S. solar industry. Learn more about the U.S. Solar Market Insight Report. Released September 8, 2022.
1. Key Figures
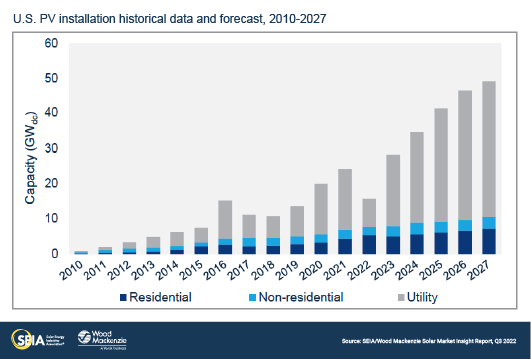
- In Q2 2022, the US solar market installed 4.6 GWdc of solar capacity, a 12% decrease from Q2 2021 and a 12% increase from Q1 2022. Installations would have been higher if not for supply chain constraints and the uncertainty of the anticircumvention investigation.
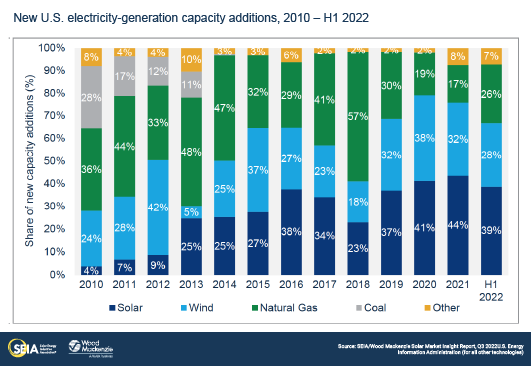
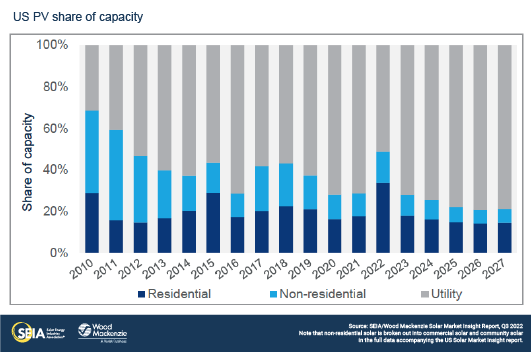
- Solar accounted for 39% of all new electricity-generating capacity added to the US grid in the first half of 2022.
- For the fifth consecutive quarter, the residential segment set a quarterly record with 1.36 GWdc installed, a 37% increase over Q2 2021 and a 7% increase over Q1 2022, demonstrating strong customer demand spurred in part by power outages and power price increases.
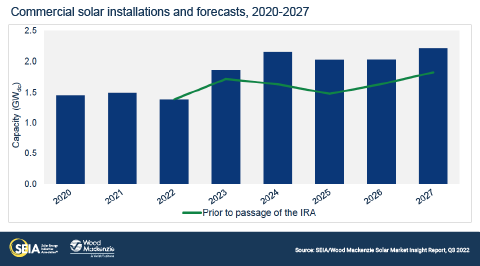
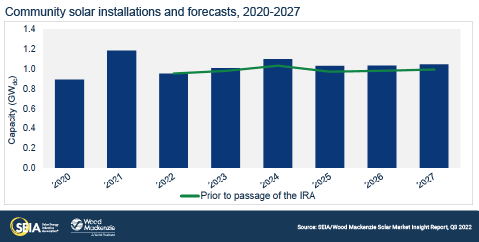
- Commercial solar installed 336 MWdc, down 7% year-over-year and up 13% quarter-over-quarter. Community solar installed 228 MWdc, down 15% year-over-year and down 2% quarter-over-quarter.
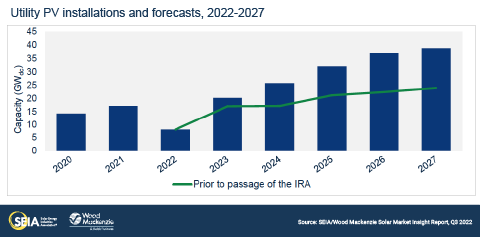
- 2.7 GWdc of utility-scale solar were deployed in Q2 2022, a 25% decrease from Q2 2021 and a 17% increase from Q1 2022. Supply chain constraints and trade policy issues continue to suppress utility-scale solar installations.
- The historic passage of the Inflation Reduction Act (IRA) in August will be a massive growth catalyst for the solar industry. Wood Mackenzie’s updated outlooks include the impacts of the IRA for every segment of the solar industry. We expect total solar deployment to increase by 62 GWdc, or 40%, over the next five years (2023 – 2027).
- President Biden’s Executive Order delaying new tariffs was a relief, but the industry remains supply-constrained. The transition from old rules under the administration’s withhold release order (WRO) to new rules under the Uyghur Forced Labor Prevention Act (UFLPA) has caused further delays in getting shipments of modules into the United States.
- As a result of persistent supply constraints, our expectations for total solar deployment in 2022 have remained relatively constant. Wood Mackenzie expects the solar industry to remain supply-constrained through year-end 2023. As a result, the full benefits of the IRA won’t be felt until at least 2024.
2. Introduction
The US solar industry installed 4.6 gigawatts-direct current (GWdc) of capacity in the second quarter of 2022, a 12% decrease from Q2 2021 and a 12% increase from Q1 2022.
Similar to the first quarter, second quarter volumes came with mixed results across segments. Yet again, residential solar had its largest quarter ever at 1.36 GWdc, representing nearly 180,000 residential customers installing solar in one quarter. Customer appetite for residential solar continues to be strong as power outages and power prices increase. Commercial and community solar had relatively stable quarters, with 336 MWdc and 228 MWdc installed, respectively. And the utility-scale sector installed 2.7 GWdc – we’re expecting 8.1 GWdc of installations this year, the lowest annual total since 2018. Across the solar industry, second quarter volumes would have been higher if not for supply chain constraints and the industry-wide slowdown from March through June, caused by the initiation of the anticircumvention investigation. Overall, solar PV accounted for 39% of all new electricity-generating capacity additions in the first half of 2022.
The solar industry celebrates the historic passage of the Inflation Reduction Act
On August 16th, 2022, President Biden signed the Inflation Reduction Act (IRA) into law. This legislative package includes major policy initiatives across multiple industries from healthcare to clean energy. It is particularly historic in terms of climate action, providing long-term tax credits and incentives for a myriad of renewable energy and electrification technologies. Numerous research organizations have published studies finding that the IRA could help the United States achieve roughly two-thirds of President Biden’s 2030 carbon reduction goals.
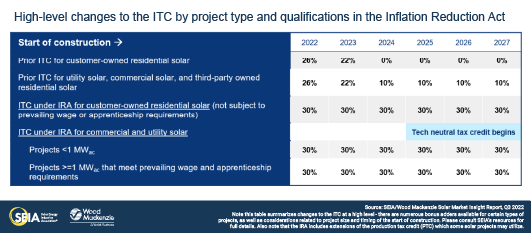
For the US solar industry, the passage of this legislation gives the industry the most long-term certainty for federal tax credits it has ever had. The industry will have ten years of certainty between the extensions of the current investment tax credit (ITC) and production tax credit (PTC), in addition to a new technology-neutral tax credit that begins after 2024. This stands in stark contrast to the one-, two-, or five-year extensions of the last decade that have typically been passed in the final days of the year.
Equally as important, key provisions of the Solar Energy Manufacturing for America Act (SEMA) were included in the IRA. For the first time, the US solar industry will have access to production tax credits and an investment tax credit for domestic manufacturing across the solar value chain. Multiple companies have already announced commitments to build new domestic facilities, which will diversify and bolster the US solar supply chain over the long term.
There are numerous other provisions of the IRA that will indirectly benefit the solar industry, including but not limited to:
- A standalone storage ITC, providing more options to finance and deploy storage, helping support a grid with more variable generation
- Tax credits and incentives for multiple zero or low carbon technologies that will accelerate electrification and help meet carbon reduction targets, including hydrogen, carbon capture and sequestration, direct air capture, etc.
- Expanded tax credits for electric vehicles, helping to increase electrification of the transportation sector
- Funds for state governments to create rebate programs for home energy efficiency upgrades and electrification
SEIA has published resources on relevant provisions and will continue to update those resources as relevant agencies issue implementation guidance.
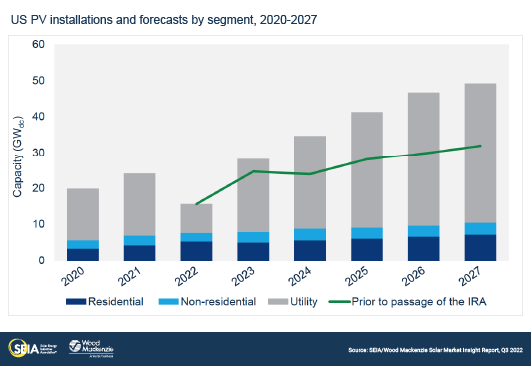
Over the next five years, we project that the passage of the IRA will boost total solar deployment by 62 GWdc, or 40%, compared to our outlooks without the passage of the IRA. Unsurprisingly, the price-sensitive utility-scale segment benefits the most from the IRA, increasing 47% over our outlooks without the IRA. Other sector-specific impacts are covered in the market overview sections of this report.
While there are several ITC bonus adders available for specific types of solar projects, Wood Mackenzie has assumed most projects will earn the 30% ITC in the short term. In the medium-term, the availability of bonus adders may help increase demand, providing upside to our outlooks.
In the short term, supply chain challenges remain
Despite the passage of the IRA, the industry must still contend with near-term supply chain challenges. Our outlooks for 2022 decreased considerably when the Department of Commerce (DOC) initiated the anticircumvention investigation and procurement and development activity slowed dramatically. The industry received some relief when President Biden issued an Executive Order in early June delaying the implementation of any prospective additional tariffs for two years. This has allowed the industry to get back to business, restarting project development and shipments to the US from Southeast Asian facilities.
Of course, it is still possible that new anti-dumping and countervailing duties could be implemented by the DOC, which would go into effect in June of 2024. In this report, our outlooks assume no additional tariffs are implemented. But if they were, already high module prices would increase further, exacerbating and prolonging supply constraints. The deadline for a preliminary decision on the investigation was recently extended to the end of November.
Recently, the most significant constraint on shipments of solar equipment has been the enforcement of the Uyghur Forced Labor Prevention Act (UFLPA). The law went into effect on June 21st, which has resulted in multiple detentions of Tier 1 modules. The solar industry had expected that enforcement of the UFLPA would require similar documentation as the Withhold Release Order (WRO) from last fall. But unlike the requirements for the WRO, Customs and Border Protection (CBP) has been seeking sourcing documentation for the quartzite that is then processed into polysilicon for solar modules. This requirement goes further upstream than the WRO, which requires documentation on the source of metallurgical grade silicon. Multiple sources of quartzite are often combined before being processed into solar-grade polysilicon, presenting challenges for providing the required documentation.
As the industry begins addressing the new requirements, supply chain constraints continue. Unsurprisingly, utility-scale projects that require large shipments of modules have been impacted the most. Developers are pessimistic about their ability to secure modules for the rest of the year. Just in the last quarter, this has led to a 10 GWdc reduction to the total pipeline of 2022 utility-scale projects either under construction or in-development as projects are delayed to 2023 and 2024. The industry will gain more clarity around the exact requirements once CBP releases the first shipments. This could happen soon now that some manufacturers have started filing admissibility packages with CBP.
The UFLPA has had a more muted impact on the distributed solar sectors. While domestic supply and distributor inventory have provided a buffer, all solar developers are currently concerned about supply for their businesses.
In summary, our expectations for total solar deployment in 2022 have only increased by about 100 MWdc. Despite the Executive Order in June, shipments of modules into the US have not substantially improved because of enforcement of the UFLPA. Slightly higher expectations for distributed solar and lower expectations for utility solar have effectively balanced each other out. Wood Mackenzie expects the solar industry to remain supply constrained through year-end 2023. As a result, the full benefits of the IRA won’t be felt until at least 2024.

3. Market segment outlooks
3.1. Residential PV
- 1,358 MWdc installed in Q2 2022
- Up 37% from Q2 2021
- Up 7% from Q1 2022
The residential solar market installed 1,358 MWdc in Q2 2022, setting another record for quarterly installations. California (459 MWdc), Florida (134 MWdc), and Texas (111 MWdc) again led the way with California and Texas reaching record quarterly deployments. Increasing retail electricity rates in an inflationary environment, along with power outages caused by extreme weather events, are driving demand to new levels.
The residential sector has been more insulated from the impacts of the anticircumvention investigation but installers have still faced challenges around inventory volatility and elevated equipment costs. Installers have been forced to rely on inventory or have had to adapt quickly to unexpected changes to product offerings. Adding to these challenges, installers face delays in permitting and utility interconnection timelines, as well as labor shortages. This has created significant backlogs of projects that have been installed but await utility interconnection to begin operating.
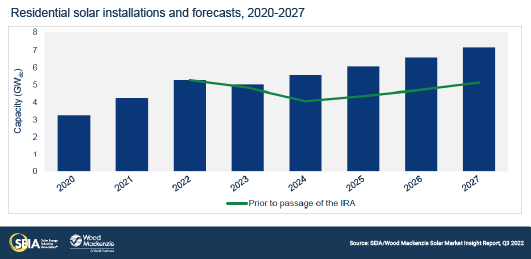
Despite these obstacles, we expect record residential solar installations this year as installers work through backlogs and sales continue to grow. Next year, installations are expected to drop slightly as California’s NEM 3.0 policy goes into effect (more on this in the full report). Over the next five years, the recent passage of the IRA has resulted in an increase of 7.3 GWdc, or 26%, to our outlook compared to our outlook without the IRA, with the biggest impacts coming after 2023.
3.2. Commercial PV
- 336 MWdc installed in Q2 2022
- Down 7% from Q2 2021, up 13% from Q1 2022
Note on market segmentation: Commercial solar encompasses distributed solar projects with commercial, industrial, agricultural, school, government or nonprofit offtakers, including remotely net-metered projects. This excludes community solar (covered in the following section).
Commercial solar volumes were relatively stable in the second quarter, landing at 336 MWdc compared to 299 MWdc in the first quarter. Second quarter volumes would have been higher if not for the supply chain constraints of the last year or the immense uncertainty from March through June caused by the initiation of the anticircumvention investigation.
As a result of President Biden’s Executive Order, we expect that 2022 commercial solar volumes will recover significantly, increasing the outlook for the year by 8%. While module pricing remains high, developers report that they are moving forward with equipment purchases and contracts with customers. However, we do not expect a full recovery this year. Nearly three months of uncertainty caused substantial project delays that are unlikely to be reversed. Our updated outlook for 2022 represents a 7% contraction from 2021 compared to a 14% contraction in our last outlook.
The extension of the investment tax credit (ITC) will be a major boost to the commercial solar industry. Compared to our outlooks without the passage of the IRA, our revised outlooks add more than 2 GWdc of additional commercial solar between 2023 and 2027. In addition to the tax credit extensions themselves, commercial solar will benefit from the direct pay provisions for tax-exempt and rural co-op customers, the transferability option for customers who are not tax-exempt, and the ability for interconnection costs to earn the ITC for projects under 5 MWac.
3.3. Community solar PV
- 228 MWdc installed in Q2 2022
- Down 15% from Q2 2021, down 2% from Q1 2022
Note on market segmentation: Community solar projects are part of formal programs where multiple customers can subscribe to the power produced by a local solar project and receive credits on their utility bills.
Community solar installations were relatively stable in the second quarter, with New York accounting for half of the quarterly volume. As in commercial solar, volumes would have been higher in the absence of supply chain constraints and the initiation of the anticircumvention investigation.
Our expectations for 2022 community solar volumes have increased considerably, by 18% compared to our previous outlook. President Biden’s Executive Order has certainly brought relief to the industry, but most of the increase comes from healthy installation volumes in two states: Maine and New York. These two states accounted for 72% of the community solar capacity additions in the first half of 2022. In Maine, Net Energy Billing (NEB) projects that are not wrapped up in the state’s interconnection studies are coming online at a fast pace. And in New York, Community Adder projects continue to come online, with a healthy pipeline remaining.
Since many of the largest community solar markets are limited by state program caps or capacity allocations, we expect the impacts of the IRA to be more limited for community solar. However, since interconnection costs qualify for the ITC for projects under 5 MWac starting in 2023, we’ve increased our confidence in states with interconnection constraints. The five-year outlook has risen by 4%, or 260 MWdc, compared to our outlooks without passage of the IRA.
3.4. Utility PV
- 2.7 GWdc installed in Q2 2022
- 162 GWdc of utility-scale solar will be added from 2022-2027 in the Base case, 52 GWdc more than prior to the passage of the IRA
Utility-scale solar market performance was mixed in the second quarter. A total of 2.7 GWdc was installed in Q2, just 500 MWdc more than Q1. Through the first half of the year, deployments are at their lowest level since 2019. Despite this, more than 10 GWdc of new contracts were signed – the largest number since 2019. The total utility-scale solar pipeline now stands at 88 GWdc, a 10% increase compared to last quarter.
The utility-scale segment experienced a true solar coaster over the last several months. First, the Executive Order allowed developers to resume activities. and Southeast Asian manufacturers could restart module shipments to the US. But then, UFLPA implementation led to the detention of several module shipments, further constraining supply and hindering project construction. Finally, the extension and expansion of the ITC provided the utility solar industry with more certainty, leading us to increase our five-year outlook by 52 GWdc (47%) compared to our outlooks without passage of the IRA.
Due to near-term supply chain constraints, we expect most (77%) of the effect of the IRA to materialize in the utility-scale segment after 2024. The lack of equipment availability has led to continued project delays, decreasing the 2022 forecast by 600 MWdc to 8.1 GWdc, the lowest annual total since 2018. The industry will continue to navigate the UFLPA requirements during the rest of the year, and we forecast supply will return to a steady state at some point in 2023. Increased polysilicon capacity outside of the Xinjiang region, diversification of module supply, materialization of domestic production plans, and continued high demand for renewable projects will lead to a total buildout of 162 GWdc of utility-scale projects throughout the forecast period.
4. US solar PV forecasts
5. National solar PV system pricing
Note: Wood Mackenzie has updated the reporting methodology for modeled prices to be consistent with the US solar system pricing reports. Therefore, figures shown below may not match those published in earlier editions of the US Solar Market Insight report.
Wood Mackenzie employs a bottom-up modeling methodology to capture, track and report national average PV system pricing by segment for systems installed each quarter. The methodology is based on the tracked wholesale pricing of major solar components and data collected from industry interviews. Wood Mackenzie assumes all product is procured and delivered in the same year as the installation except modules for the utility segment which are procured one year prior to commercial operation.
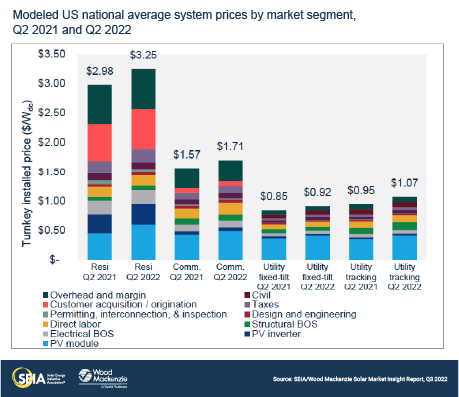
National system pricing continued to climb in Q2 2022 across all market segments compared to the previous quarter. Most of the price increases were tied to module price increases, caused by the uncertainty related to the anticircumvention case initiated by the DOC in March of this year. Module price increases were further compounded by high polysilicon prices and other raw material commodity price increases. System pricing increased year-over-year by 9% for residential, 8% for commercial, 8% for utility fixed-tilt and 13% for utility single-axis tracking solar projects.
About the Report
U.S. solar market insight® is a quarterly publication of Wood Mackenzie and the Solar Energy Industries Association (SEIA)®. Each quarter, we collect granular data on the U.S. solar market from nearly 200 utilities, state agencies, installers and manufacturers. This data provides the backbone of this U.S. Solar Market Insight® report, in which we identify and analyze trends in U.S. solar demand, manufacturing and pricing by state and market segment over the next five to ten years. All forecasts are from Wood Mackenzie, Limited; SEIA does not predict future pricing, bid terms, costs, deployment or supply. The report includes all 50 states and Washington, D.C. National totals reported also include Puerto Rico and other U.S. territories. Detailed data and forecasts for 50 states and Washington, D.C. are contained within the full version of the report.
References and Contact
-
References, data, charts and analysis from this executive summary should be attributed to “Wood Mackenzie/SEIA U.S. solar market insight®.”
-
Media inquiries should be directed to Wood Mackenzie’s PR team ([email protected]) and Morgan Lyons ([email protected]) at SEIA.
-
All figures are sourced from Wood Mackenzie. For more detail on methodology and sources, click here.
About the Authors
Wood Mackenzie Power & Renewables | U.S. Research Team
Michelle Davis, Principal Analyst (lead author)
Sylvia Leyba Martinez, Senior Analyst
Zoe Gaston, Principal Analyst
Sagar Chopra, Solar Analyst
Caitlin Connelly, Research Associate
Matthew Sahd, Research Associate
Chris Seiple, Senior Vice President
Solar Energy Industries Association | SEIA
Shawn Rumery, Senior Director of Research
Colin Silver, Chief of Staff and Chief Content Officer
Tyler Thompson, Research Analyst
Justin Baca, Vice President of Markets & Research
Note on U.S. solar market insight report title: The report title is based on the quarter in which the report is released, not the most recent quarter of installation figures.
License
Ownership rights
This report (“Report”) and all Solar Market Insight® (“SMI”)TM reports are jointly owned by Wood Mackenzie and the Solar Energy Industries Association (SEIA)®(jointly, “Owners”) and are protected by United States copyright and trademark laws and international copyright/intellectual property laws under applicable treaties and/or conventions. Purchaser of Report or other person obtaining a copy legally (“User”) agrees not to export Report into a country that does not have copyright/intellectual property laws that will protect rights of Owners therein.
Grant of license rights
Owners hereby grant user a non-exclusive, non-refundable, non-transferable Enterprise License, which allows you to (i) distribute the report within your organization across multiple locations to its representatives, employees or agents who are authorized by the organization to view the report in support of the organization’s internal business purposes, and (ii) display the report within your organization’s privately hosted internal intranet in support of your organization’s internal business purposes. Your right to distribute the report under an Enterprise License allows distribution among multiple locations or facilities to Authorized Users within your organization.
Owners retain exclusive and sole ownership of this report. User agrees not to permit any unauthorized use, reproduction, distribution, publication or electronic transmission of any report or the information/forecasts therein without the express written permission of Owners.
Disclaimer of warranty and liability
Owners have used their best efforts in collecting and preparing each report.
Owners, their employees, affiliates, agents, and licensors do not warrant the accuracy, completeness, correctness, non-infringement, merchantability, or fitness for a particular purpose of any reports covered by this agreement. Owners, their employees, affiliates, agents, or licensors shall not be liable to user or any third party for losses or injury caused in whole or part by our negligence or contingencies beyond Owners’ control in compiling, preparing or disseminating any report or for any decision made or action taken by user or any third party in reliance on such information or for any consequential, special, indirect or similar damages, even if Owners were advised of the possibility of the same. User agrees that the liability of Owners, their employees, affiliates, agents and licensors, if any, arising out of any kind of legal claim (whether in contract, tort or otherwise) in connection with its goods/services under this agreement shall not exceed the amount you paid to Owners for use of the report in question.

