
The quarterly SEIA/Wood Mackenzie Power & Renewables U.S. Solar Market Insight report shows the major trends in the U.S. solar industry. Learn more about the U.S. Solar Market Insight Report. Released December 13, 2022.
1. Key Figures
- In Q3 2022, the US solar market installed 4.6 GWdc of solar capacity, a 17% decrease from Q3 2021 and a 2% decrease from Q2 2022. The industry continues to be supply-constrained, most recently from import detentions.
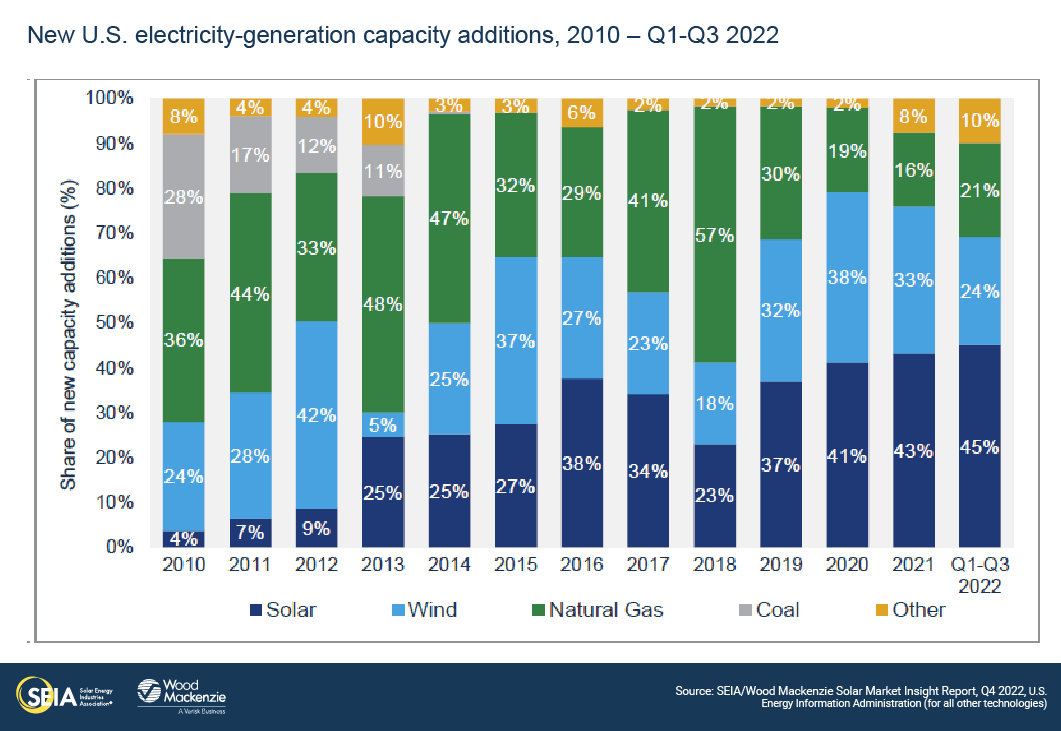
- Solar accounted for 45% of all new electricity-generating capacity added to the US grid through the third quarter, more than any other electricity source.
- The residential segment had a historic quarter with 1.57 GWdc installed, a 43% increase over Q3 2021 and a 16% increase over Q2 2022. California made up 36% of this total as installers continue to push to sell residential solar before changes to current net metering rates.
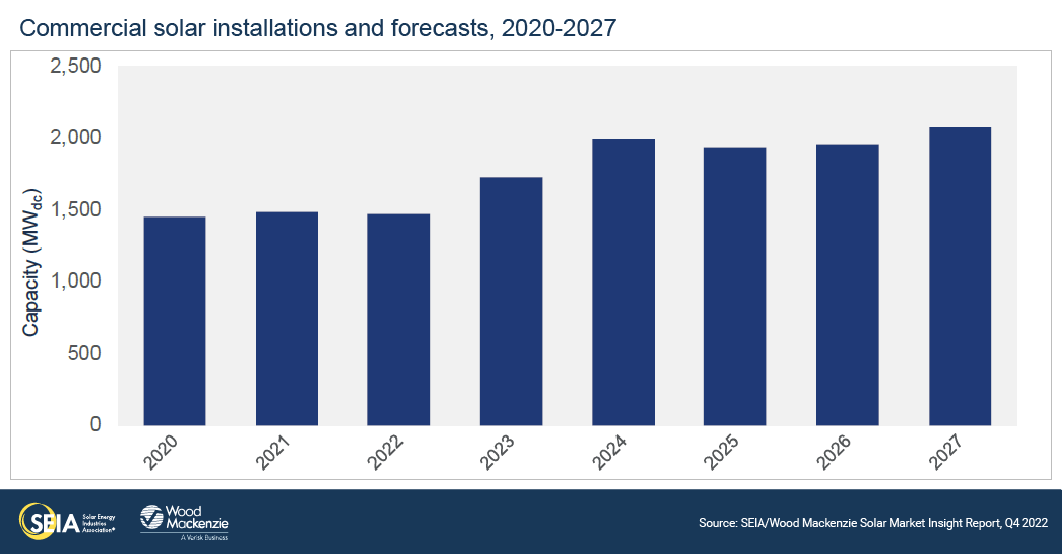
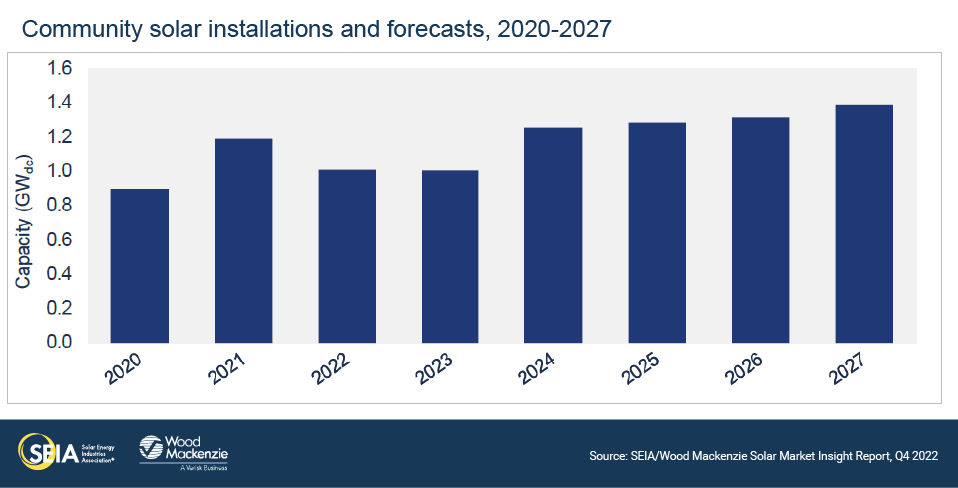
- There were 340 MWdc of commercial solar installed, up 3% year-over-year and down 10% quarter-over-quarter. Community solar developers installed 212 MWdc, down 17% both year-over-year and quarter-over-quarter.
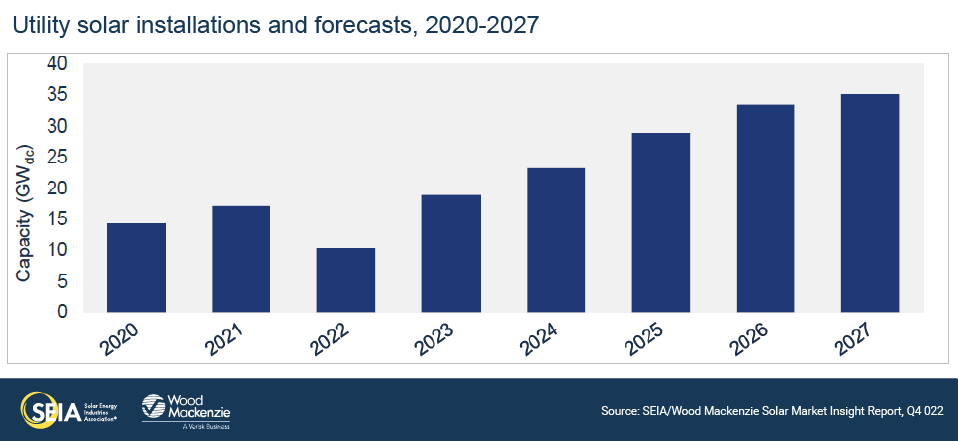
- The industry deployed 2.5 GWdc of utility-scale solar in Q3 2022, a 36% decrease from Q3 2021 and a 9% decrease from Q2 2022. The low installation figures are the result of previous project delays and continued supply chain constraints.
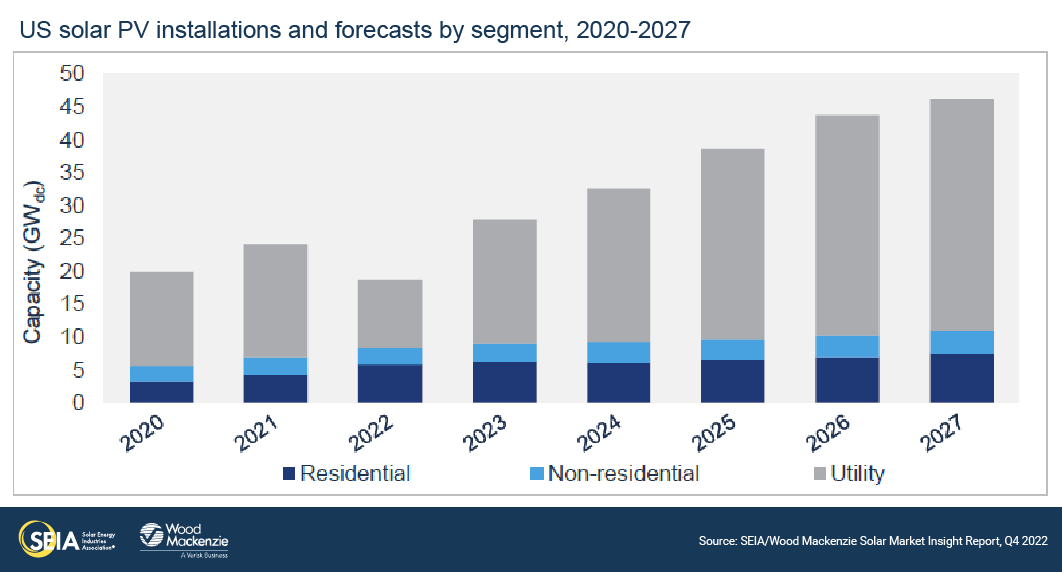
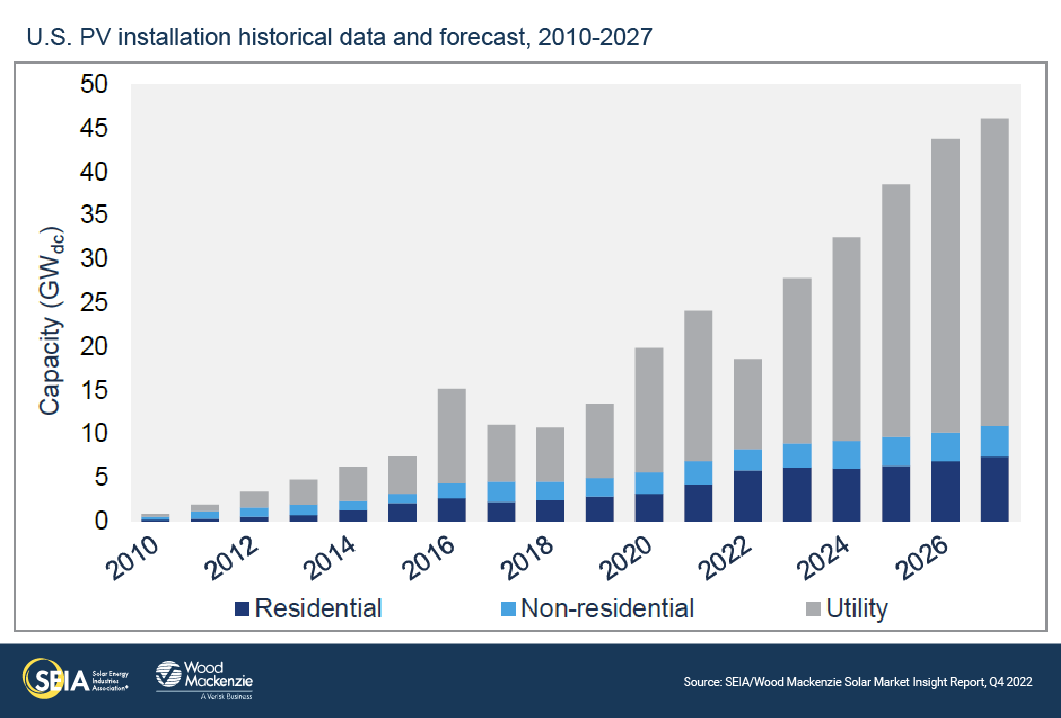
- Total 2022 installations are expected to land at 18.6 GWdc – a slight increase from our previous outlook, but still a 23% decrease from 2021. Utility-scale solar installations are expected to decline 40% from 2021 with only 10.3 GWdc installed.
- Wood Mackenzie expects the industry to remain supply-constrained through at least the second half of next year. Equipment importers are still contending with detainments as they seek to provide the documentation needed for compliance with the Uyghur Forced Labor Prevention Act (UFLPA).
- Once supply chain relief arrives, the true impacts of the Inflation Reduction Act will manifest in our outlooks. Beginning in 2024, annual installations of solar will consistently reach 30-40 GWdc.
- On December 2nd, the Department of Commerce issued a preliminary affirmative ruling in the anticircumvention case initiated earlier this year. While the ruling was not issued in time to allow for incorporation into our forecasts, new tariffs present a downside risk to our outlook.
2. Introduction
The US solar industry installed 4.6 gigawatts-direct current (GWdc) of capacity in the third quarter of 2022, a 17% decrease from Q3 2021 and a 2% decrease from Q2 2022.
Commercial, community, and utility-scale solar were all down quarter-over-quarter – an unsurprising outcome given the nearly ubiquitous project delays from supply chain constraints. These segments installed 340 MWdc, 212 MWdc, and 2.5 GWdc, respectively. If utility-scale solar reaches our 2022 forecast of 10.3 GWdc, it will reflect a 40% drop from 2021 volumes.
The trend for residential solar looks quite different. Quarterly installs set another record at 1,568 MWdc. The fundamentals for residential solar are strong – customers crave energy independence and savings from a solar system, particularly as retail power prices increase. Record volumes in California are also driving this growth, as the industry rushes to capture sales before the state shifts to a new net metering policy. More analysis of California market trends and their impact on the residential sector can be found in the full report.
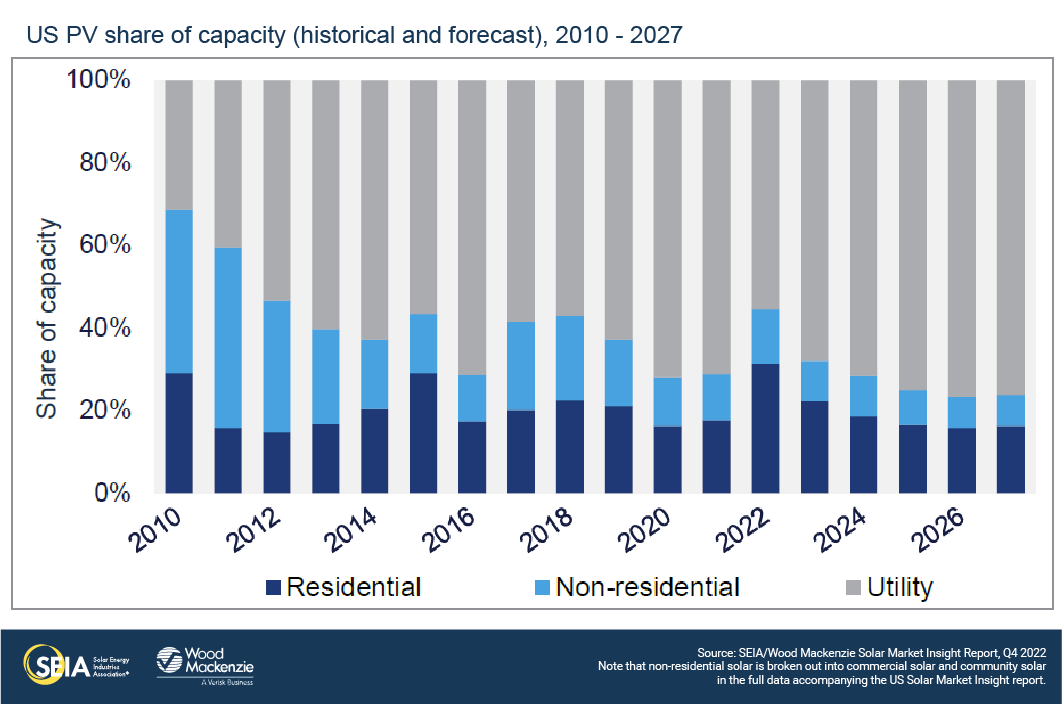
Overall, solar PV accounted for 45% of all new electricity-generating capacity additions through the third quarter.
An industry waits
After a year of starts and stops, the US solar industry once again finds itself waiting on the outcomes of several key policy issues. The first, and most pressing, is how US Customs and Border Protection (CBP) will manage the approval process under the UFLPA and the release of hundreds of solar equipment shipments still being detained.
The UFLPA took effect on June 21st, with detentions beginning shortly thereafter, but even after several months, CBP has not made major releases of equipment. As mentioned in last quarter’s report, the requirements to demonstrate compliance with the UFLPA are more rigorous than those for the Withhold Release Order (WRO) issued last fall. Last quarter, importers were working with CBP on the required documentation and were expecting near-term releases as some manufacturers had started to file admissibility packages.
Unfortunately, little has changed since then. It is proving more difficult than expected to provide traceability for the sourcing of quartzite used in solar equipment. There are many questions around the required documentation that is needed to demonstrate compliance with the UFLPA. Furthermore, the CBP is still releasing detentions from last fall’s WRO, a sign that UFLPA releases could take just as long. We still expect supply chain relief to arrive in the second half of 2023, but the exact timing is uncertain.
The solar industry is also waiting on guidance from the US Department of Treasury on how to qualify for the various tax credits and adders within the Inflation Reduction Act (IRA). These incentives will undoubtedly provide upside for solar project development, but without more specifics from the US government, it’s difficult to assess which projects will qualify for various adders. The overwhelming sentiment from developers this quarter was that it’s too soon to know how the bonus adders will impact their business.
Treasury collected public comments on various aspects of the IRA tax credits, which were due on November 4th. While there’s no firm deadline for all Treasury guidance, most is expected sometime in the first quarter of 2023. Given this uncertainty, Wood Mackenzie has assumed most projects will earn the 30% ITC or $26/MWh PTC. In the medium-term, the availability of bonus adders will certainly provide upside to our outlooks after supply chain issues have been resolved.
California moves to net billing for distributed solar
Uncertainty around supply chain constraints and IRA qualifications aside, the distributed solar industry received some clarity for the segment’s largest market. The California Public Utilities Commission (CPUC) issued the highly anticipated revision of its Proposed Decision (PD) for the next generation of net metering tariffs (“NEM 3.0″). November’s PD makes several substantial changes to the first proposal from December 2021.
The November PD maintains several elements of the previous proposal (a shift to a “net billing” structure instead of “net metering” and compensating exports at the avoided cost rate) but eliminates others (the Grid Participation Charge and Market Transition Credit). On balance, the new PD certainly elongates current payback periods for solar and solar-plus-storage, but not by as much as the previous proposal. Therefore, we still expect market contraction in both the residential and non-residential markets.
Importantly, if the November PD is finalized in its current form, the largest distributed solar market will no longer compensate solar exports at a customer’s retail rate. More details on the PD and its impact can be found in the full report.
Average annual growth of 21% expected after 2022
After 2022, we expect the solar industry to return to growth. In 2023, some projects that were delayed this year should obtain module supply and come online. And by 2024, the real impacts of the IRA will begin to come to fruition. From 2023-2027, Wood Mackenzie forecasts 21% average annual growth across all solar segments.
It is worth noting that on December 2nd, the Department of Commerce (DOC) issued an affirmative preliminary determination on the anticircumvention case that was initiated earlier this year. This means that by early June 2024, new antidumping and countervailing duties (AD/CVD) could be applied to solar cells and module imports from certain companies with facilities in the four named Southeast Asian countries. The tariff rates will vary between producers.
In this report, our outlook does not include additional AD/CVD tariffs stemming from this case. New tariffs present downside risk to our forecasts, but it’s too early to tell the extent of the impacts. We will be incorporating the impacts into future outlooks upon further investigation.
3. Market segment outlooks
3.1. Residential PV
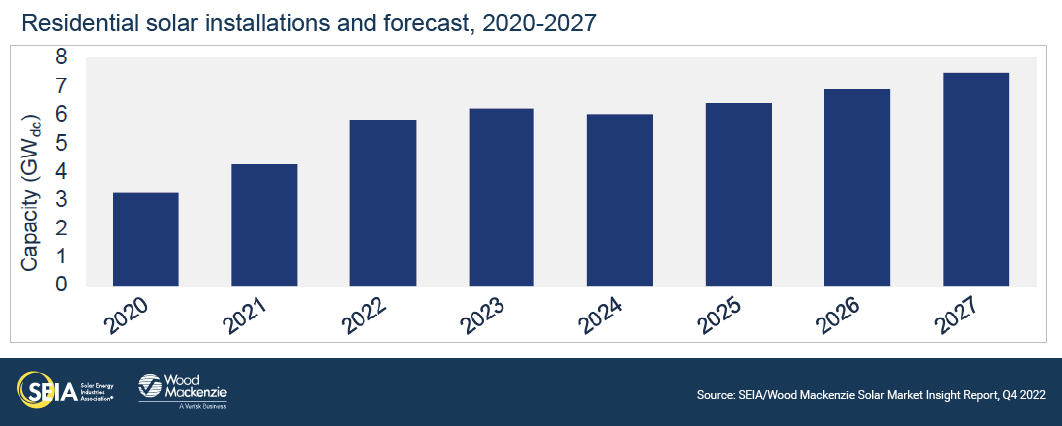
- 1,568 MWdc installed in Q3 2022
- Up 43% from Q3 2021
- Up 16% from Q2 2022
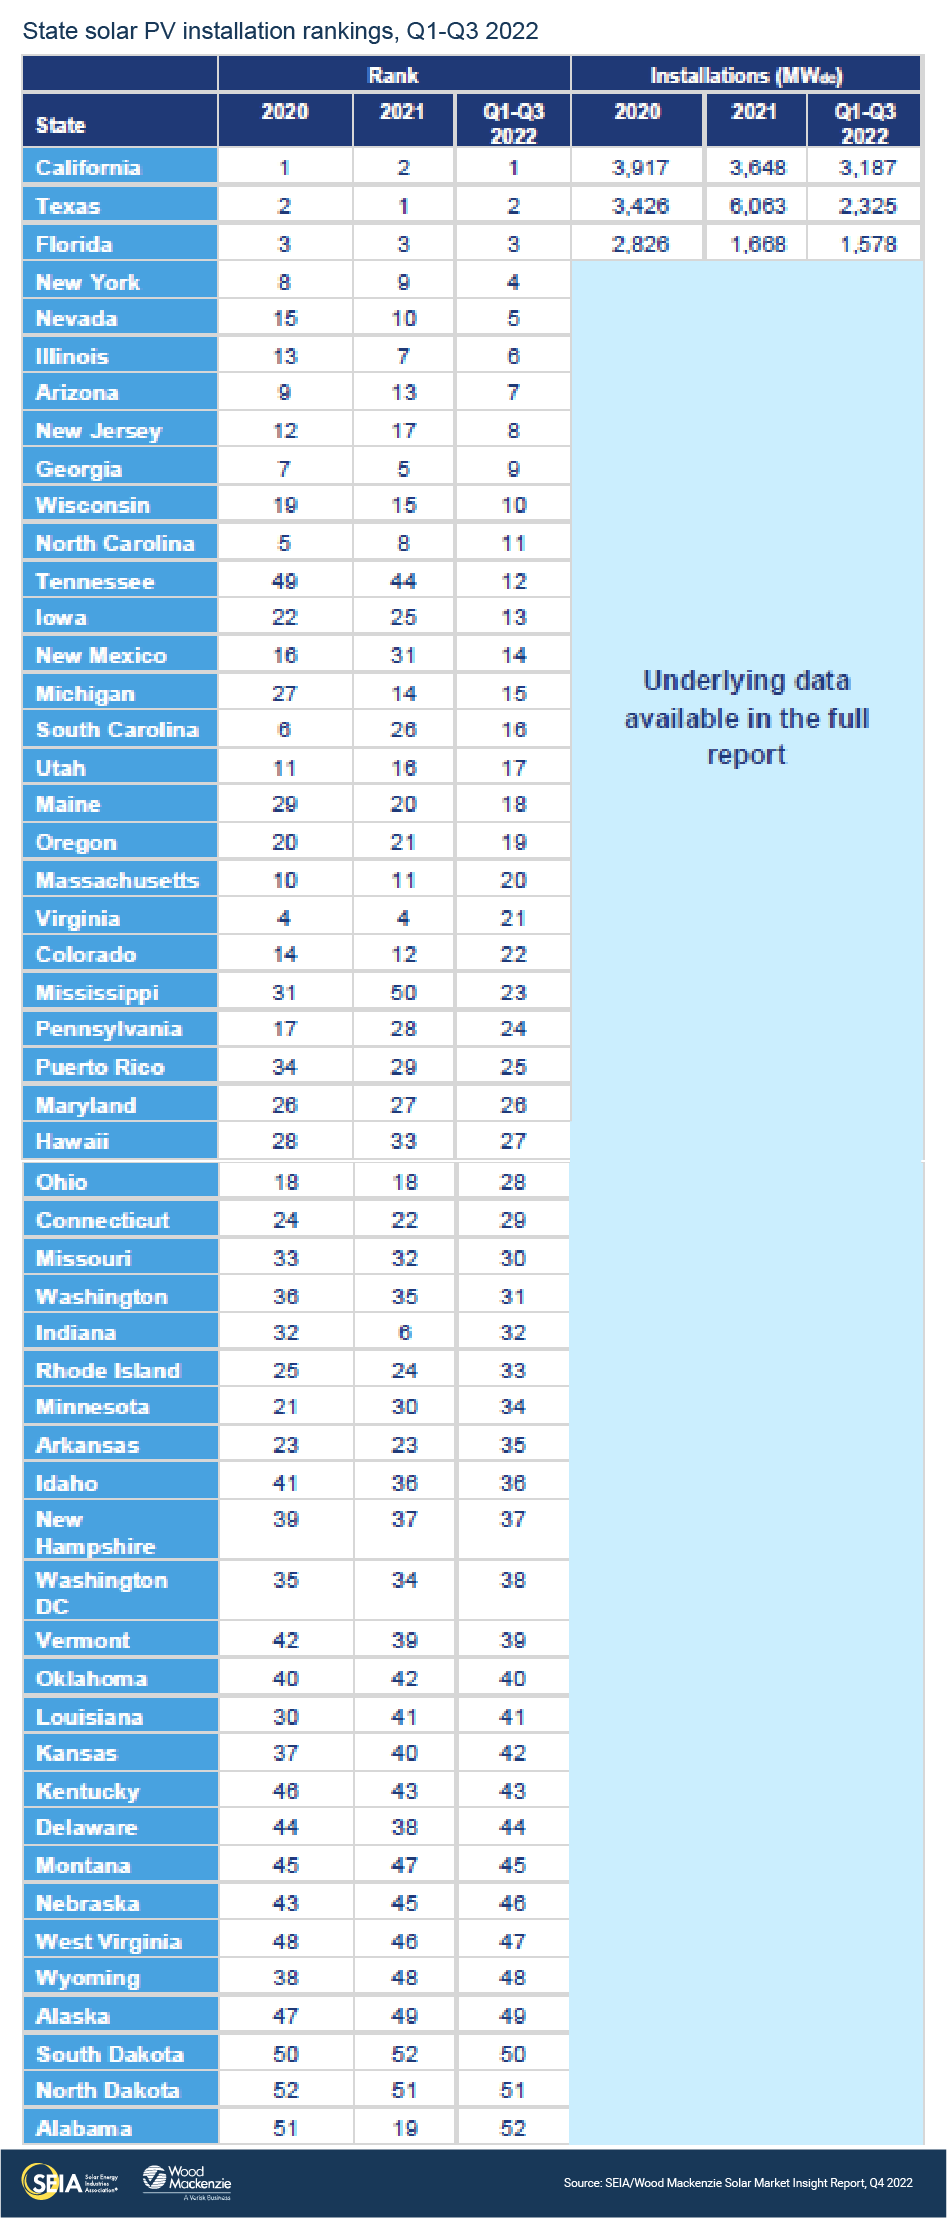
More than 1,500 MWdc were installed in the residential solar market in one quarter for the first time in Q3 2022. Nineteen states set quarterly records in Q3, with California (571 MWdc), Florida (150 MWdc), and Texas (130 MWdc) again installing the most capacity. California alone surpassed 500 MWdc for the first time. Although some installers continue to face challenges (supply constraints, interest rate increases, permitting and utility interconnection delays), recent retail rate inflation is a significant driver of growth.
Many installers indicate that module supply normalized in Q3 and they were able to secure modules for Q4 installations. However, as a result of supply chain issues from early 2022, coupled with strong demand, installers are still working through lingering customer backlogs. Permitting and utility interconnection delays in certain markets exacerbated these backlogs, with reports of some inspection times exceeding six months.
As a result of these trends, we have increased our residential outlook for 2022 to 37% year-over-year growth. We expect high retail rates and California demand pull-in to result in record installations as installers make progress on their backlogs. The release of the Revised PD in California fundamentally changes the shape of our long-term residential solar outlook. With implementation expected in April of next year, we expect high levels of installations through Q3 2023 as customers who submit an interconnection application before the deadline will qualify under NEM 2.0. 2024 will be the first full year of impacts from the new NEM 3.0 policy, contracting the California market by 39% and causing a 3% contraction in the national market. The residential solar industry also awaits guidance on implementation of the ITC adders, which may shake up the product landscape and provide a boost to third-party owned (TPO) projects.
3.2. Commercial PV
- 340 MWdc installed in Q3 2022
- Up 3% from Q3 2021, down 10% from Q2 2022
Note on market segmentation: Commercial solar encompasses distributed solar projects with commercial, industrial, agricultural, school, government or nonprofit offtakers, including remotely net-metered projects. This excludes community solar (covered in the following section).
Commercial solar volumes fell quarter-over-quarter as project delays from earlier in the year manifested. However, installation volumes did not contract as much as originally anticipated. Surprisingly, installations through the third quarter roughly match those of 2021. While there are some state-specific dynamics that partially explain this, it is still clear that 2022 volumes have been suppressed due to the supply chain constraints of the last year. Overall, we expect 2022 to be flat compared to 2021.
Next year will be a better year for the sector, with 17% growth expected. However, this represents a lower growth forecast than we were expecting last quarter, due to both the increase in projects expected to come online before the end of 2022, as well as reductions to a few states, including New Jersey and New York.
As mentioned in the Introduction, our forecasts do not incorporate any impacts from the ITC or PTC adders. Thus far, the low-income and energy communities adders are the most appealing to the commercial solar industry. The adders provide upside to our outlook, with commercial solar growing at an average annual rate of 7% through 2027. While there are still many challenges to commercial solar project execution, the IRA tailwinds should help sustain modest growth.
3.3. Community solar PV
- 212 MWdc installed in Q3 2022
- Down 17% from Q3 2021, down 17% from Q2 2022
Note on market segmentation: Community solar projects are part of formal programs where multiple customers can subscribe to the power produced by a local solar project and receive credits on their utility bills.
Community solar installations declined in Q3 2022 for the second consecutive quarter. Low installation volumes in three key states—Maine, Massachusetts, and Maryland—contributed to most of the national decline. Interconnection backlogs and siting constraints continue to be the major obstacles hindering growth in these states. Additionally, the last several quarters of nation-wide supply chain constraints are extending project timelines into 2023 and beyond, limiting near-term installations.
Despite these challenges, our expectations for community solar in 2022 have increased by 8% compared to our previous outlook. This increase is driven primarily by significant growth in New York. The project pipeline in the state continues to come online at a very healthy pace, leading us to increase the forecast for 2022 by 21% compared to the previous outlook. Third quarter installation volumes in New York accounted for more than 60% of the national market.
Beginning this quarter, we have added a community solar forecast for California due to the passage of legislation requiring a state-wide community solar program. Although policy makers have not finalized many details of the program, we estimate it will result in an additional 570 MWdc between 2024 and 2027. We attribute growth in our national five-year forecast to favorable conditions resulting from the IRA, as well as state policy initiatives in both mature and emerging community solar markets.
3.4. Utility PV
- 2,460 MWdc installed in Q3 2022
- 150 GWdc of utility-scale solar will be added between 2022 and 2027
Supply chain issues continued to constrain utility-scale deployments in Q3 2022. 2.5 GWdc were installed during the third quarter, bringing the 2022 total to 7.4 GWdc – barely two-thirds of the volume installed at this time last year. Another 4.5 GWdc of newly contracted capacity was signed this quarter, the majority of which will come online between 2024-2025. This brings the total pipeline to 90 GWdc, a slight increase compared to last quarter. There are currently 30 GWdc of projects under construction, though module shipment delays are stalling progress.
Industry players are cautiously optimistic as they begin to navigate newly available tax credit adders and financing options included in the IRA. Due to uncertainty around specific adder requirements, Wood Mackenzie assumes that utility-scale projects will earn the 30% ITC or the $26/MWh PTC, with most opting for the latter. The IRA’s impacts are not expected to fully materialize until 2024-2025, while the near-term pipeline remains vulnerable to delays and cancellations.
As mentioned in the Introduction, UFLPA enforcement has caused widespread module detentions as the industry has scrambled to develop quartzite sourcing documentation. Because polysilicon sourced outside of China comprises a small share of the current market, the inability to demonstrate traceability of the quartzite will continue to threaten US module supply.
Wood Mackenzie anticipates another 2.8 GWdc of utility-scale solar will come online this year, increasing the 2022 outlook to 10.3 GWdc. After this year, IRA-driven demand and supply normalization will boost the utility-scale sector to 150 GWdc of installations through the forecast period.
4. US solar PV forecasts
5. National solar PV system pricing
Note: Wood Mackenzie has updated the reporting methodology for modeled prices to be consistent with the US solar system pricing reports. Therefore, figures shown below may not match those published in earlier editions of the US Solar Market Insight report.
Wood Mackenzie employs a bottom-up modeling methodology to capture, track and report national average PV system pricing by segment for systems installed each quarter. The methodology is based on the tracked wholesale pricing of major solar components and data collected from industry interviews. Wood Mackenzie assumes all product is procured and delivered in the same year as the installation except modules for the utility segment, which are procured one year prior to commercial operation.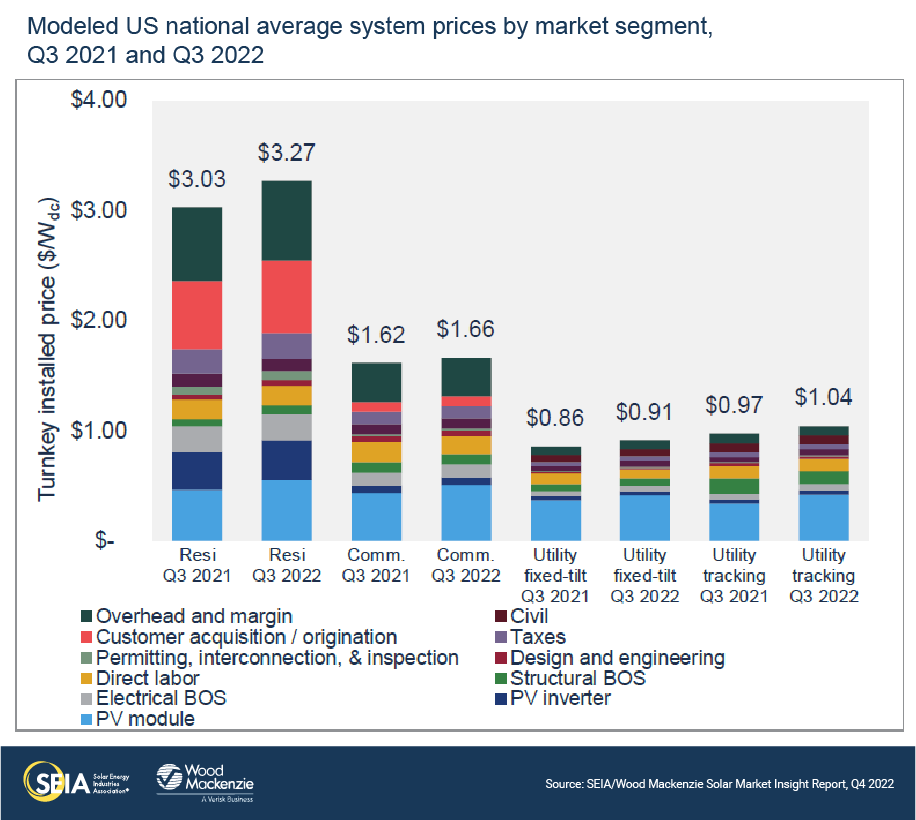 System pricing increased by 8% for residential solar and by 3% for commercial solar compared to Q3 2021, as the impacts of the anticircumvention case and UFLPA continue to create a high pricing environment for modules. Pricing for utility-scale systems was also up by 6% for fixed-tilt and 7% for tracker systems compared to last year. Module pricing continues to climb on the heels of rising polysilicon prices. Equipment pricing and labor costs are also high, due to rising inflation, keeping system prices high across all segments.
About the Report
U.S. solar market insight® is a quarterly publication of Wood Mackenzie and the Solar Energy Industries Association (SEIA)®. Each quarter, we collect granular data on the U.S. solar market from nearly 200 utilities, state agencies, installers and manufacturers. This data provides the backbone of this U.S. Solar Market Insight® report, in which we identify and analyze trends in U.S. solar demand, manufacturing and pricing by state and market segment over the next five to ten years. All forecasts are from Wood Mackenzie, Limited; SEIA does not predict future pricing, bid terms, costs, deployment or supply. The report includes all 50 states and Washington, D.C. National totals reported also include Puerto Rico and other U.S. territories. Detailed data and forecasts for 50 states and Washington, D.C. are contained within the full version of the report.
References and Contact
-
References, data, charts and analysis from this executive summary should be attributed to “Wood Mackenzie/SEIA U.S. solar market insight®.”
-
Media inquiries should be directed to Wood Mackenzie’s PR team ([email protected]) and Morgan Lyons ([email protected]) at SEIA.
-
All figures are sourced from Wood Mackenzie. For more detail on methodology and sources, click here.
About the Authors
Wood Mackenzie Power & Renewables | U.S. Research Team
Michelle Davis, Principal Analyst (lead author)
Sylvia Leyba Martinez, Senior Analyst
Zoe Gaston, Principal Analyst
Sagar Chopra, Solar Analyst
Caitlin Connelly, Research Associate
Matthew Sahd, Research Associate
Chris Seiple, Senior Vice President
Solar Energy Industries Association | SEIA
Shawn Rumery, Senior Director of Research
Colin Silver, Chief of Staff and Chief Content Officer
Tyler Thompson, Research Analyst
Justin Baca, Vice President of Markets & Research
Note on U.S. solar market insight report title: The report title is based on the quarter in which the report is released, not the most recent quarter of installation figures.
License
Ownership rights
This report (“Report”) and all Solar Market Insight® (“SMI”)TM reports are jointly owned by Wood Mackenzie and the Solar Energy Industries Association (SEIA)®(jointly, “Owners”) and are protected by United States copyright and trademark laws and international copyright/intellectual property laws under applicable treaties and/or conventions. Purchaser of Report or other person obtaining a copy legally (“User”) agrees not to export Report into a country that does not have copyright/intellectual property laws that will protect rights of Owners therein.
Grant of license rights
Owners hereby grant user a non-exclusive, non-refundable, non-transferable Enterprise License, which allows you to (i) distribute the report within your organization across multiple locations to its representatives, employees or agents who are authorized by the organization to view the report in support of the organization’s internal business purposes, and (ii) display the report within your organization’s privately hosted internal intranet in support of your organization’s internal business purposes. Your right to distribute the report under an Enterprise License allows distribution among multiple locations or facilities to Authorized Users within your organization.
Owners retain exclusive and sole ownership of this report. User agrees not to permit any unauthorized use, reproduction, distribution, publication or electronic transmission of any report or the information/forecasts therein without the express written permission of Owners.
Disclaimer of warranty and liability
Owners have used their best efforts in collecting and preparing each report.
Owners, their employees, affiliates, agents, and licensors do not warrant the accuracy, completeness, correctness, non-infringement, merchantability, or fitness for a particular purpose of any reports covered by this agreement. Owners, their employees, affiliates, agents, or licensors shall not be liable to user or any third party for losses or injury caused in whole or part by our negligence or contingencies beyond Owners’ control in compiling, preparing or disseminating any report or for any decision made or action taken by user or any third party in reliance on such information or for any consequential, special, indirect or similar damages, even if Owners were advised of the possibility of the same. User agrees that the liability of Owners, their employees, affiliates, agents and licensors, if any, arising out of any kind of legal claim (whether in contract, tort or otherwise) in connection with its goods/services under this agreement shall not exceed the amount you paid to Owners for use of the report in question.

