
Solar Market Insight Report 2023 Year in Review

1. Key figures
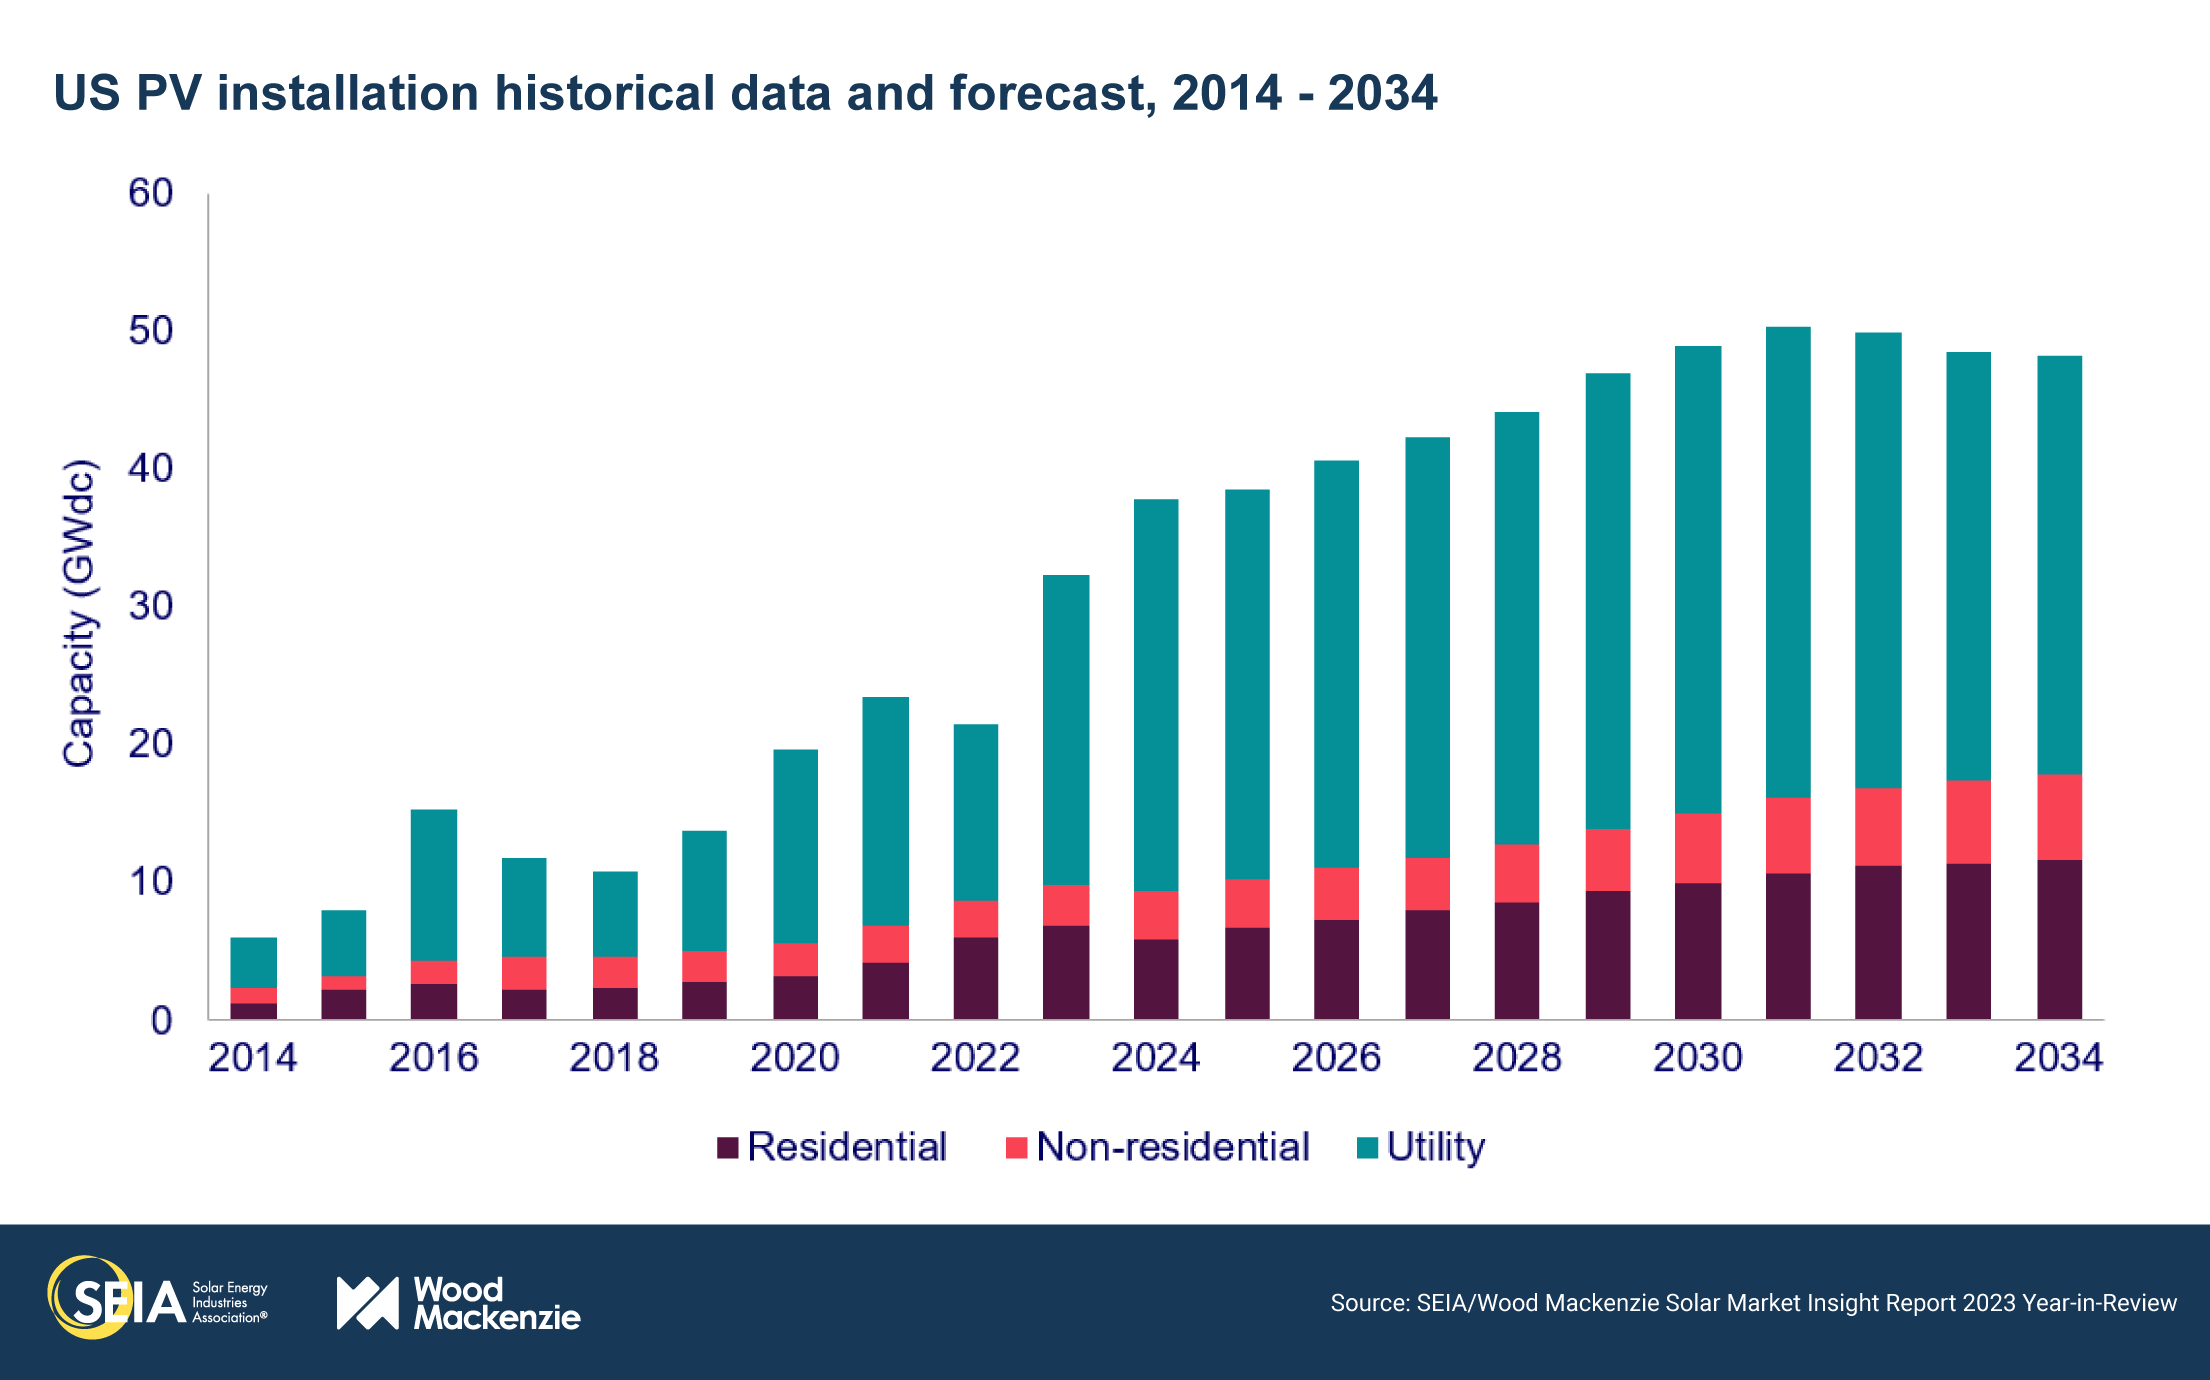
- In 2023, the US solar market installed 32.4 GWdc of capacity, a remarkable 51% increase from 2022. This was the industry’s biggest year by far, exceeding 30 GWdc of capacity for the first time.
- Solar accounted for 53% of all new electricity-generating capacity added to the US grid in 2023, making up over half of new generating capacity for the first time.
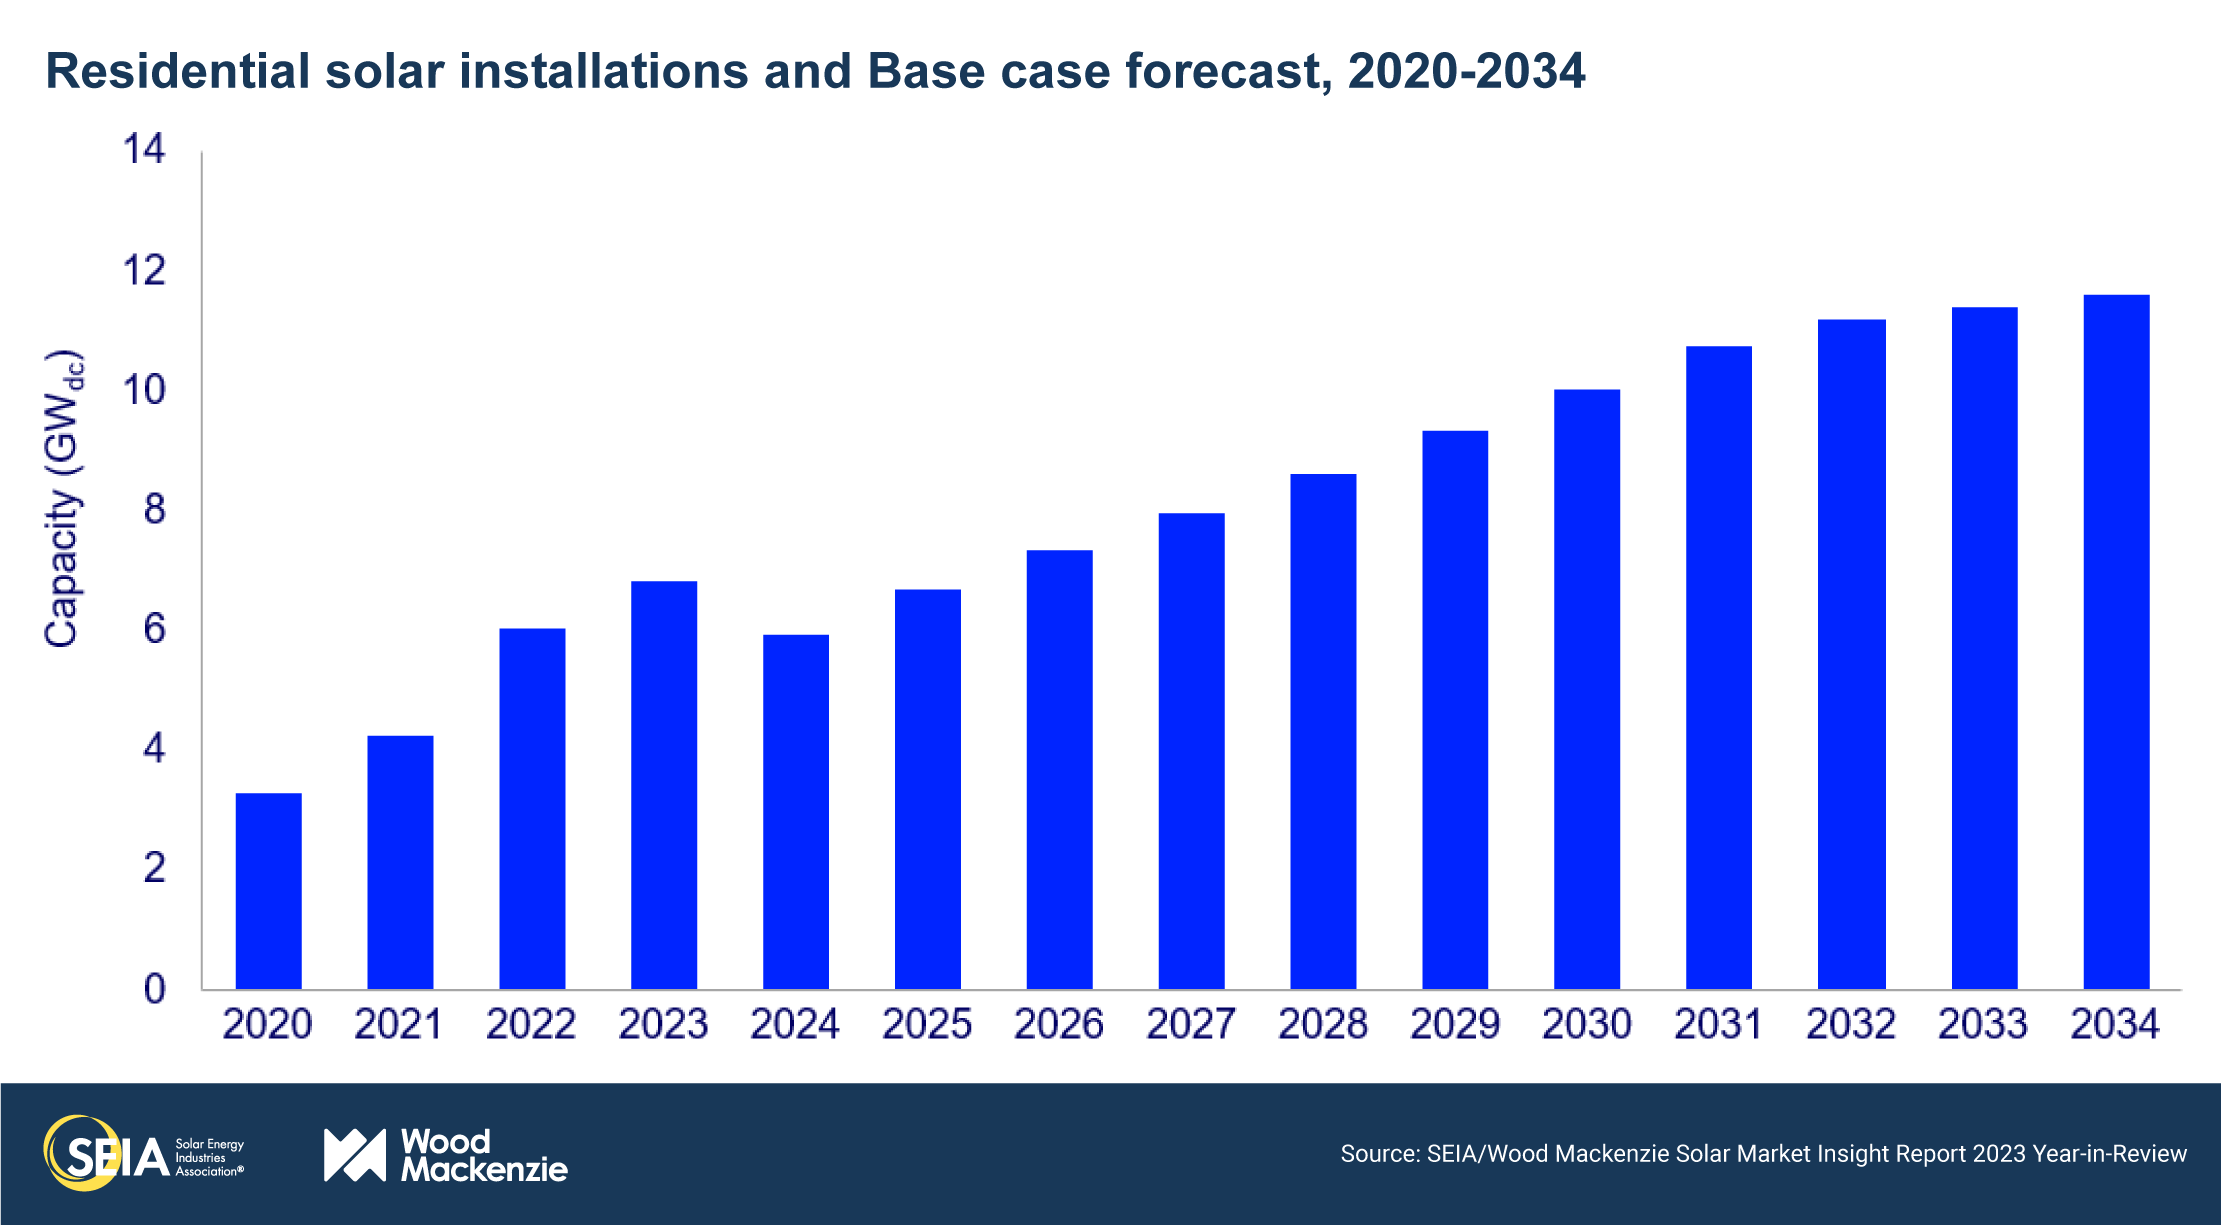
- The residential segment set another annual record at 6.8 GWdc installed in 2023, growing 13% over 2022. However, installations declined both quarter-over-quarter and year-over-year in Q4 as the large pipeline of California projects sold under more beneficial net metering rules in early 2023 was built out. Excluding California, the residential segment remained flat quarter-over-quarter.
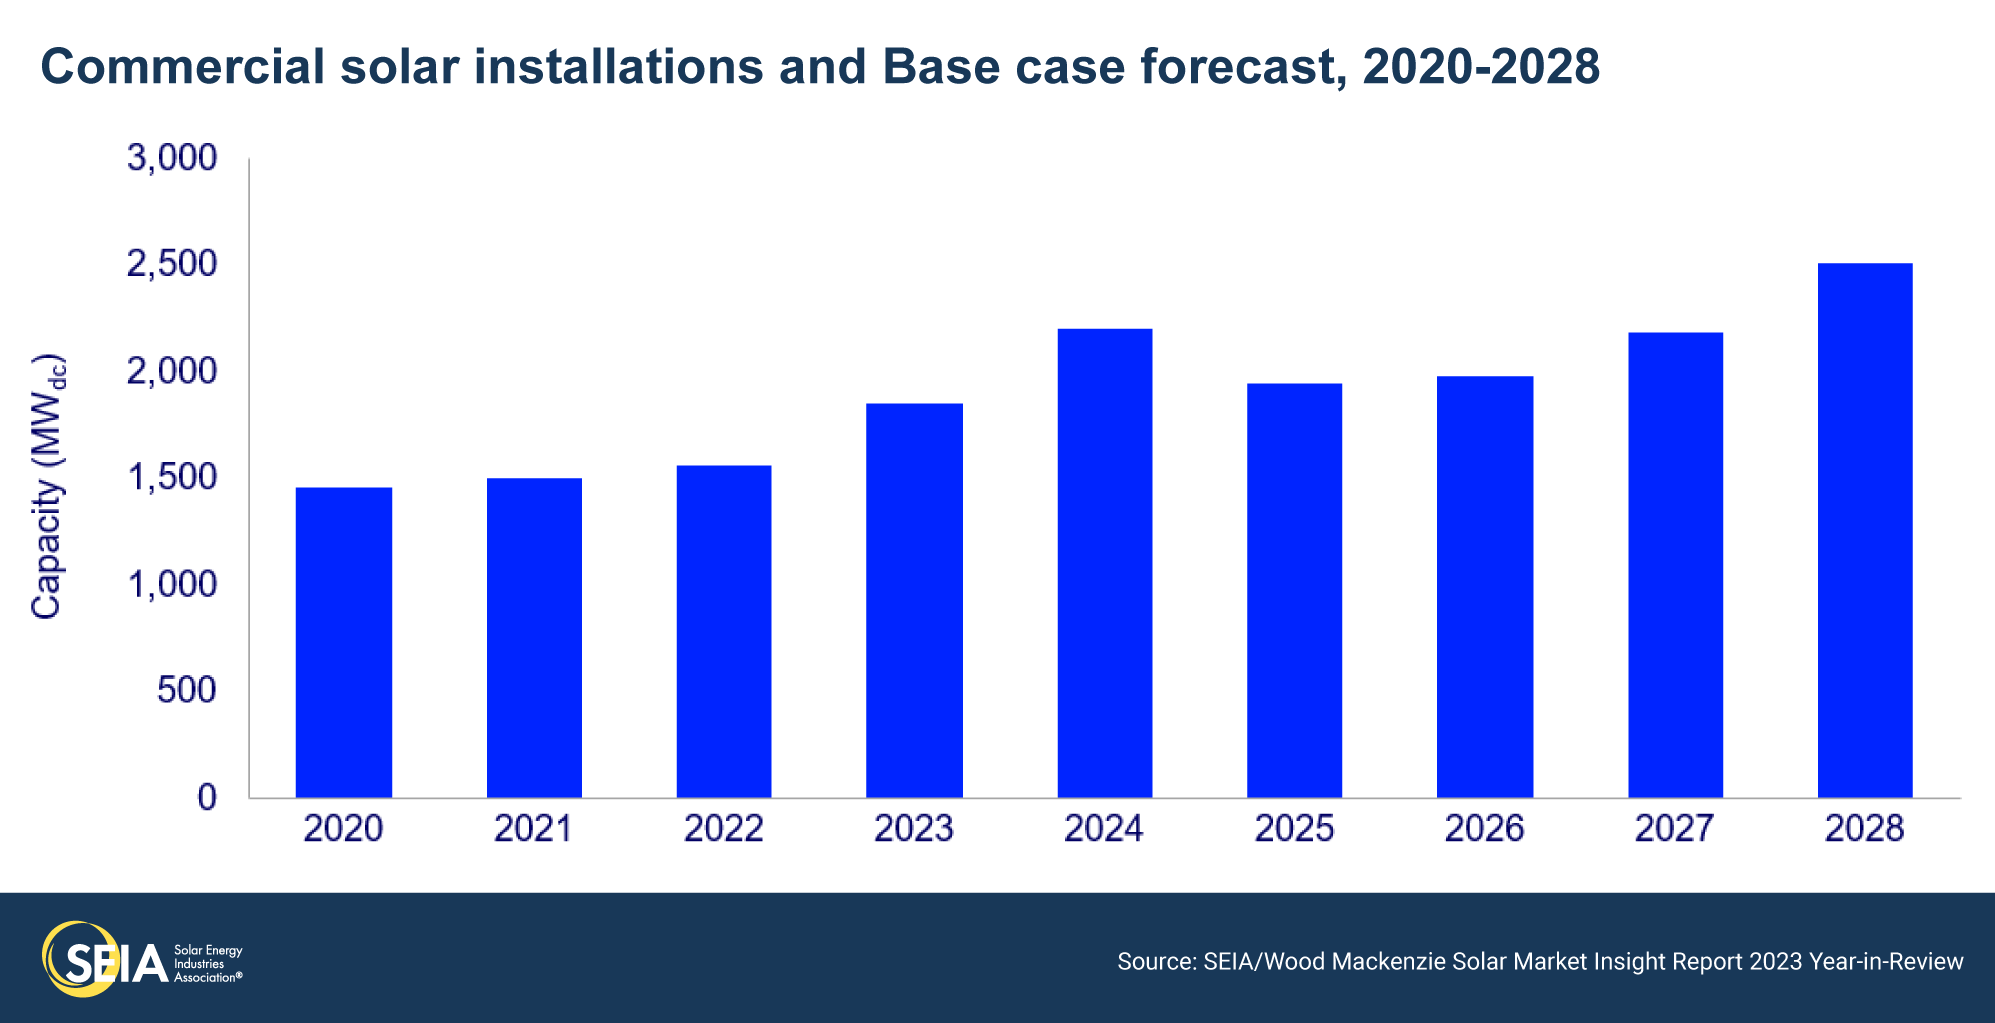
- The commercial solar segment broke an annual record that has stood since 2017, with 1,851 MWdc installed, growing 19% over 2022. Fourth quarter volumes in California doubled from their typical range as the commercial sector started to see the same surge of installations caused by the switch to net billing.
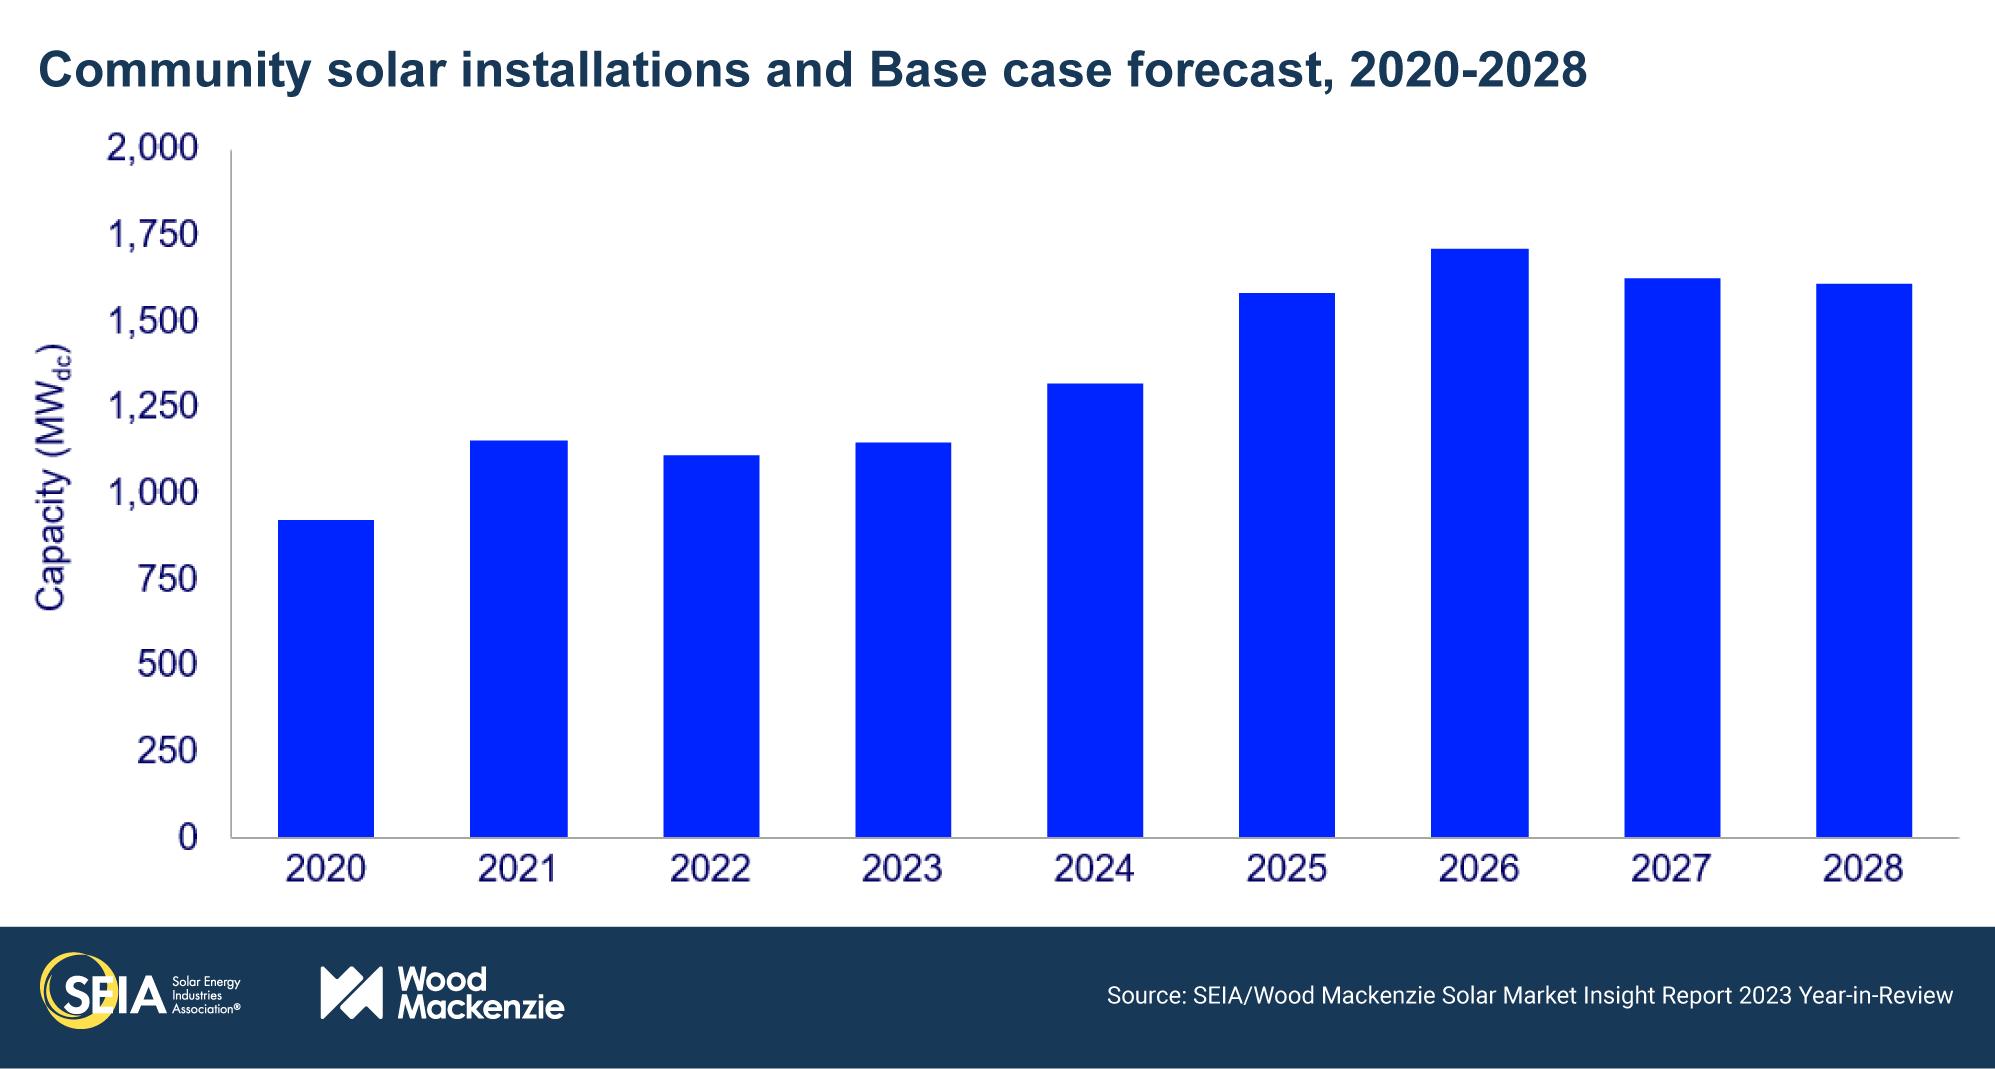
- The community solar segment installed 1,148 MWdc, a 3% increase over 2022. New York, the largest community solar market that has driven the sector’s growth for several years, declined slightly from 2022. Interconnection delays and permitting challenges continue to limit deployment in other mature markets.
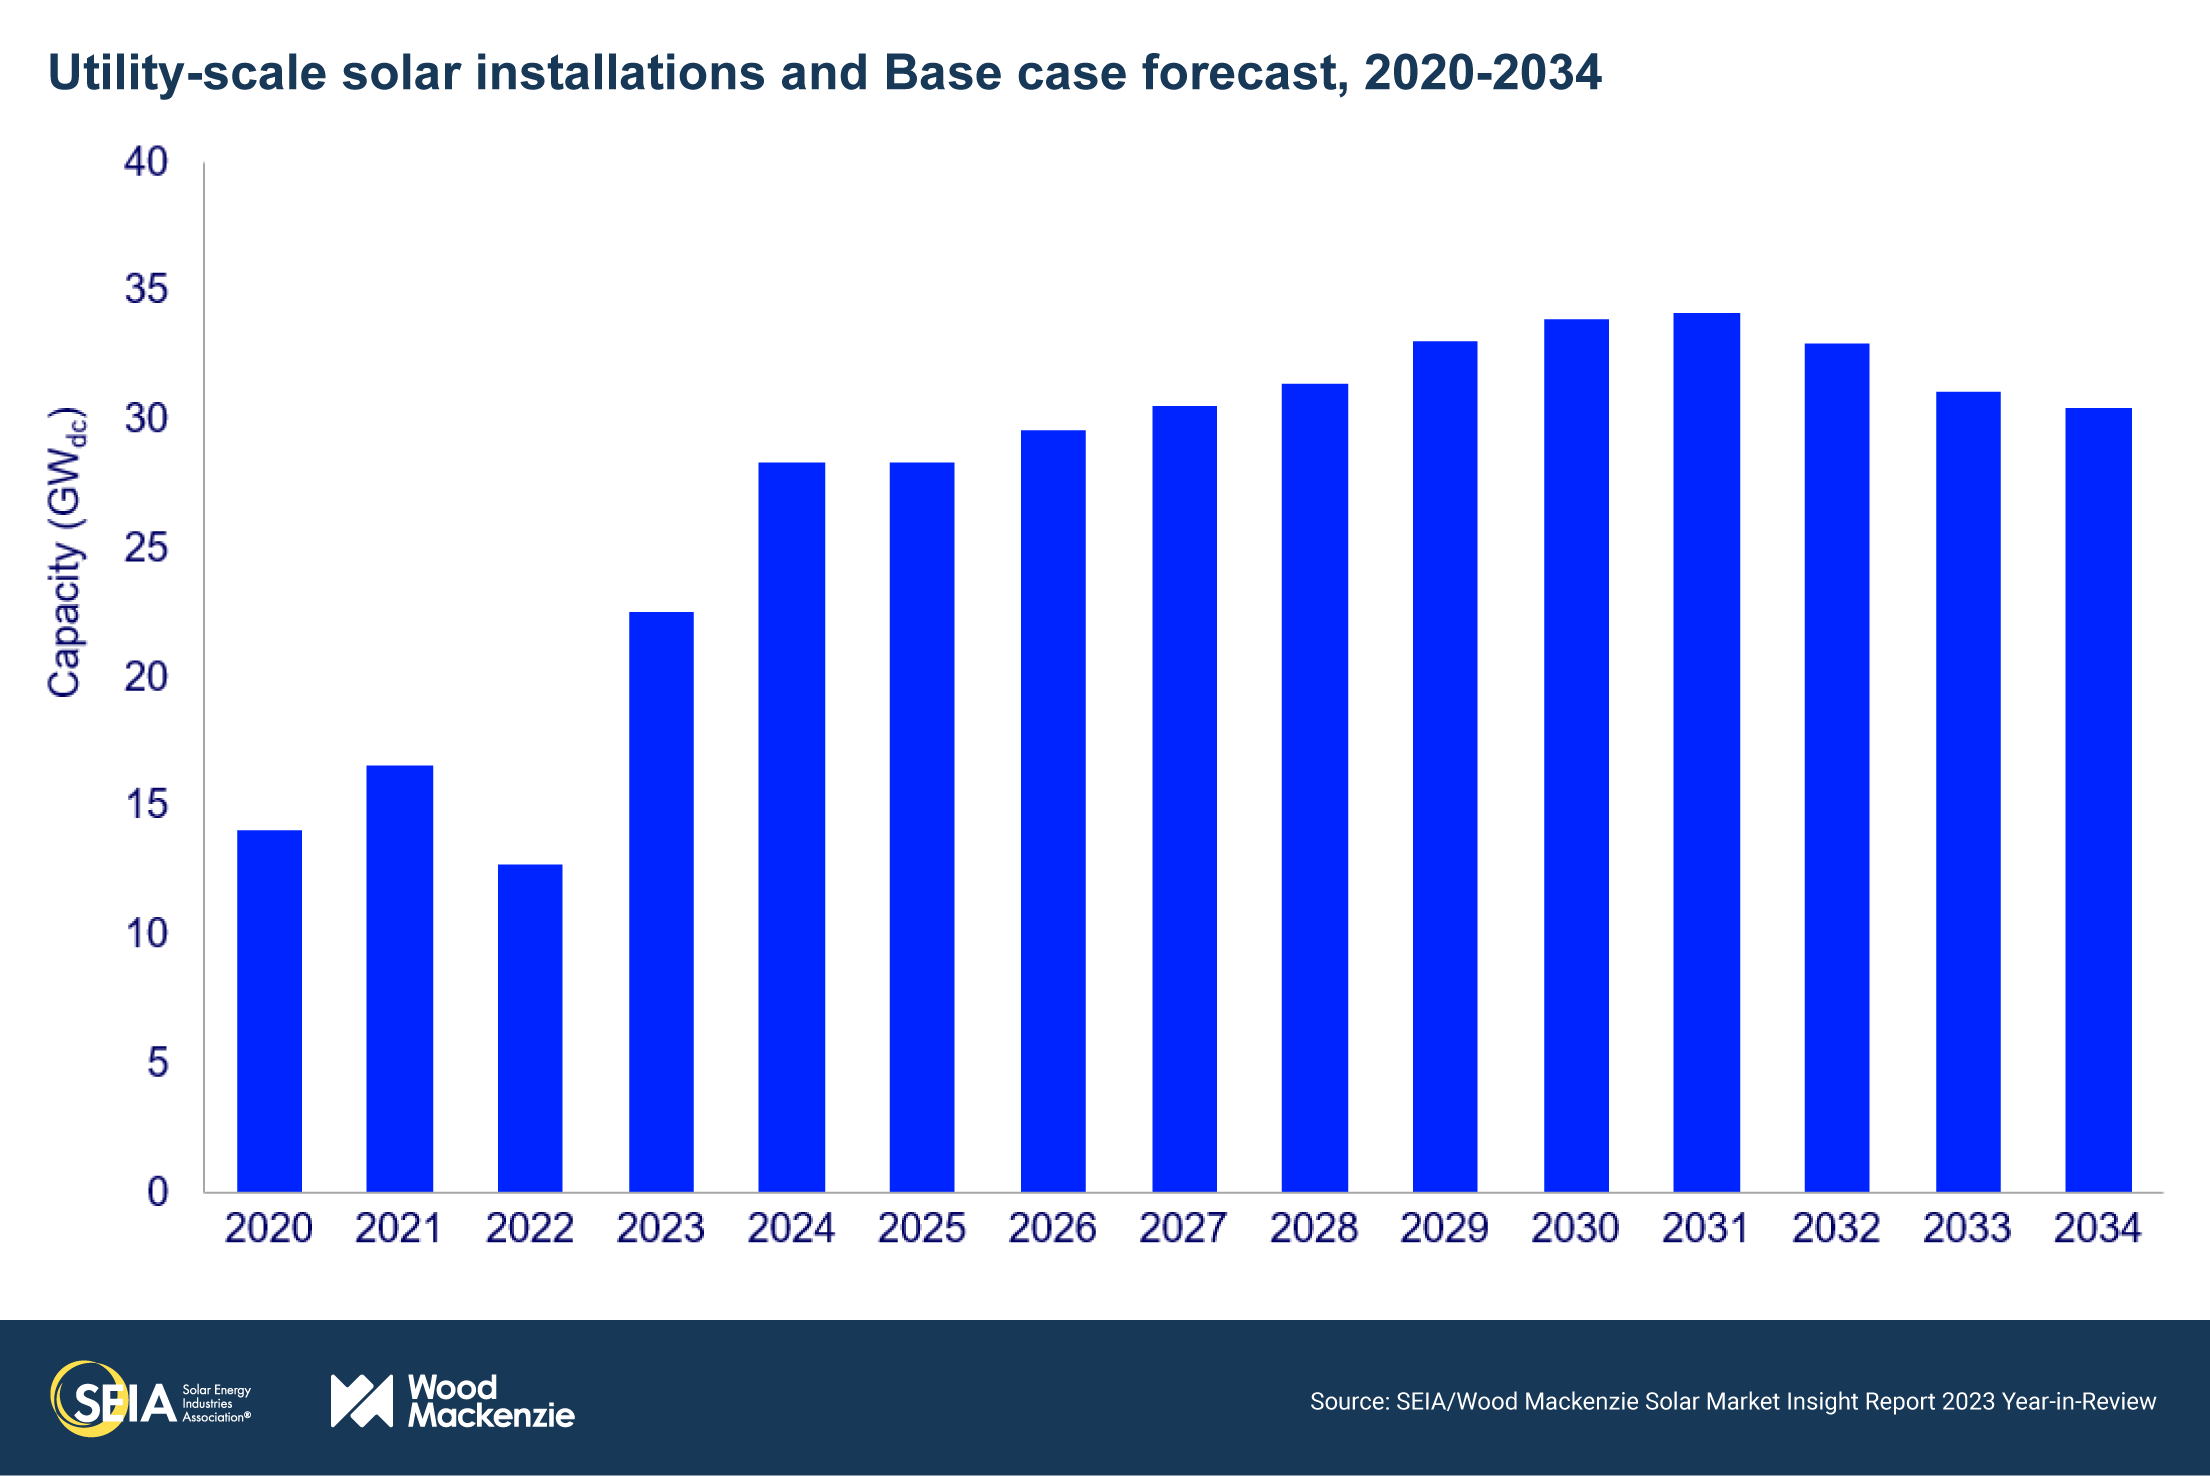
- The utility-scale segment installed a record-breaking 22.5 GWdc in 2023, representing 77% annual growth and nearly 10 GWdc more than 2022. More than 10 GWdc was installed in the fourth quarter. This growth underscores the market impact of supply chain constraints in 2022. Many of the projects completed in 2023 represent delayed buildout of 2022 pipelines.
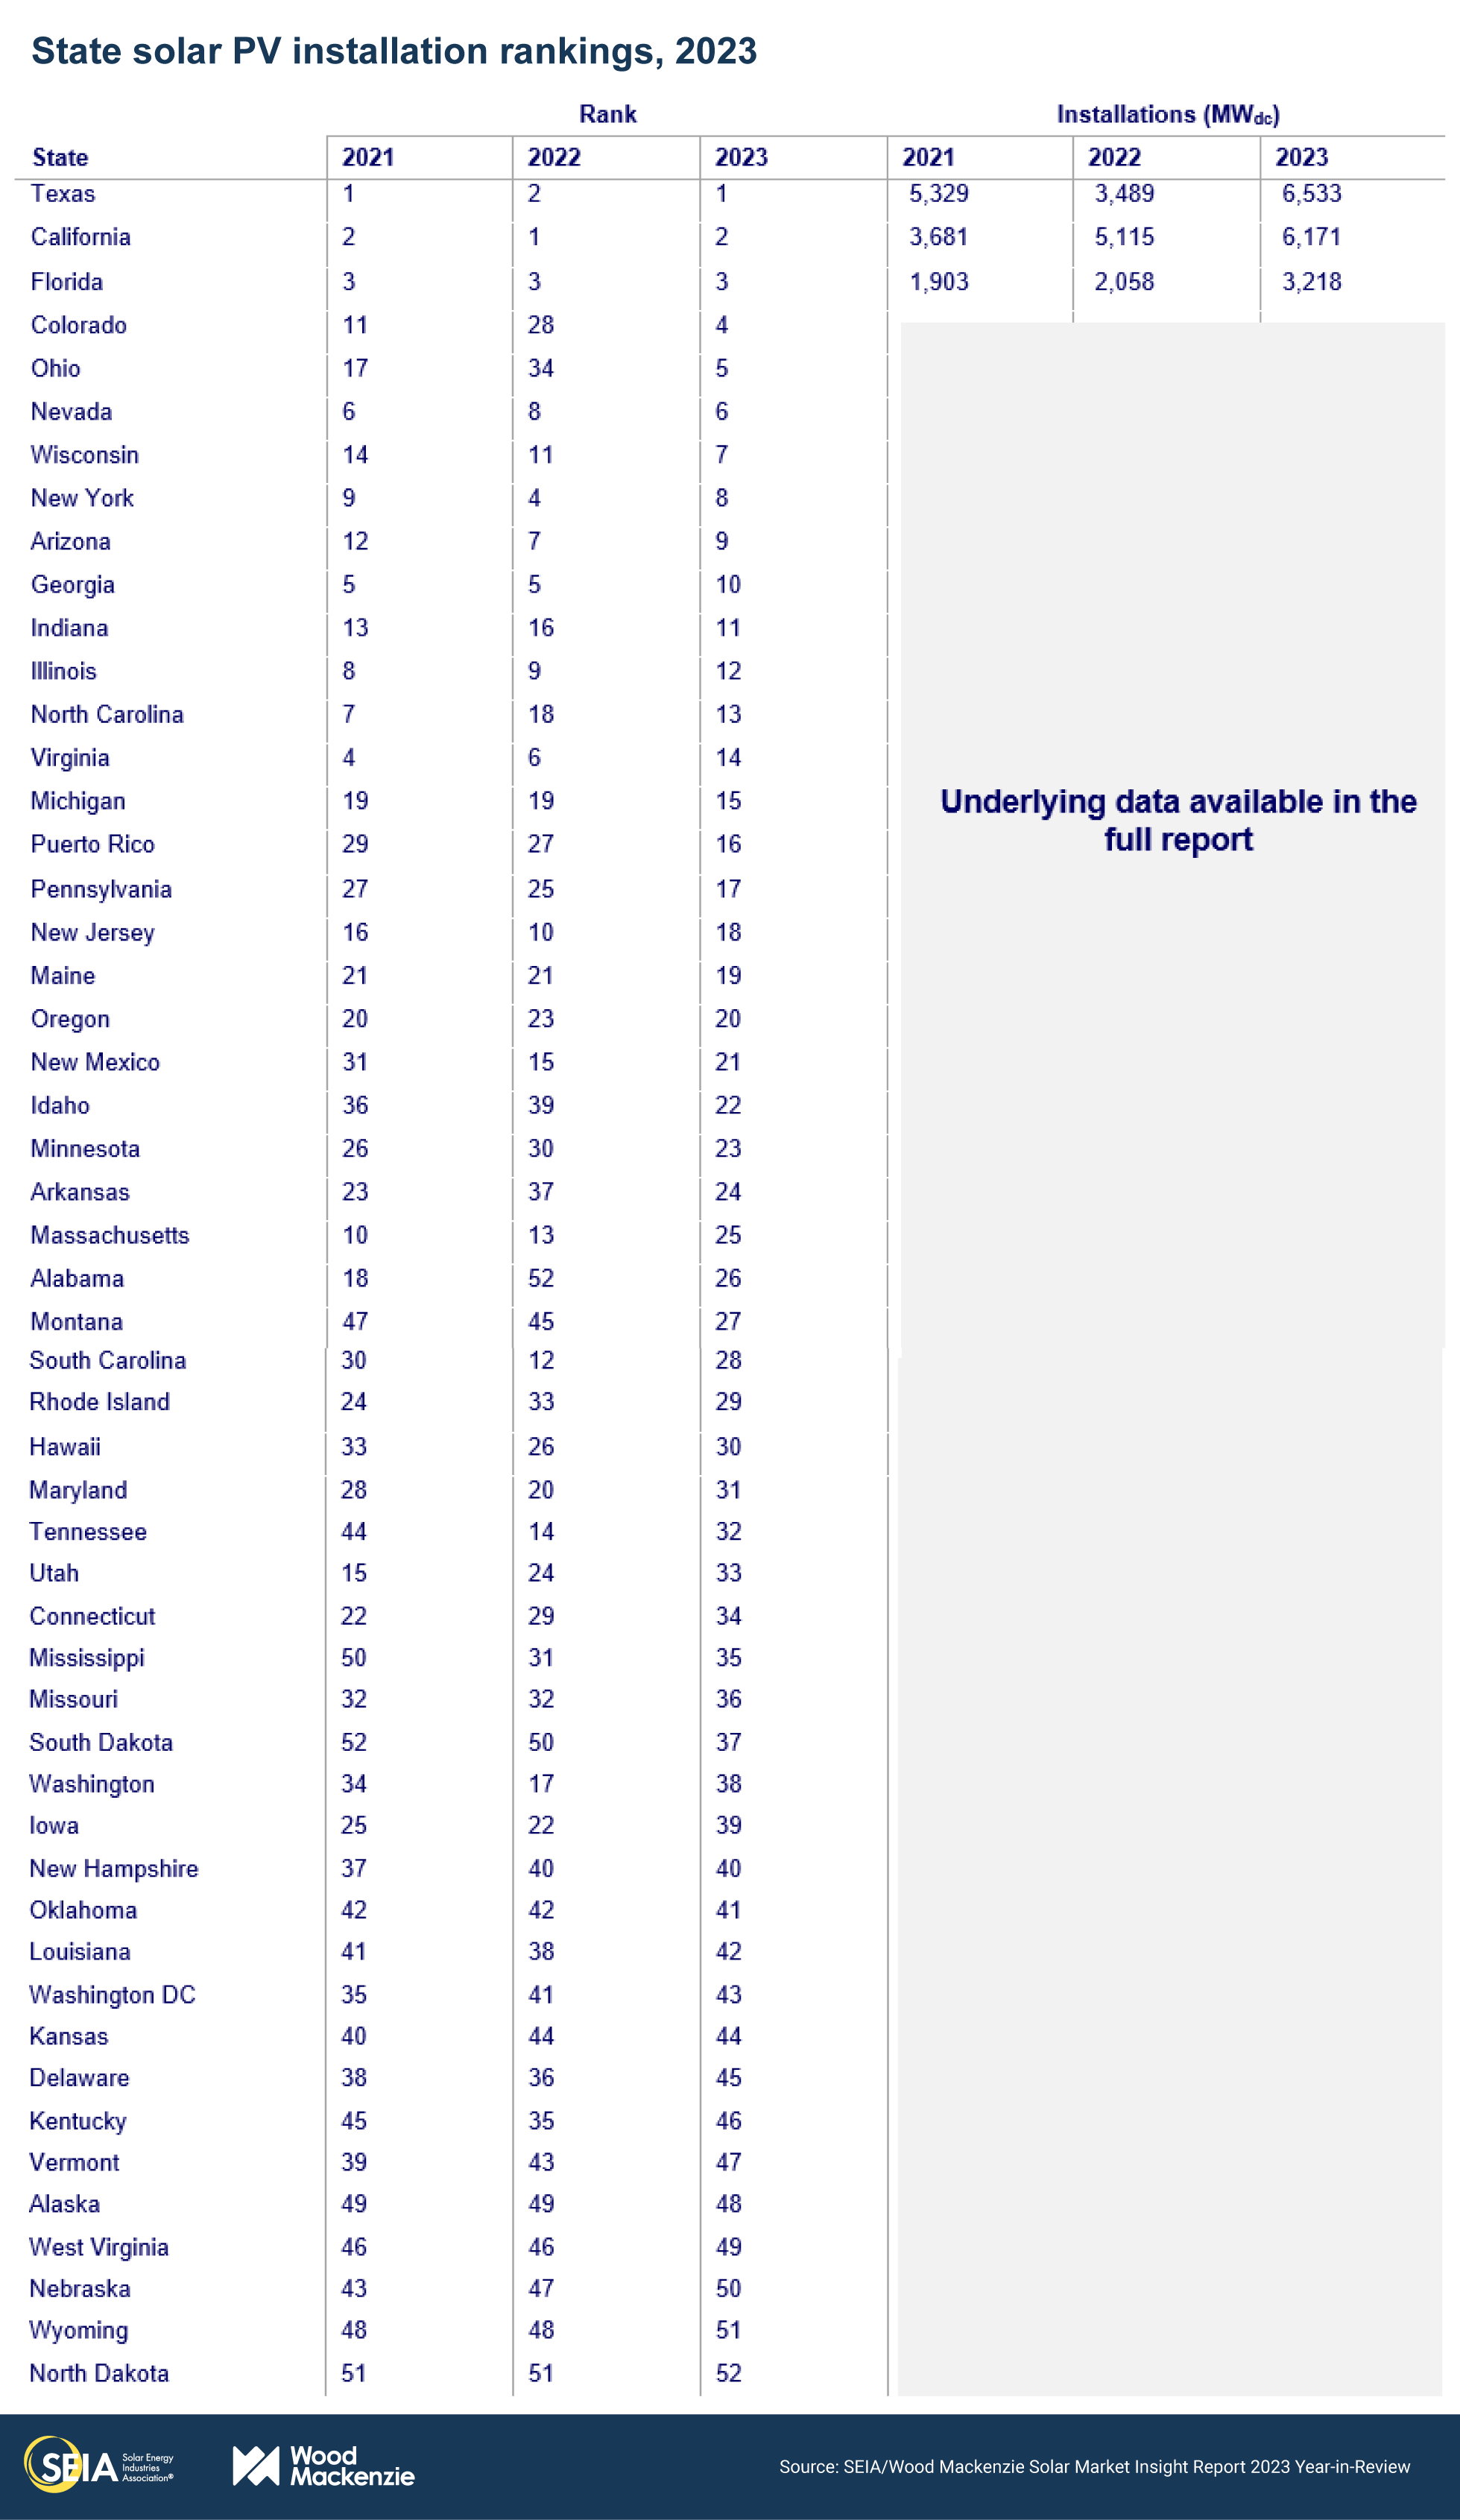
- Texas beat California to claim the top spot for solar capacity installed in 2023. This is only the second time that Texas has outranked California for annual installations, which also happened in 2021. This is being driven by utility-scale installations in Texas, which amounted to nearly 4 GWdc in Q4 2023 alone.
- Our annual Year in Review report includes extended 10-year outlooks for every segment. The total US solar fleet is expected to nearly quadruple from 177 GWdc installed at year-end 2023, to 673 GWdc installed by 2034. By 2040, solar is expected to make up the largest share of electric generating capacity in the US.
- In this report, we have also included our alternative scenarios (a Bull case and a Bear case). The US solar industry currently faces several uncertainties, including policy outcomes of the upcoming presidential election. Our Bull case considers a future with fewer supply chain constraints, more projects qualifying for tax credit adders, favorable financing conditions, and faster interconnection queue reform, amongst several other factors. This is expected to result in 85 additional GWdc installed through 2034, 17% more than in our Base case. Our Bear case generally considers the opposite conditions, which would reduce our outlook by 24% through 2034, amounting to nearly 120 GWdc less solar capacity. More details and data can be found in the full report.
2. Introduction
The US solar industry installed 32.4 gigawatts-direct current (GWdc) of capacity in 2023, a remarkable 51% increase over 2022. This was the industry’s biggest year by far, exceeding 30 GWdc of capacity for the first time. Every single segment set annual installation records except for community solar, which was within 5 MWdc of an annual record.
Growth in 2023 was due to slightly different factors for each segment. Residential solar grew 12%, adding 6.8 GWdc of capacity as installations surged in California as customers rushed to take advantage of more favorable net metering rules before the switch to net billing in April. This helped to offset declines in other states mostly due to interest rate increases. Commercial solar saw a similar increase in California, leading to national growth of 19% over 2022. Community solar grew just 3% compared to 2022. While this segment continues to struggle with interconnection delays and permitting challenges, strong pipelines in states like Illinois, New Jersey, and New York helped contribute to year-over-year growth. Finally, utility-scale installations spiked to 22.5 GWdc of capacity, a 77% increase over 2022. Module import volumes increased over the course of the year as importers worked with Customs and Border Protection (CBP) to demonstrate compliance with the Uyghur Forced Labor Prevention Act (UFLPA). The temporary moratorium on new anticircumvention tariffs applicable to certain imports from four Southeast Asian countries also brought some stability to the solar supply chain. That moratorium ends in June 2024.
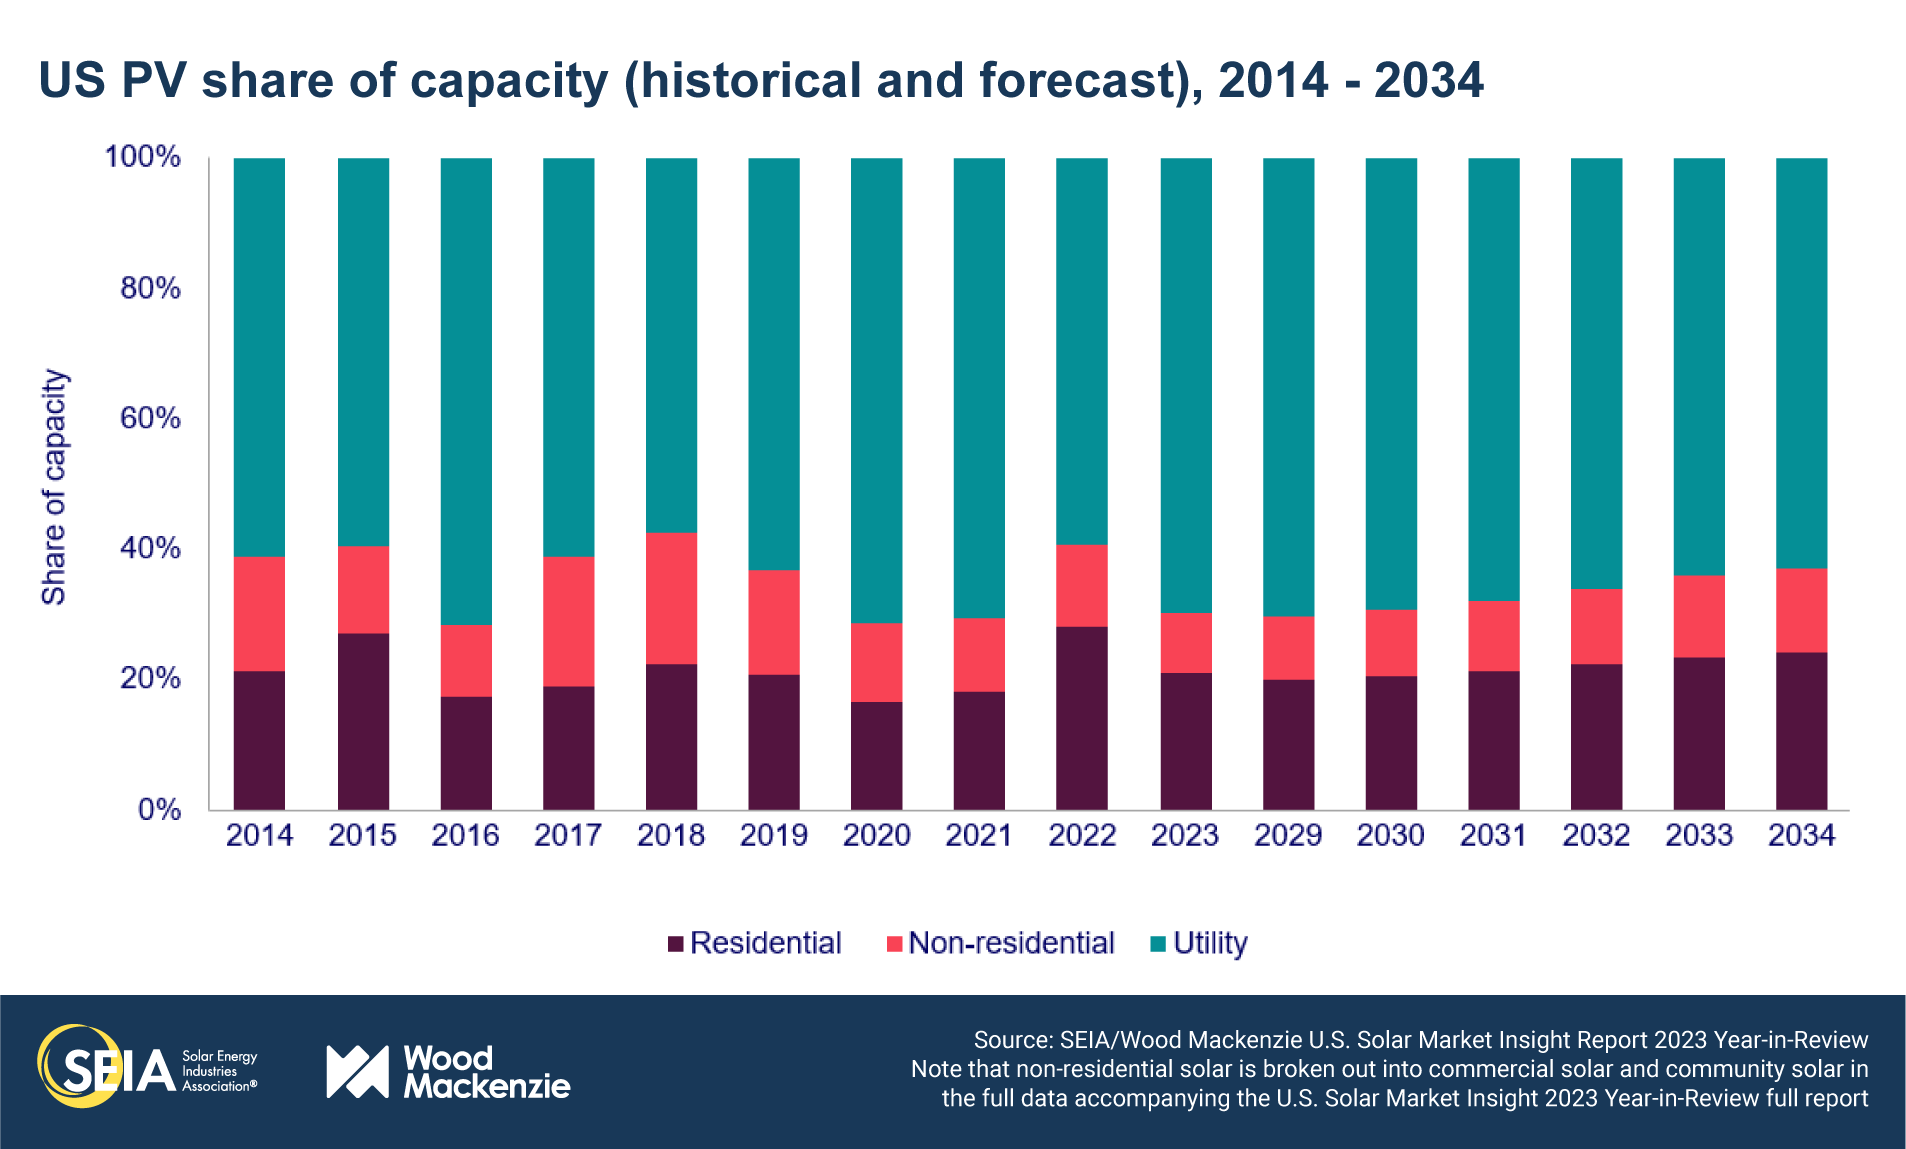
Overall, photovoltaic (PV) solar accounted for 53% of all new electricity-generating capacity additions in 2023, making up more than half of new generating capacity for the first time.
Record-breaking 2023 to give way to strong growth in 2024
2023 was a year of recovery for the US solar industry. After installation volumes shrank 9% in 2022 due to various trade actions impacting solar imports, supply chain stability helped the industry get back to business in 2023. We expect this momentum to continue into 2024, albeit at a lower growth rate since 2023 installations were record-shattering due to delayed 2022 projects coming to fruition in 2023.
Our growth-rate expectations for the commercial, community, and utility-scale segments are 19%, 15%, and 26% for 2024, respectively. There are healthy pipelines of late-stage and under construction projects in each of these segments that will translate to installation growth.
Residential solar, however, is expected to decline by 13% in 2024. The impacts of California’s shift to net billing will manifest in lower installation volumes in 2024, as we’ve predicted since late 2022. While installers report there are still NEM 2.0 projects in their backlogs, installation declines began in the fourth quarter – volumes were down 17% year-over-year and 35% quarter-over-quarter in the state. Additionally, the negative impacts of higher interest rates are expected to continue this year, lowering both sales and installations in other states.
Looking at all the segments combined, we’re expecting roughly 5 GWdc more to be installed in 2024 compared to 2023, for a total of nearly 38 GWdc.
A Bull case with increased supply chain stability, more tax credit financing, and lower interest rates would increase the outlook by 17%
For this year’s alternative scenarios, our analysts considered several economic and policy factors that could impact the future of the US solar market. There are always numerous uncertainties to navigate in the solar industry, particularly in a presidential election year.
Our Bull case envisions a future with fewer supply chain constraints on solar equipment. In this scenario, we assume CBP allows increasingly more shipments of modules made with non-Xinjiang Chinese polysilicon to enter the country. Sources of supply that aren’t subject to anticircumvention tariffs, such as wafer manufacturing facilities in Southeast Asia, continue to increase. This could impact domestic manufacturing – manufacturing capacity, particularly for modules, will continue to increase but will be challenged by the oversupply environment. Overall, increased supply will help prevent project delays.
When it comes to the Inflation Reduction Act (IRA), our Bull case assumes that qualifying for and financing tax credits is simple and straightforward. We assume an accelerated expansion of tax credit financing availability – more corporations become tax equity providers and the tax credit transferability market grows rapidly, facilitating more transactions. The tax credit levels for the production tax credit and investment tax credit remain the same, but clear and straightforward guidance from Treasury helps more projects qualify for tax credit adders.
We also assume a more optimistic picture for transmission capacity buildout and interconnection reform. In the Bull scenario, transmission projects are fast-tracked, and grid operators implement effective interconnection reforms quickly. This helps speed the approval and installation of solar projects.
Finally, our Bull case assumes that interest rates decline and then stabilize faster than in our Base case. We assume the Federal Reserve cuts rates several times this year and next, with rates stabilizing at 3% by the end of 2026. This helps reduce the cost of capital, bringing down solar project costs.
Our Bull case results in a 17% increase in total solar installations through 2034 relative to the Base case, translating to an additional 86 GWdc of capacity. On an annual basis, the increase is smaller in the near-term, averaging 13% over the next five years. Near-term installations are less sensitive to our assumptions given typical project timelines, particularly for utility-scale solar. But this annual increase grows to roughly 30% by the end of the outlook.
A Bear case with supply chain constraints, less tax credit financing, and static interest rates would decrease the outlook by 24%
Our Bear case flips many of the Bull case assumptions in the opposite direction. Firstly, the Bear case envisions an increase in trade actions and other measures that limit supply of solar equipment. This constrains supply to the extent that utility-scale solar (which is more reliant on imported modules than the distributed segments) is limited in the near-term before more domestic manufacturing comes online. But after a few years, supply constraints are mitigated by an acceleration of domestic manufacturing buildout, particularly for cells and wafers.
The Bear case assumes the environment for tax credit qualification and financing is uncertain and limited. We assume tax credit financing availability doesn’t keep up with demand. The transferability market faces unforeseen challenges, minimizing availability of financing through tax credit transfers. Guidance issued by the Treasury is released at a slow pace and doesn’t address current uncertainties related to credit qualification. It remains challenging to qualify for the domestic content adder.
In our Bear case, transmission projects are even more burdened by development hurdles than they are today. Large projects are delayed or cancelled outright. Interconnection reforms don’t address queue backlogs, further delaying project development.
Lastly, the Bear case assumes that interest rates stay static at their current levels through the outlook. This keeps the cost of capital higher, and thus project economics do not improve at the same rates as they would in the Base case or the Bull case.
The Bear case results in a 24% decrease in total solar installations through 2034 compared to the Base case, a reduction of 120 GWdc. Similar to the Bull case, the annual decreases are smaller in the near term, but result in more than 40% lower capacity in some of the latter years of the outlook.
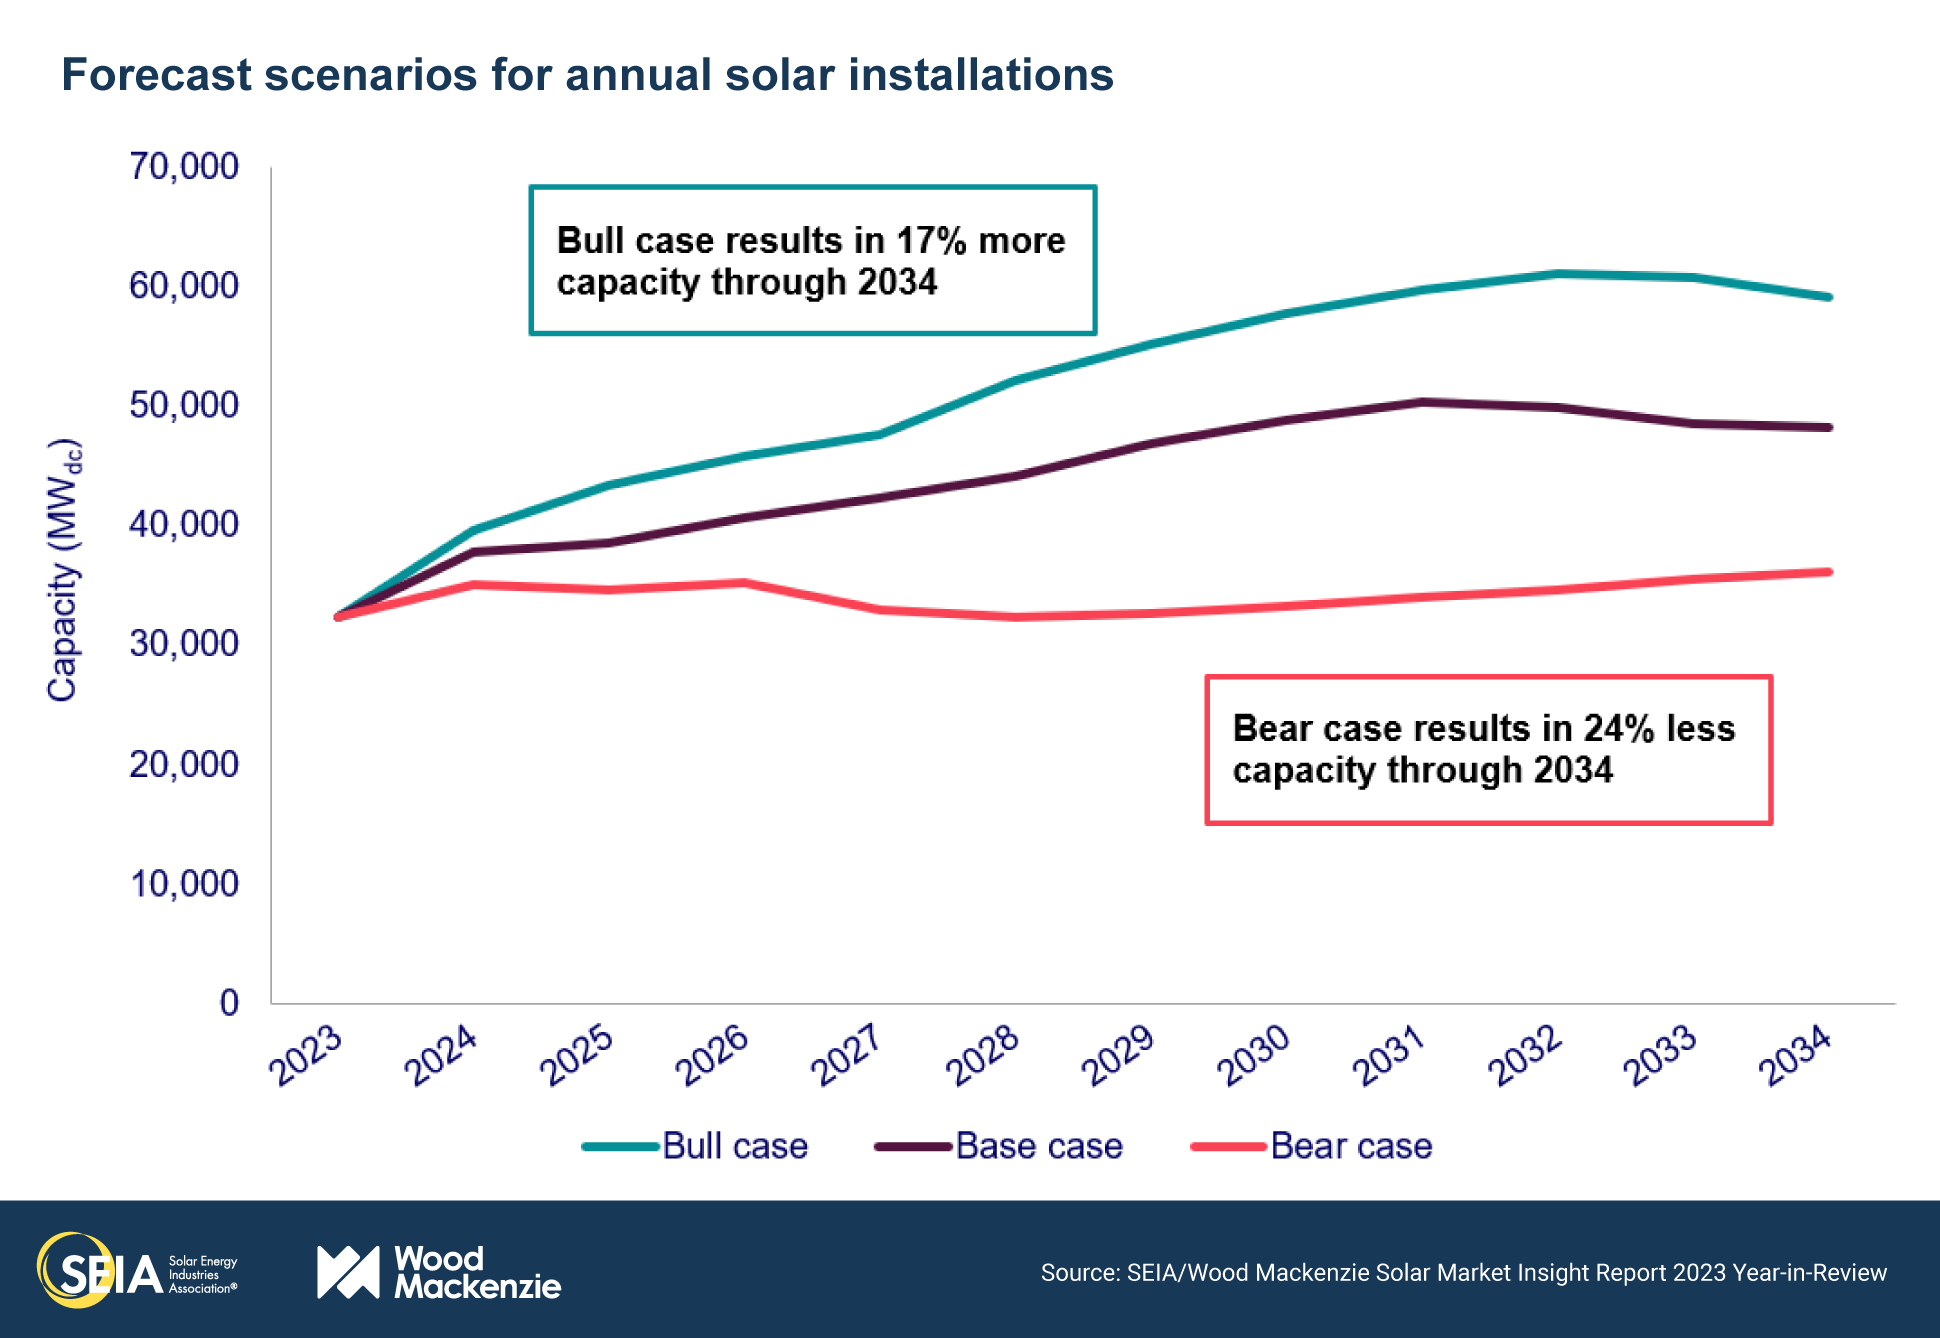
Overall, our alternative scenarios highlight that there could be a 200 GWdc swing in solar installations over the next decade based on various political and economic outcomes. We’ve highlighted the most notable assumptions here, but there are several other factors incorporated into our alternative scenarios that contribute to our results. More details on the assumptions for each segment can be found within the full report.
Solar deployments to quadruple by 2034
In our Base case outlook, total solar deployment is set to grow to more than 670 GWdc by 2034, nearly quadrupling from today’s level. While we expect about 38 GWdc of capacity installations in 2024, typical volumes will be in the 48-50 GWdc range from 2030 onward. This is a reduction from our expectations in our last Year in Review report. While solar has an incredibly strong outlook, interconnection challenges are the main driver of lower expectations in the latter half of our outlook.
While this industry is larger than it has ever been, annual growth over the next 10 years will average 4% compared to 25% for the prior decade. The challenges that currently limit growth in this industry–particularly transmission and interconnection limitations–will only become more heightened over time. Addressing these limitations is key to meeting both decarbonization goals and growing power demand.

3. Market segment outlooks
3.1. Residential PV
- 6.8 GWdc installed in 2023, 1,533 MWdc in Q4 2023
- Up 13% from 2022
The residential solar market hit another record in 2023 but is set to decline in 2024
2023 was a tumultuous year for the residential solar industry, but it resulted in the segment’s fifth consecutive year of record installed capacity. Installation backlogs from a robust year of sales in 2022 supported growth at the beginning of 2023. However, high interest rates hampered sales throughout 2023, impacting installation volumes more significantly as the year progressed. Although California installations increased through the first three quarters of 2023, the state saw a 35% quarterly drop in capacity in Q4 as installers depleted backlogs of sales made under NEM 2.0. Nationally, the residential segment installed 1,533 MWdc in Q4 to reach 6.8 GWdc of annual installed capacity, a 13% increase from 2022. But Q4 was the lowest quarter of capacity volume since Q2 2022.
Installers continued to face challenging market conditions through the fourth quarter of 2023, with many experiencing a more distinct seasonal dip in sales than in recent years. Although many installers report that pricing and financing terms remained steady, several other factors continued to strain their cash flow, such as delayed milestone payments and permitting and interconnection delays in some areas of the country. Thirty-one states and Puerto Rico saw year-over-year growth in 2023, but many installers experienced sales declines throughout the year. Some installers reported 30-50% declines in sales year-over-year in some markets in the fourth quarter, which will result in lower installation volumes in the next few quarters.
Wood Mackenzie still forecasts a 13% contraction for the residential solar market in 2024, as installation volumes reflect the impacts of high interest rates and California’s net billing transition. We expect a 40% reduction in California’s installed capacity in 2024, leading to a nationwide contraction of the residential solar market. For all states other than California, we expect flat growth in 2024 as some state markets contract but rising retail rates fuel growth in others. As interest rates decline and more third-party owned projects qualify for the ITC adders, the segment will recover in 2025 with 13% growth and grow steadily from 2026 through 2028. Over the next decade, the segment will add more than 100 GWdc of installed capacity and grow at an average annual rate of 5% between 2024 – 2034 in our Base case outlook.
3.2. Commercial PV
- 1,851 MWdc installed in 2023, 638 MWdc in Q4 2023
- Up 19% from 2022
Note on market segmentation: Commercial solar encompasses distributed solar projects with commercial, industrial, agricultural, school, government, or nonprofit offtakers, including remotely net-metered projects. This excludes community solar (covered in the following section).
California’s NEM 2.0 installed capacity drives record quarter and year for commercial solar
Commercial solar had a record-breaking year with 1.9 GWdc of new capacity installed in 2023, a 19% increase compared to 2022. California accounted for 35% of the national installed capacity in 2023, with installations growing 34% year-over-year. Additionally, the continued easing of supply chain constraints and lower system costs supported development throughout the year.
The commercial segment grew by 71% quarter-over-quarter in Q4 2023, driven mainly by a surge of NEM 2.0 installations in California. There were 302 MWdc of installed capacity added in California during Q4 2023, making up half the total quarterly volume. Commercial solar growth has typically come from a few key markets, such as California, New Jersey, New York, Illinois, and Massachusetts. However, both large and small markets contributed to the segment’s growth last year. In 2023, installation volumes in 19 states grew by over 50% year-over-year. Non-traditional states like Georgia and Texas have become particularly attractive for many developers due to low development costs, low building penetration, and ample land.
We expect 19% growth in 2024 as California’s NEM 2.0 projects continue to come online through the end of this year. Installations will dip in 2025 due to an expected drop in California’s installations, increased market penetration in certain mature markets, and prevailing wage and apprenticeship requirements. Commercial solar projects over 1 MWac that began construction before January 29, 2023 (after which prevailing wage and apprenticeship rules apply), will have mostly been built by 2025. Since new projects larger than 1 MWac must meet these requirements to qualify for the full ITC and PTC amounts, developers likely would have begun construction on a significant portion of their active pipeline before the deadline. Both industry and the federal government’s Departments of the Treasury and Labor continue to work towards final rules, which are expected in late 2024. These dynamics may result in slightly reduced annual installations from 2025 through 2027. In the longer term, growth will gradually increase due to more projects qualifying for the ITC adders and higher retail rates. Overall, we expect 7% average annual growth over the next five years.
3.3. Community solar PV
- 1,148 MWdc installed in 2023, 315 MWdc installed in Q4 2023
- Up 3% from 2022
Note on market segmentation: Community solar projects are part of formal programs where multiple residential and non-residential customers can subscribe to the power produced by a local solar project and receive credits on their utility bills.
Annual community solar capacity additions break 1 GWdc for a third consecutive year
Community solar installations increased by 3% year-over-year in 2023, resulting in 1,148 MWdc of new capacity. Annual installation volumes exceeded our previous expectations by 1.5%, and 2023 marks the third consecutive year national annual capacity exceeded 1 GWdc. Wood Mackenzie currently forecasts 15 community solar state markets, 10 of which experienced year-over-year growth. Maryland and New Jersey had particularly strong years, with capacity additions increasing by 169% and 608% compared to 2022, respectively. Installation volumes in New York decreased slightly in 2023 compared to 2022, but annual additions in the state still comprised 45% of total national installations.
Despite year-over-year growth, obstacles persist in mature state markets. Installed capacity in Massachusetts, for example, declined 72% from 2022 as developers continue to wait on siting, permitting, and interconnection reform. Interconnection delays are also impacting newer state markets. Developers anticipated having projects online in Virginia and Delaware by the end of 2023; however, only a single project in Virginia reached completion. Despite these interconnection delays, development pipelines in newer state markets remain very strong, supporting our expectation for 15% annual growth nationally in 2024.
Overall, we expect the national community solar market to grow by 7% annually on average through 2028. Large development pipelines in both new and mature state markets bolster near-term growth. Longer-term, Solar for All funding and the availability of the ITC adders will support lasting growth. We also continue to closely monitor implementation of community solar legislation in California, the result of which will be a significant factor in future changes to our national forecast. Additionally, the establishment of new state markets provides room for upside in our five-year outlook. Pre-development pipelines in Ohio, Wisconsin, Michigan, and Pennsylvania exceed 1 GWdc, and there is interest in introducing or expanding community solar legislation in several additional states.
3.4. Utility PV
- 22.5 GWdc installed in 2023, record-high of 10.5 GWdc installed in Q4 2023
- More than 343 GWdc of utility-scale solar will be added over the next 10 years in our Base case
Utility-scale segment rebounds in 2023
The utility-scale solar segment rebounded in 2023 from the downturn observed in 2022. The sector grew by 77% in installed capacity compared to 2022, with a total of 22.5 GWdc interconnected last year. This growth was acute in Q4 2023, which was a record quarter for the segment by over 4 GWdc. This growth can be largely attributed to module supply chain stabilization within the past year and the subsequent buildout of delayed projects.
Although supply chain stabilization allowed the sector to regain momentum in project installations, high interest rates, tighter financing conditions, and interconnection uncertainty slowed contract negotiations. This resulted in a 64% decrease in contracted capacity in 2023 compared to 2022. Only 693 MWdc of projects were contracted in Q4 2023, a record-low quarter that has resulted in the project pipeline dipping below the 90 GWdc threshold at 83 GWdc. This decline is mainly driven by the opposing dynamics of contracting new projects and building projects in the current pipeline. Many developers are focusing on materializing current pipeline with existing module stock before the end of the two-year tariff moratorium in June 2024.
In our Base case outlook, Wood Mackenzie forecasts that the utility-scale segment will add 148 GWdc of installed capacity between 2024 and 2028 and 343 GWdc over the next decade. Interest in the segment will remain strong throughout the forecast period as utility procurements, corporate clean energy goals, and state mandated targets continue to drive growth. The different buildout levels presented in the alternative scenarios in the full report are mainly driven by tax credit adders, tax equity availability, labor availability, supply chain dynamics, and interconnection reforms.
4. US solar PV forecasts
5. National solar PV system pricing
- Residential system pricing is down 2% year-over-year
- Commercial system pricing is down 6% year-over-year
- Utility-scale system pricing is up 9% for fixed-tilt and 11% for single-axis tracking year-over-year
Note: In November 2023, Wood Mackenzie published a refreshed customer acquisition cost analysis (US distributed solar customer acquisition cost outlook 2023). Therefore, there are changes to the modeled residential customer acquisition costs and overall national average turnkey pricing in this report compared to past quarters.
Wood Mackenzie employs a bottom-up modeling methodology to capture, track and report national average PV system pricing by segment for systems installed each quarter. The methodology is based on the tracked wholesale pricing of major solar components and data collected from industry interviews. Wood Mackenzie’s Supply Chain data and models are leveraged to enhance and bolster our pricing outlooks. Wood Mackenzie assumes all product is procured and delivered in the same year as the installation except modules for the utility segment, which are procured one year prior to commercial operation.
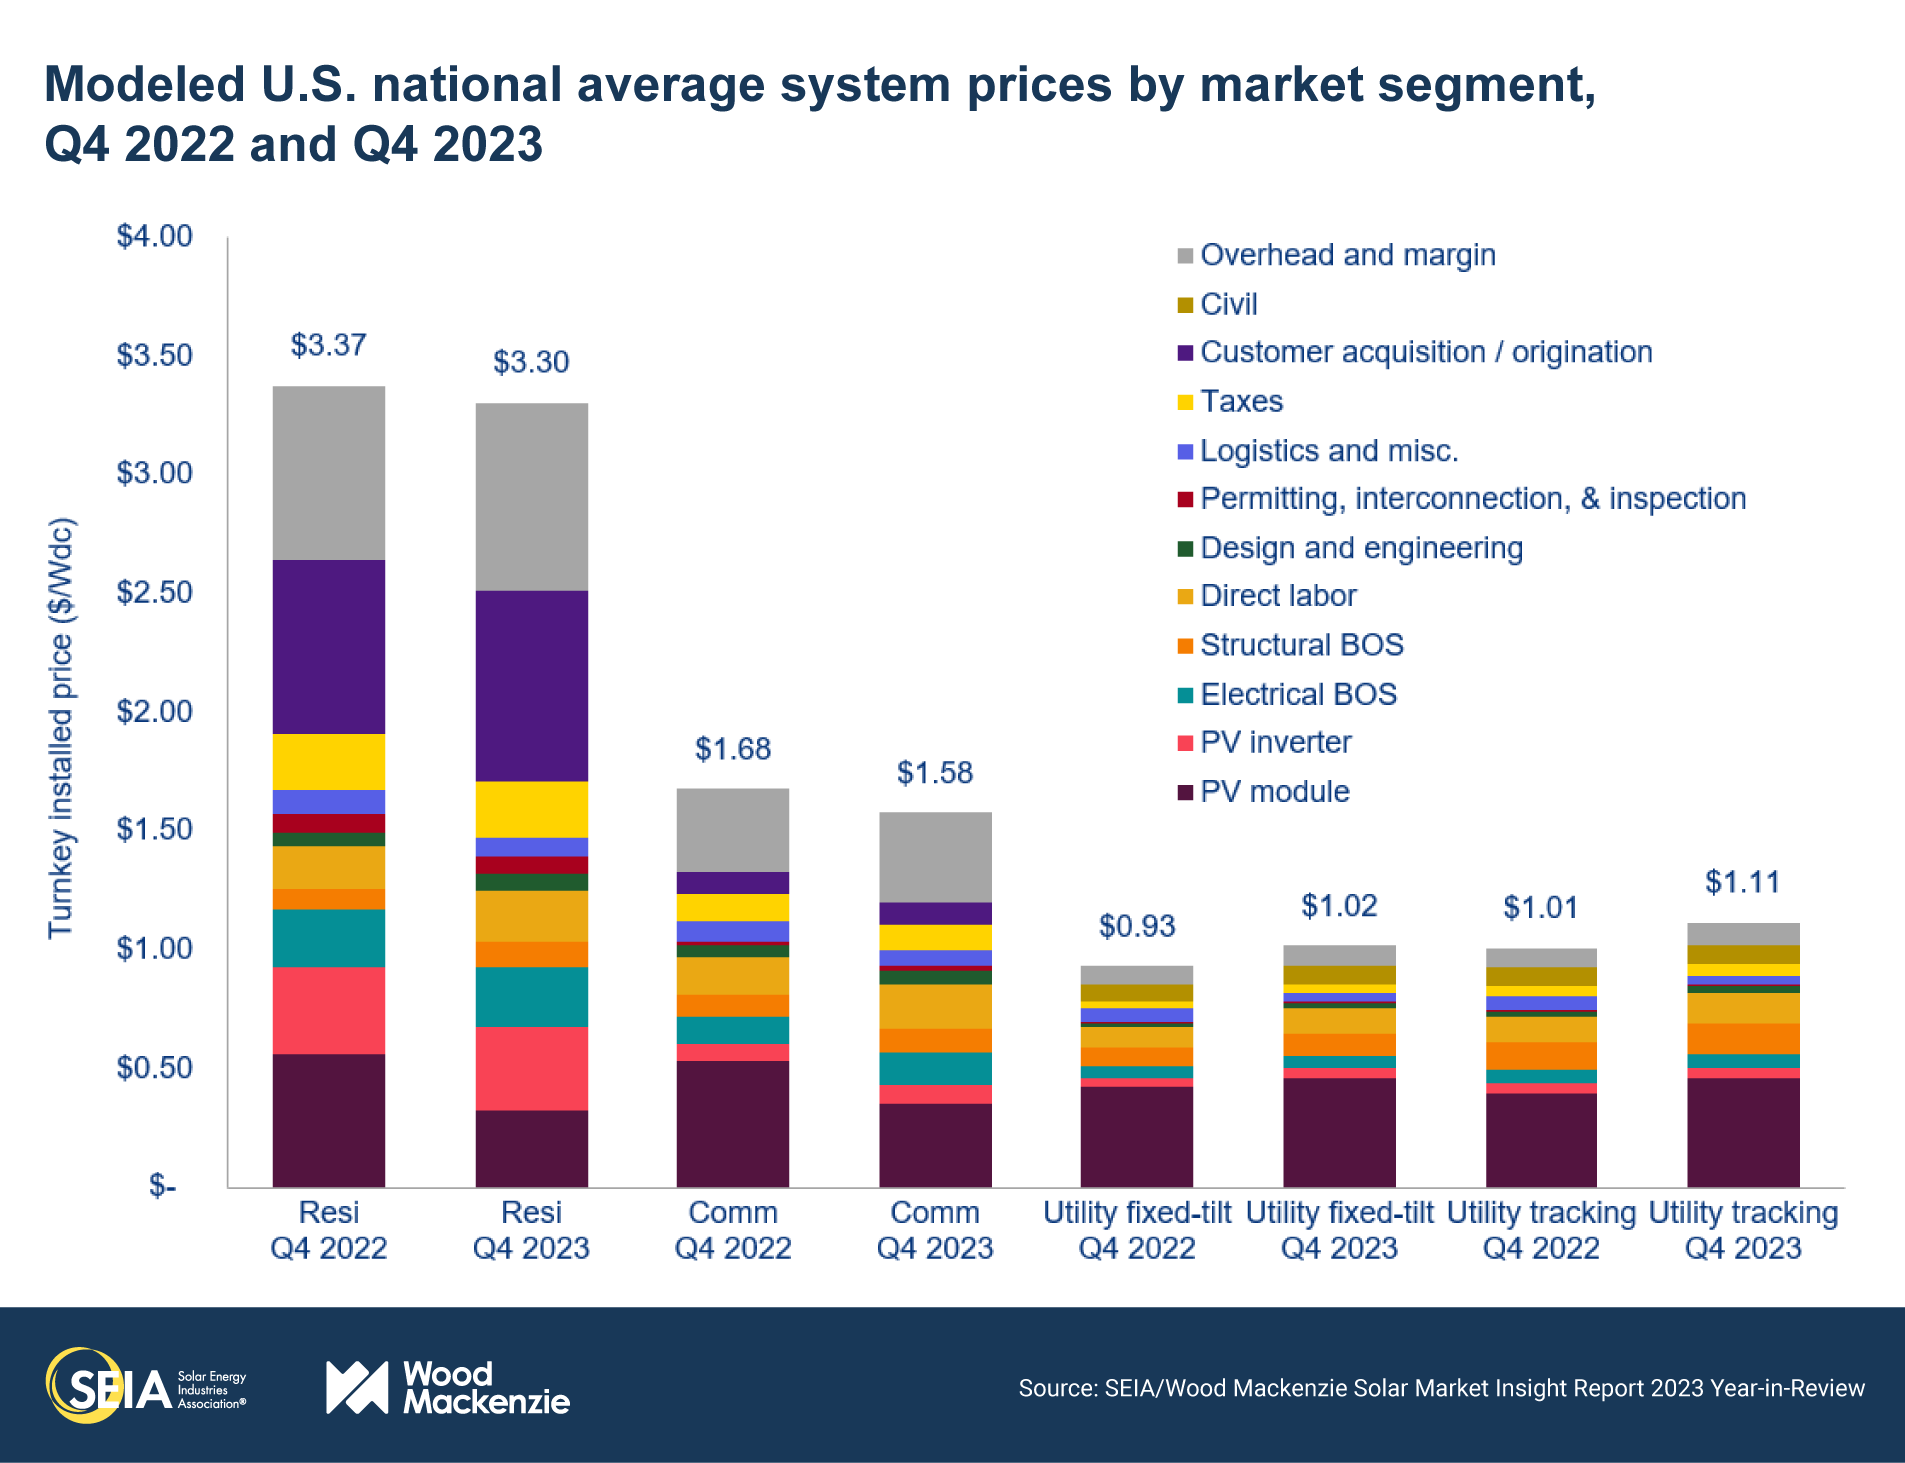
The rapid decline in module prices for the distributed generation segments resulted in both quarterly and annual system cost decreases for the residential and commercial segments. As residential solar demand declined faster than installers anticipated throughout 2023, the segment experienced an oversupply of modules, which then sold at significant discounts towards the end of the year as demand slumped. As a result, average module prices decreased by 43% and 34% year-over-year for the residential and commercial segments, respectively. The average residential PV system price was down by 2% (with module cost declines partially offset by increases in customer acquisition costs), and the commercial PV system price decreased by 6% year-over-year in Q4 2023. By contrast, the one-year lag in module procurement and the rising balance of plant and labor costs resulted in a 10% year-over-year increase in average utility PV system prices.
License
Ownership rights
This report (“Report”) and all Solar Market Insight® (“SMI”)TM reports are jointly owned by Wood Mackenzie and the SEIA® (jointly, “Owners”) and are protected by United States copyright and trademark laws and international copyright/intellectual property laws under applicable treaties and/or conventions. Purchaser of Report or other person obtaining a copy legally (“User”) agrees not to export Report into a country that does not have copyright/intellectual property laws that will protect rights of Owners therein.
Grant of license rights
Owners hereby grant user a non-exclusive, non-refundable, non-transferable Enterprise License, which allows you to (i) distribute the report within your organization across multiple locations to its representatives, employees or agents who are authorized by the organization to view the report in support of the organization’s internal business purposes, and (ii) display the report within your organization’s privately hosted internal intranet in support of your organization’s internal business purposes. Your right to distribute the report under an Enterprise License allows distribution among multiple locations or facilities to Authorized Users within your organization.
Owners retain exclusive and sole ownership of this report. User agrees not to permit any unauthorized use, reproduction, distribution, publication or electronic transmission of any report or the information/forecasts therein without the express written permission of Owners.
Disclaimer of warranty and liability
Owners have used their best efforts in collecting and preparing each report.
Owners, their employees, affiliates, agents, and licensors do not warrant the accuracy, completeness, correctness, non-infringement, merchantability, or fitness for a particular purpose of any reports covered by this agreement. Owners, their employees, affiliates, agents, or licensors shall not be liable to user or any third party for losses or injury caused in whole or part by our negligence or contingencies beyond Owners’ control in compiling, preparing or disseminating any report or for any decision made or action taken by user or any third party in reliance on such information or for any consequential, special, indirect or similar damages, even if Owners were advised of the possibility of the same. User agrees that the liability of Owners, their employees, affiliates, agents and licensors, if any, arising out of any kind of legal claim (whether in contract, tort or otherwise) in connection with its goods/services under this agreement shall not exceed the amount you paid to Owners for use of the report in question.
related content
You May Also Like