
Solar Market Insight Report Q4 2023

The quarterly SEIA/Wood Mackenzie Power & Renewables U.S. Solar Market Insight report shows the major trends in the U.S. solar industry. Learn more about the U.S. Solar Market Insight Report. Released December 7, 2023.
1. Key figures
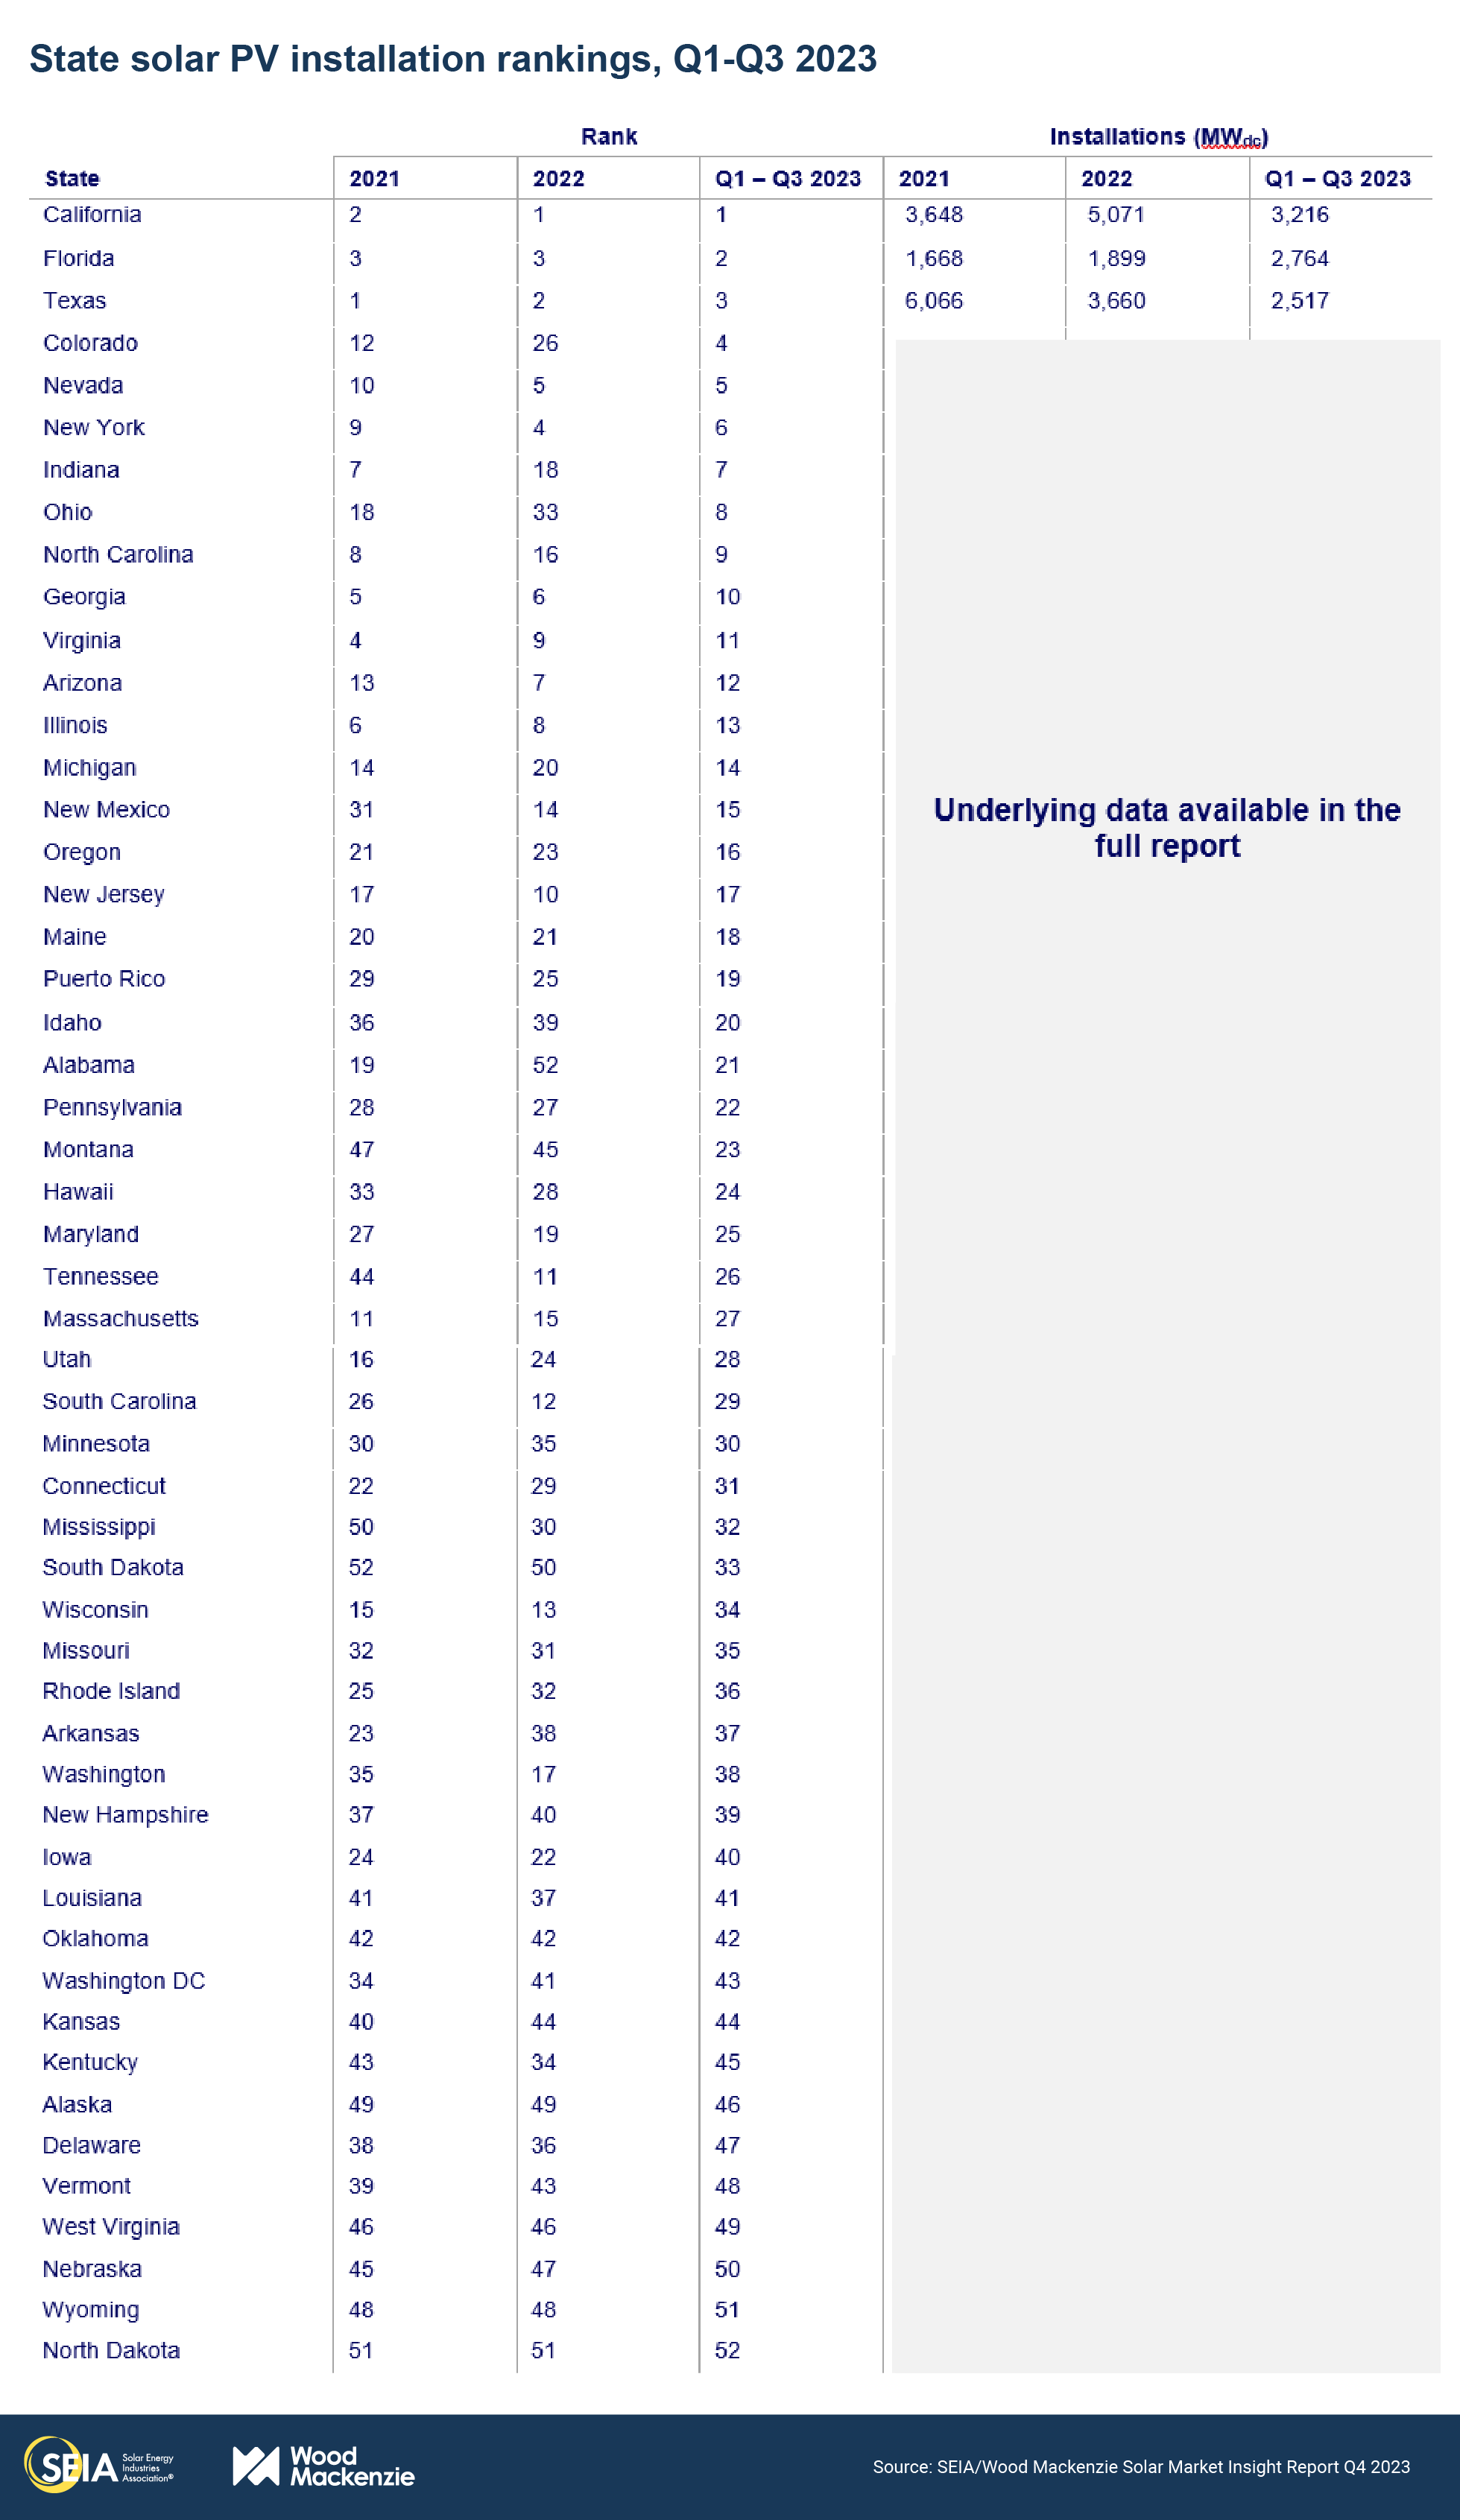
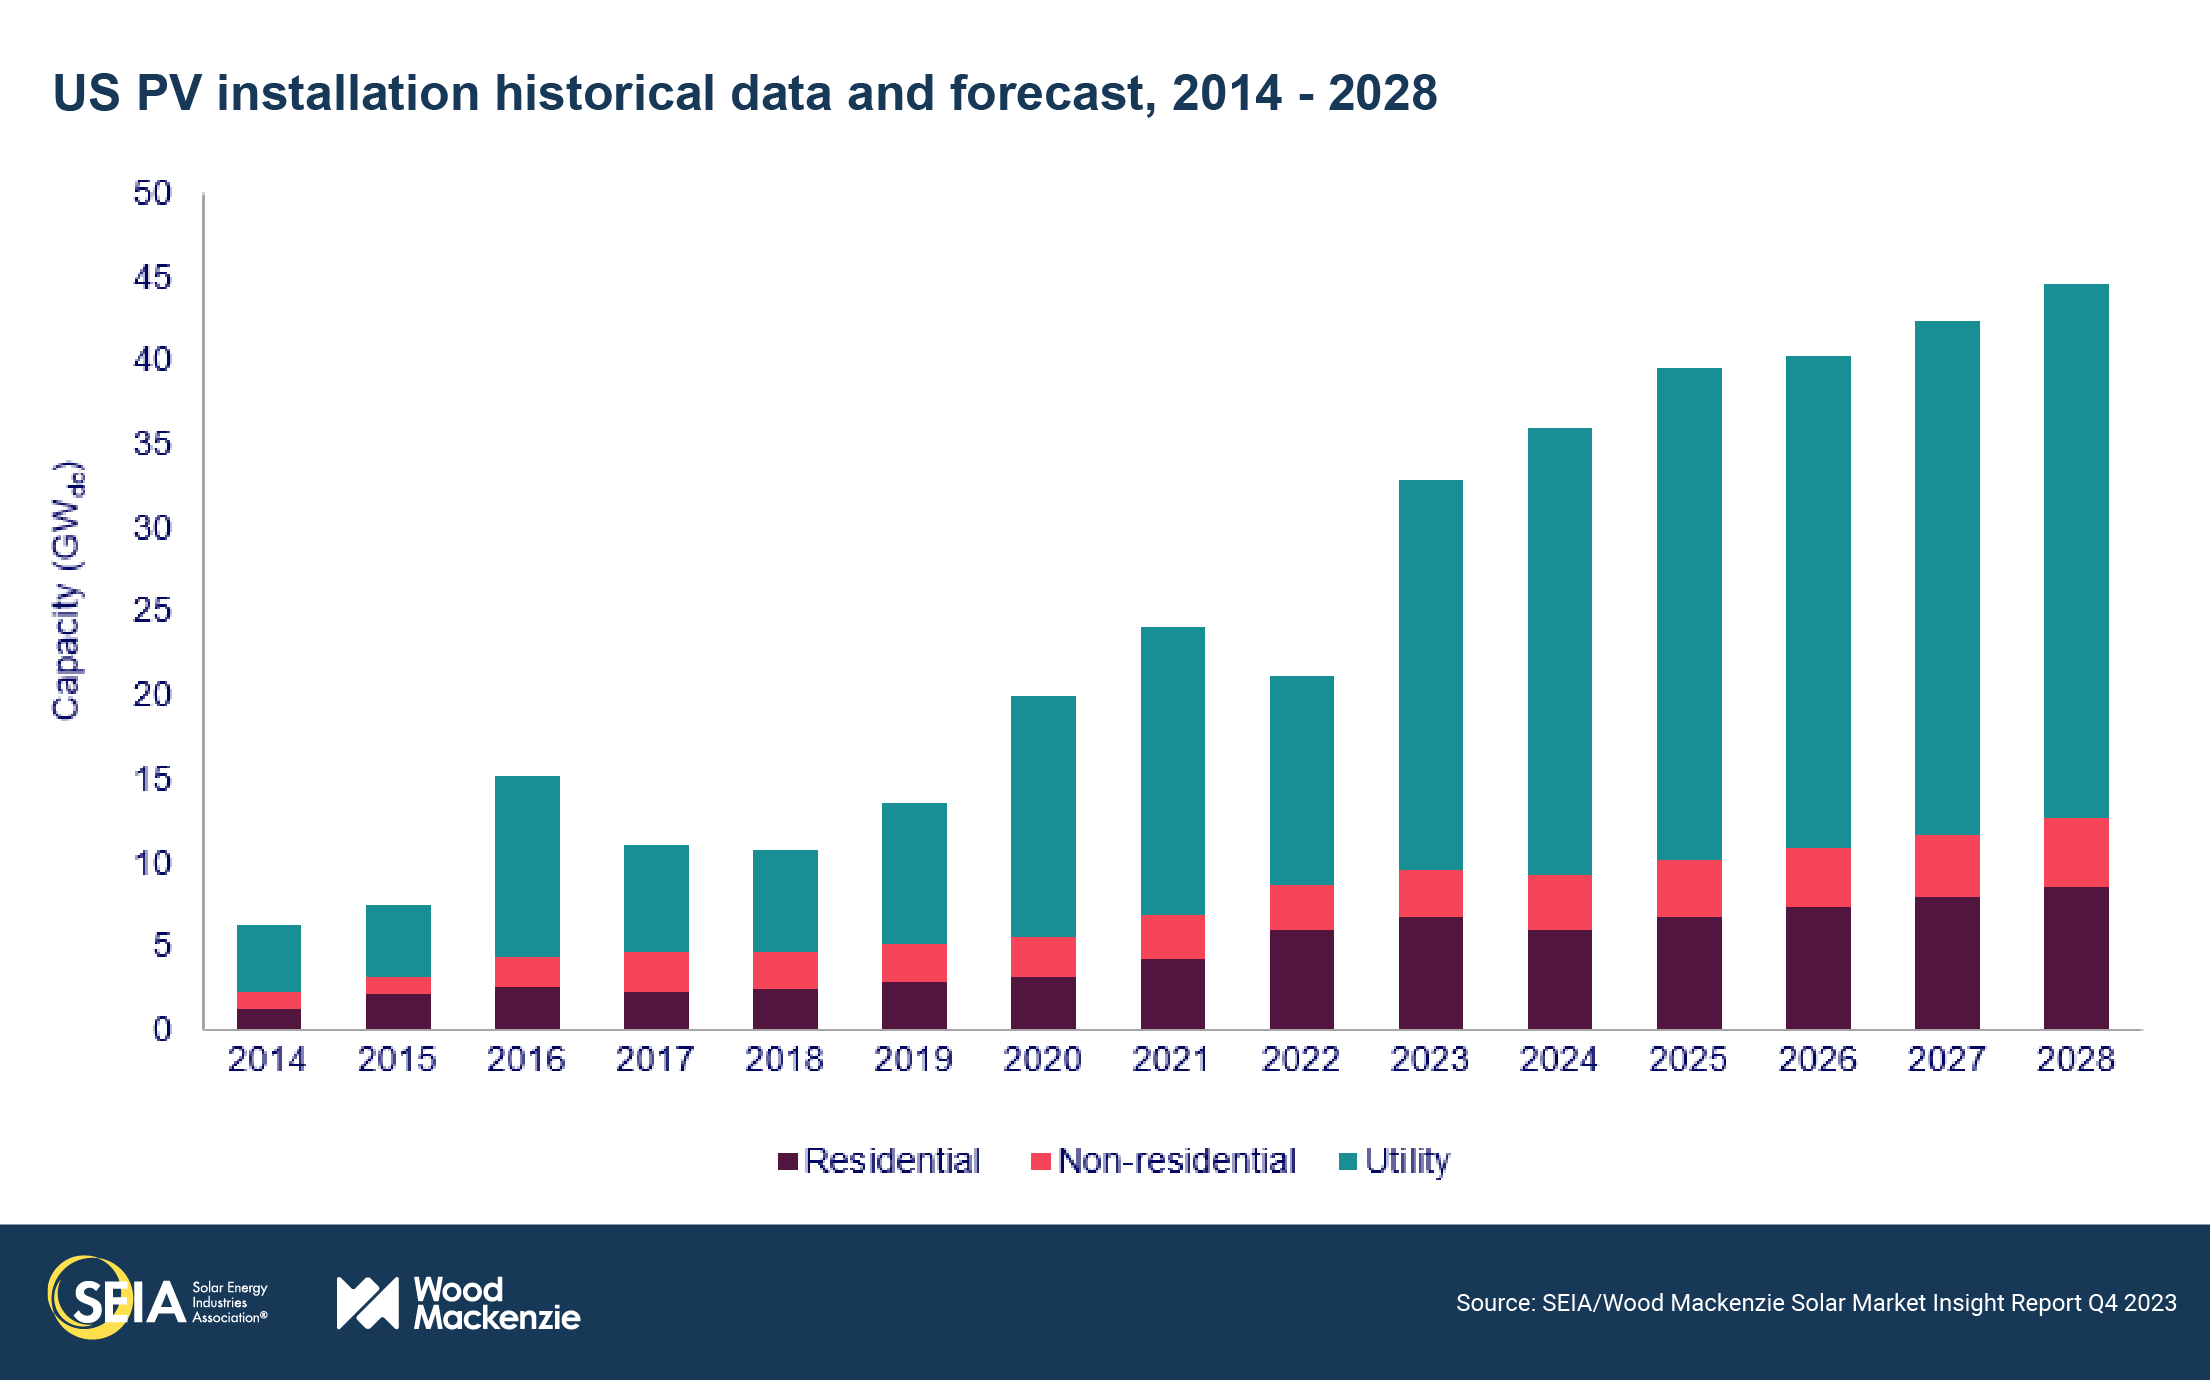
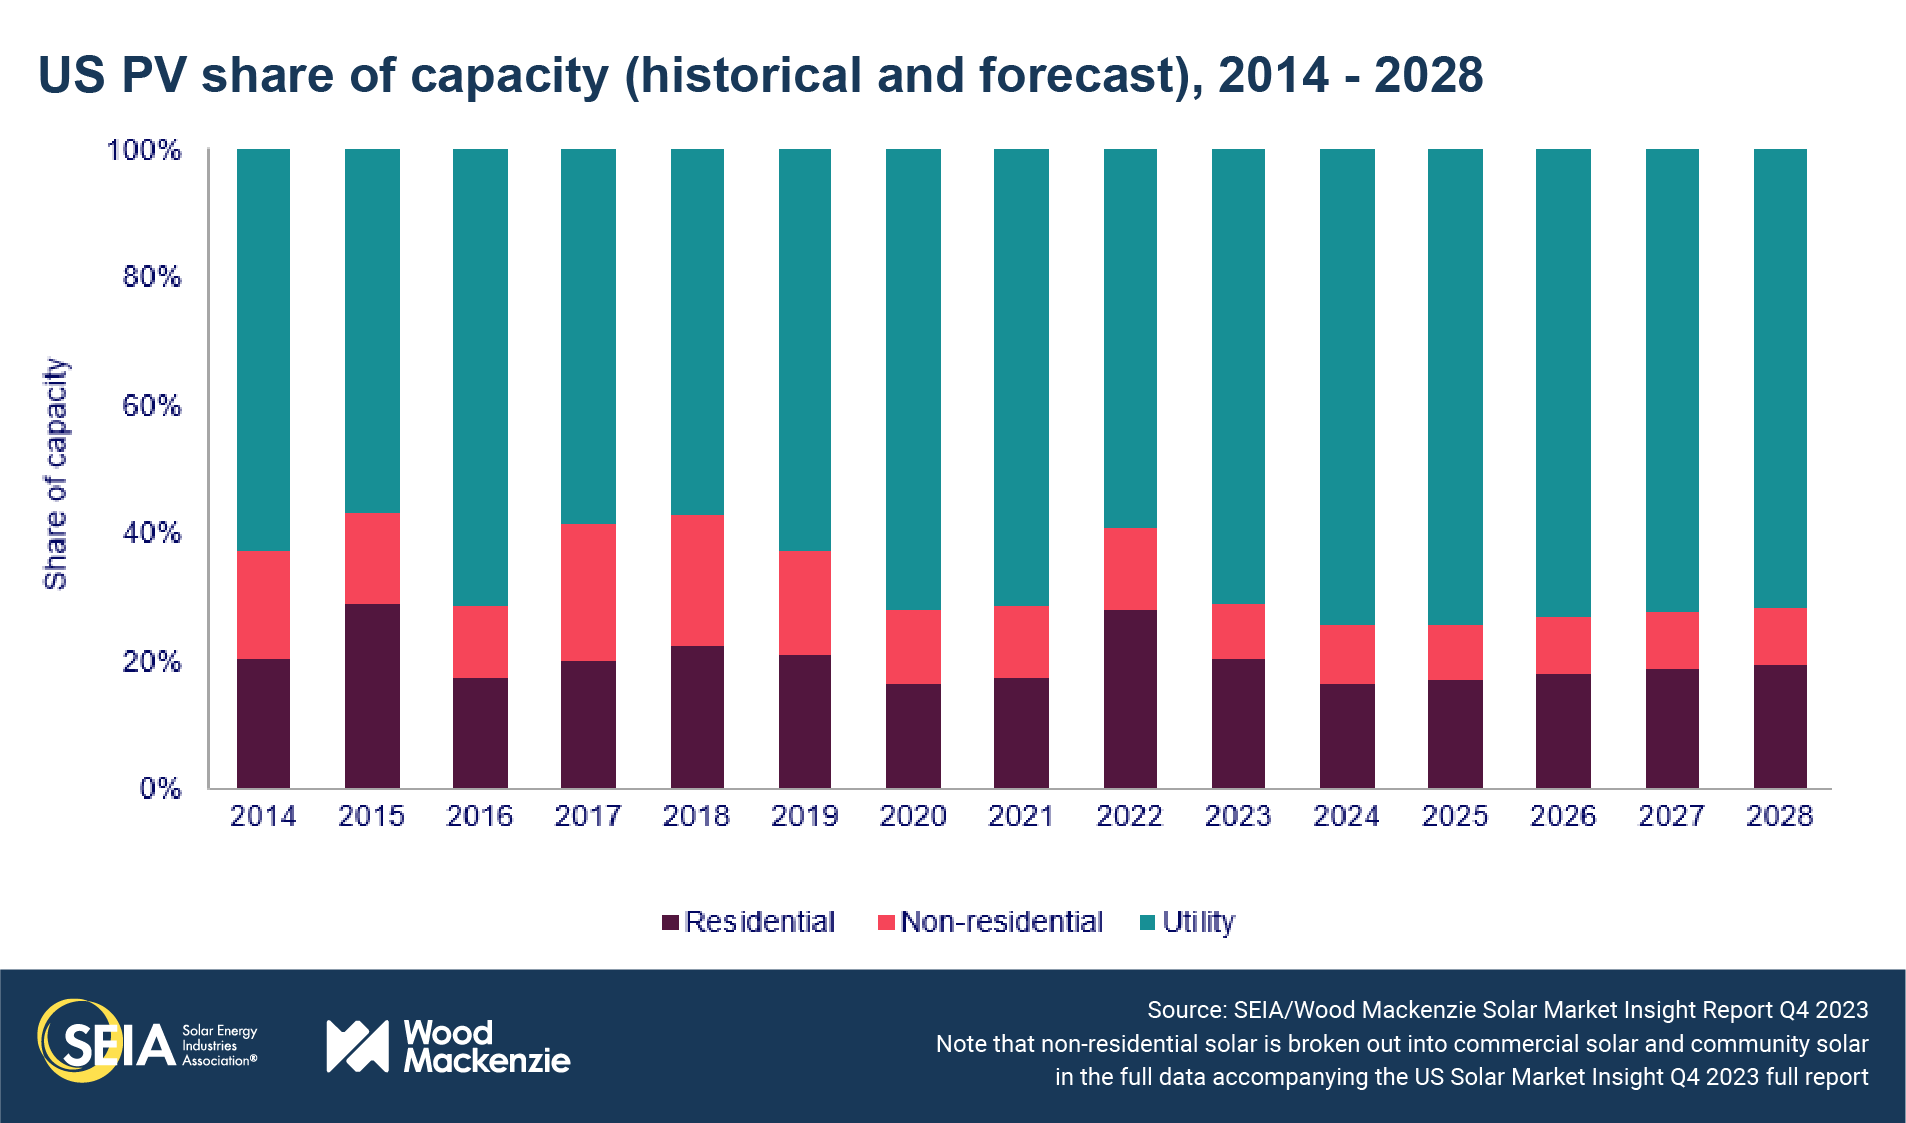
- In Q3 2023, the US solar market installed 6.5 GWdc of capacity, a 35% increase from Q3 2022 and flat growth compared to Q2 2023. This was a record third quarter for the industry, continuing the installation momentum of the last few quarters.
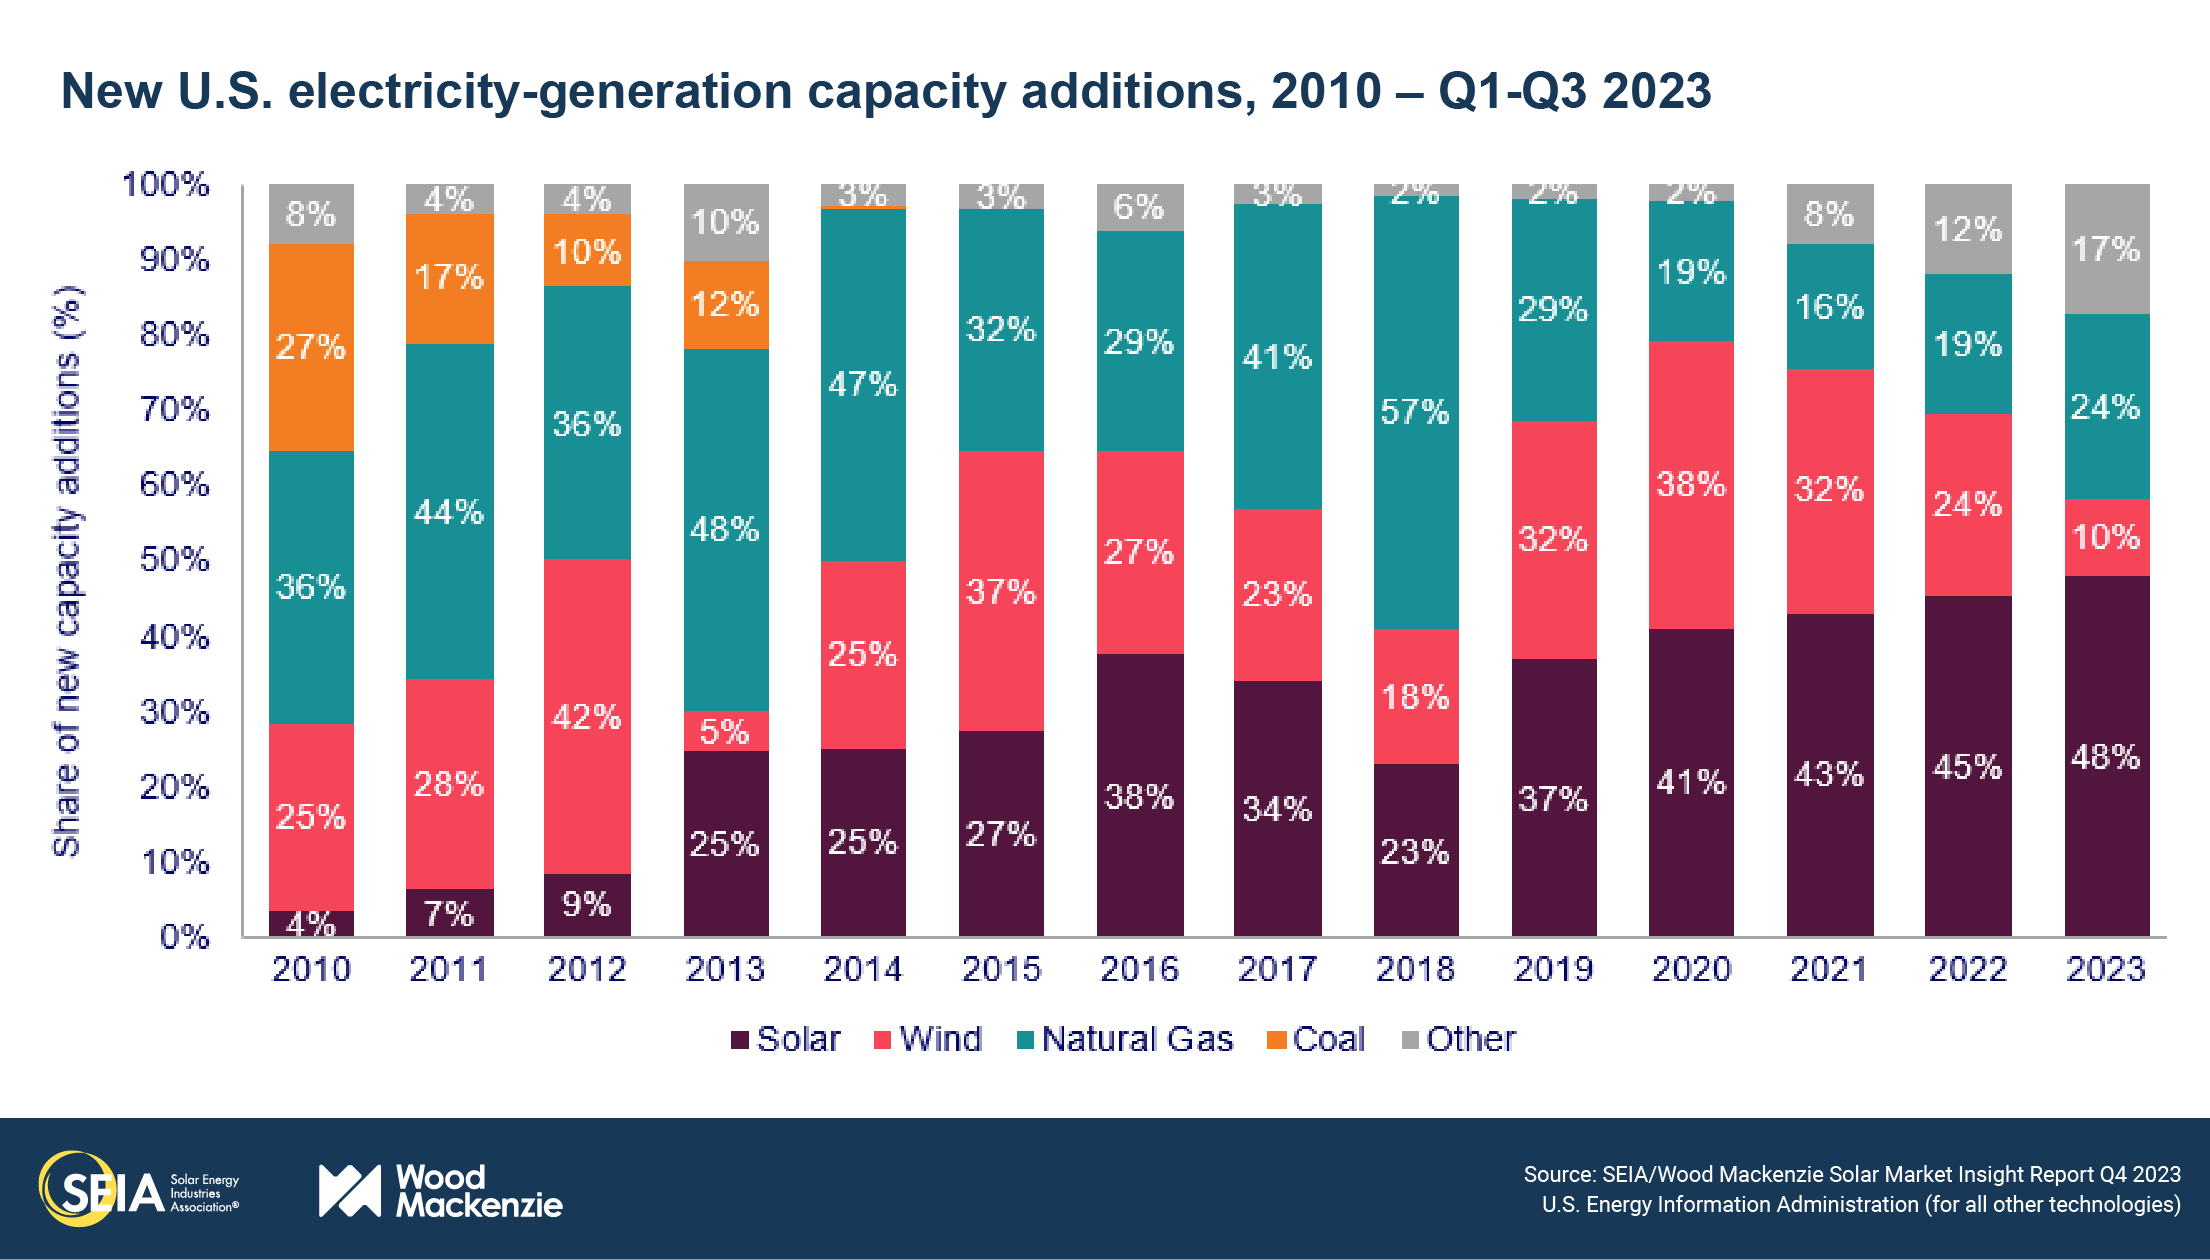
- Solar accounted for 48% of all new electricity-generating capacity added to the US grid through the first three quarters of 2023. Cumulative operating solar capacity now stands 161 GWdc and 4.7 million systems.
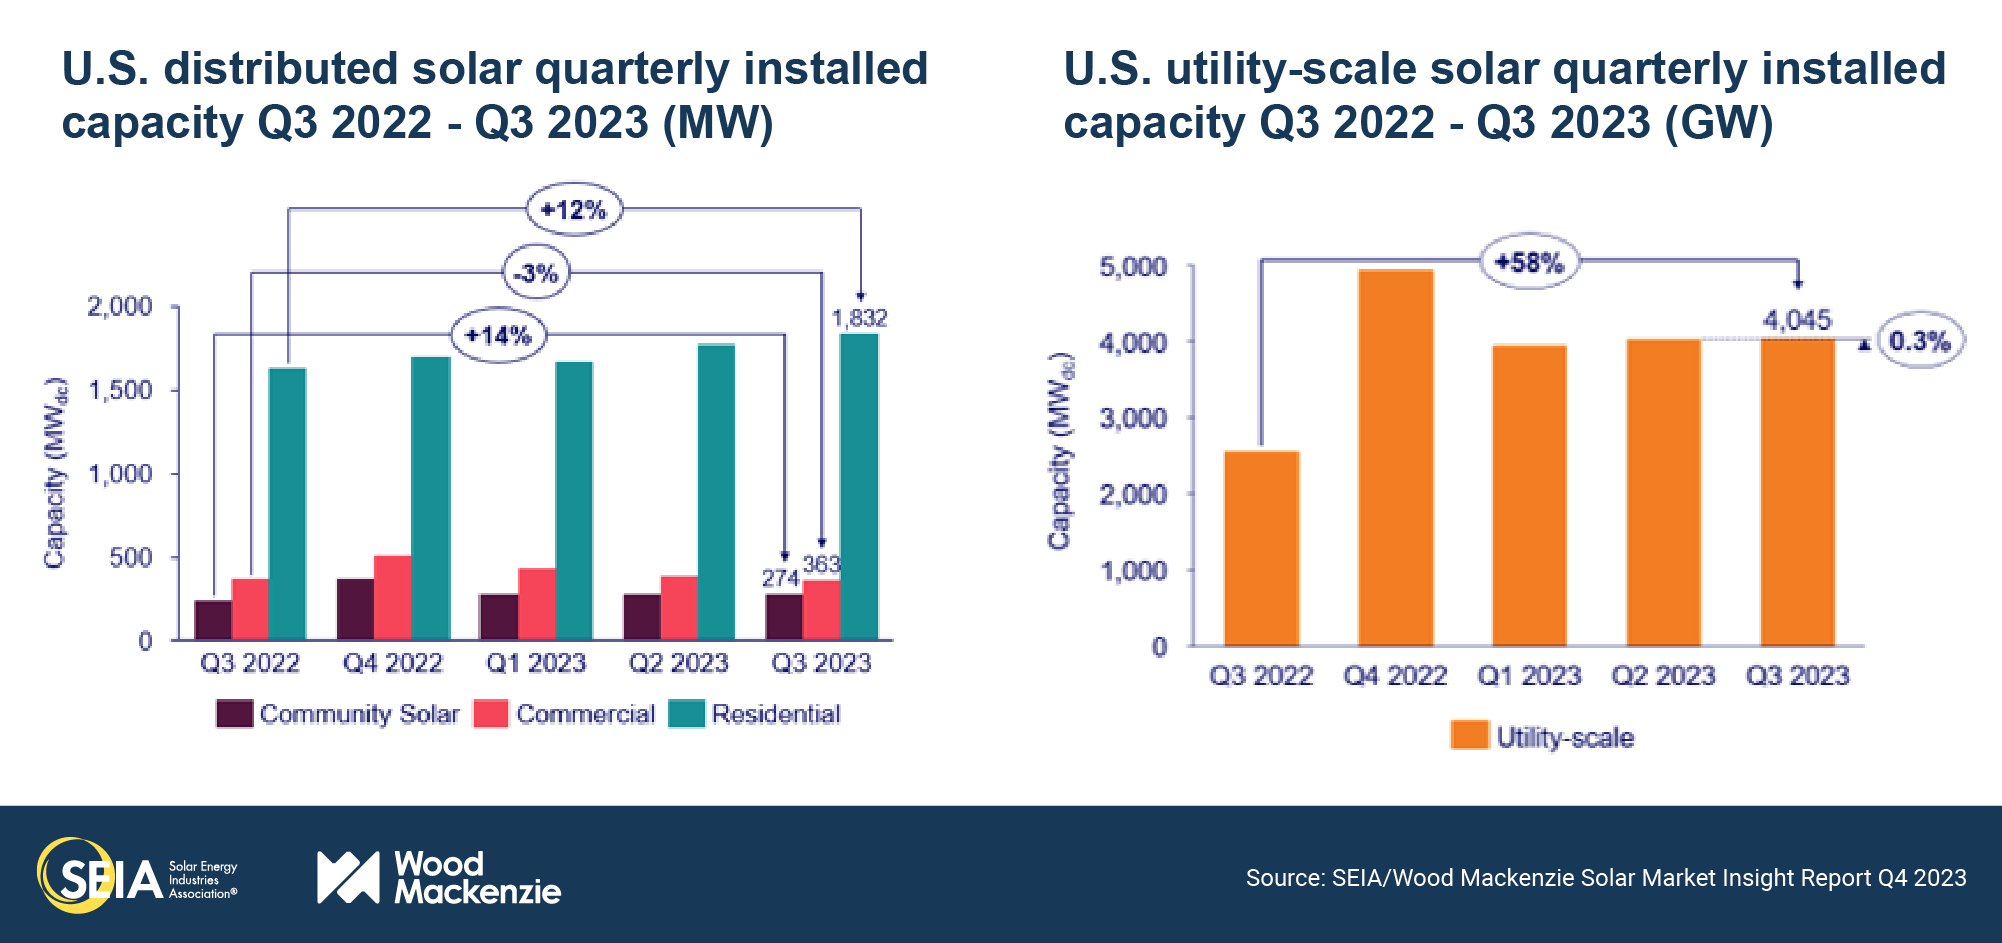
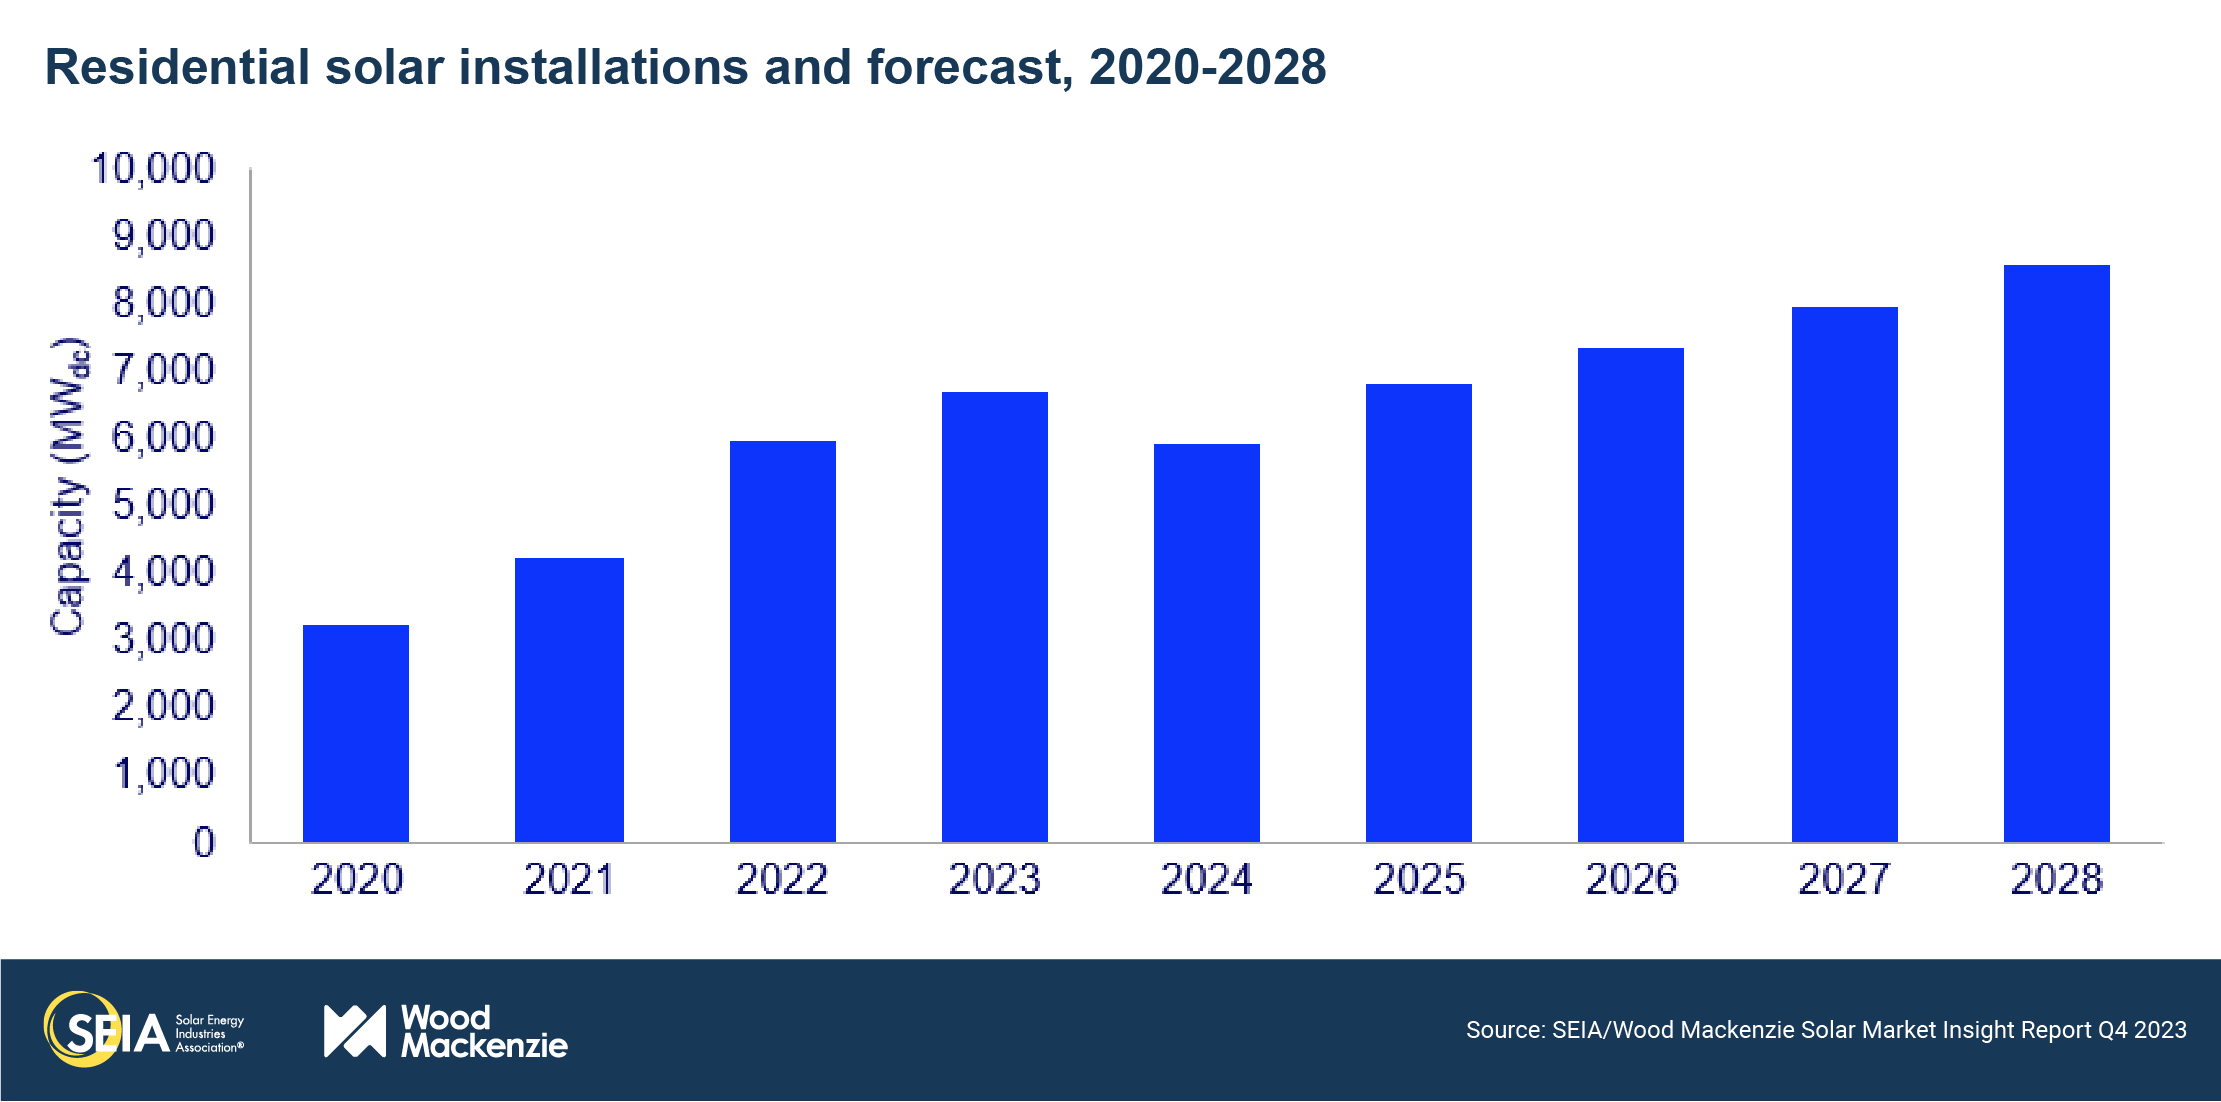
- The residential segment set another quarterly record at 1.8 GWdc installed across more than 210,000 projects in Q3 2023, reflecting 12% growth over the same quarter last year. This growth is driven by California, where installations had already grown 31% year-over-year in the second quarter and grew another 29% in the third quarter. Installations are surging as backlogs of sales made before the switch to net billing in April are interconnected.
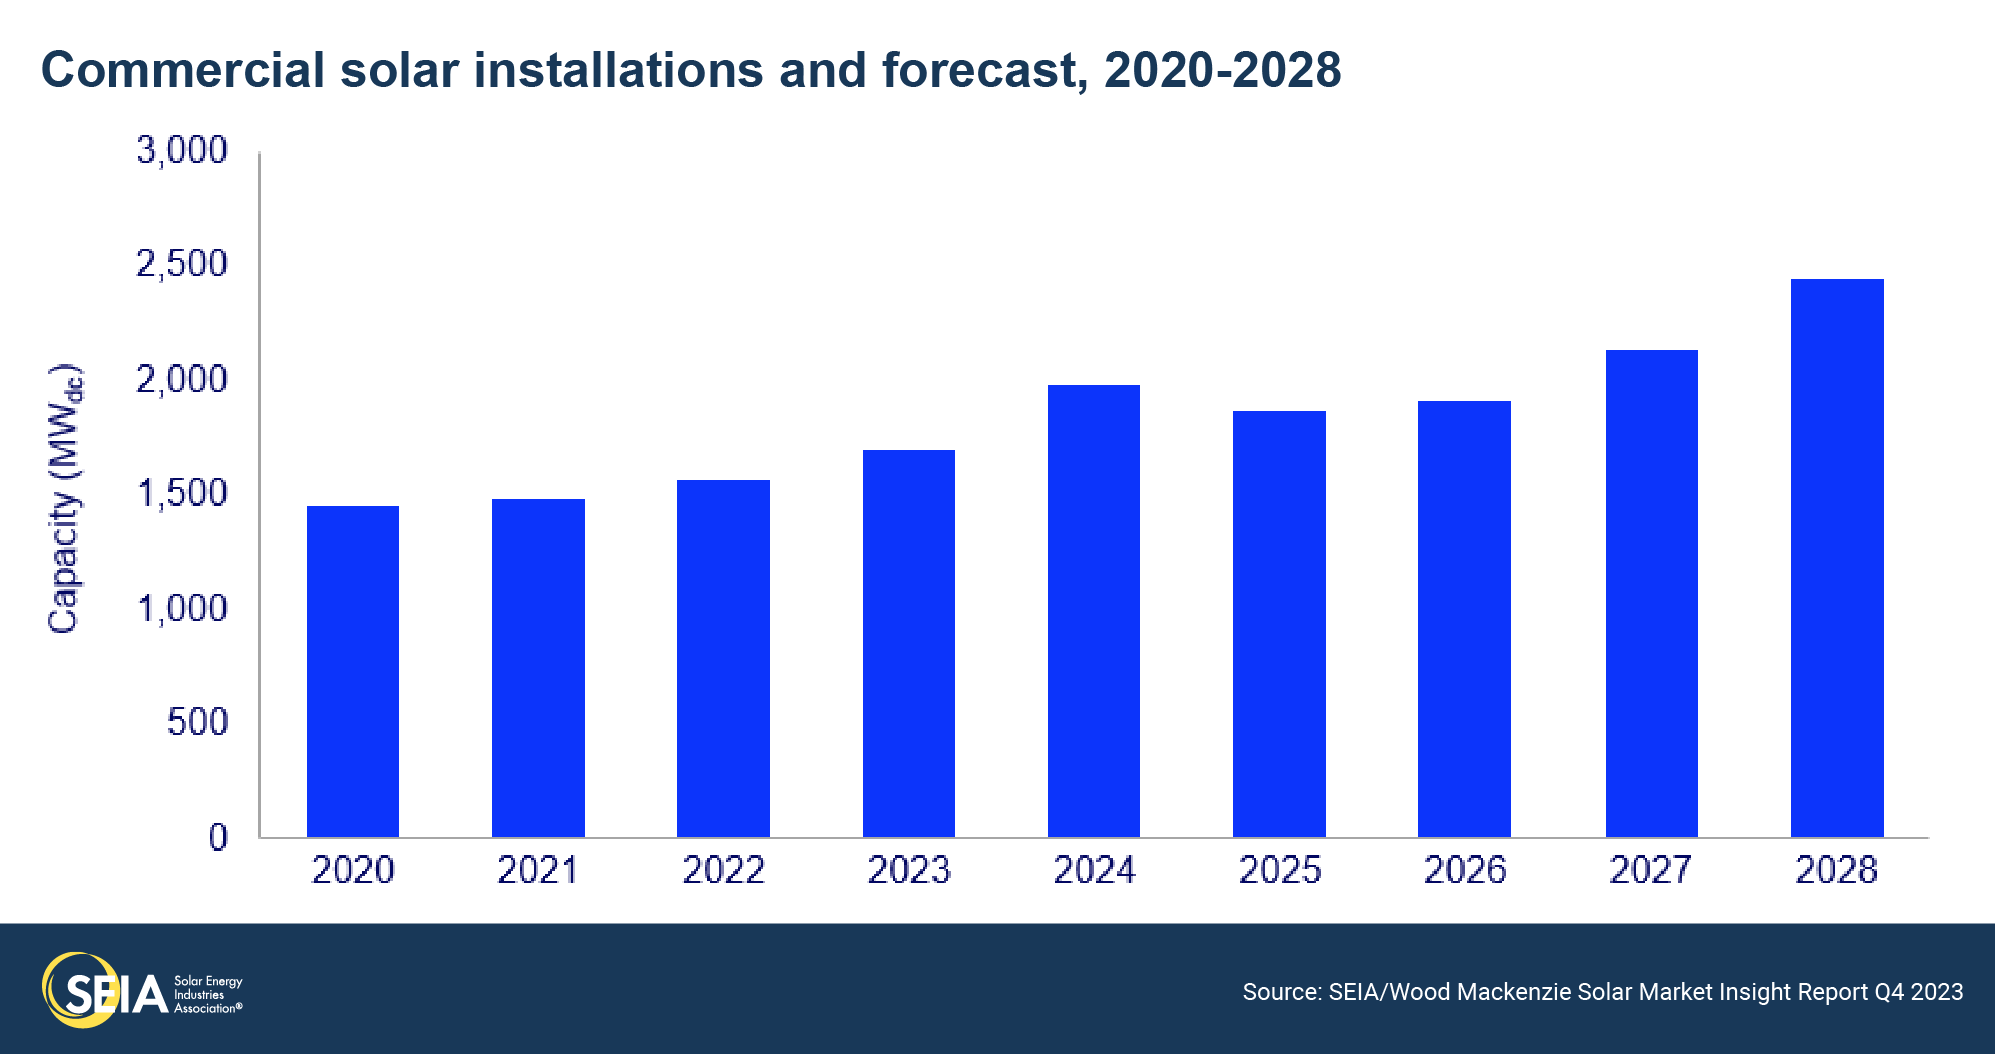
- The commercial solar segment installed 363 MWdc, declining 3% compared to Q3 2022 and 6% compared to Q2 2023. There have been slight slowdowns in Northeast states which are partially offset by growth in California and emerging state markets.
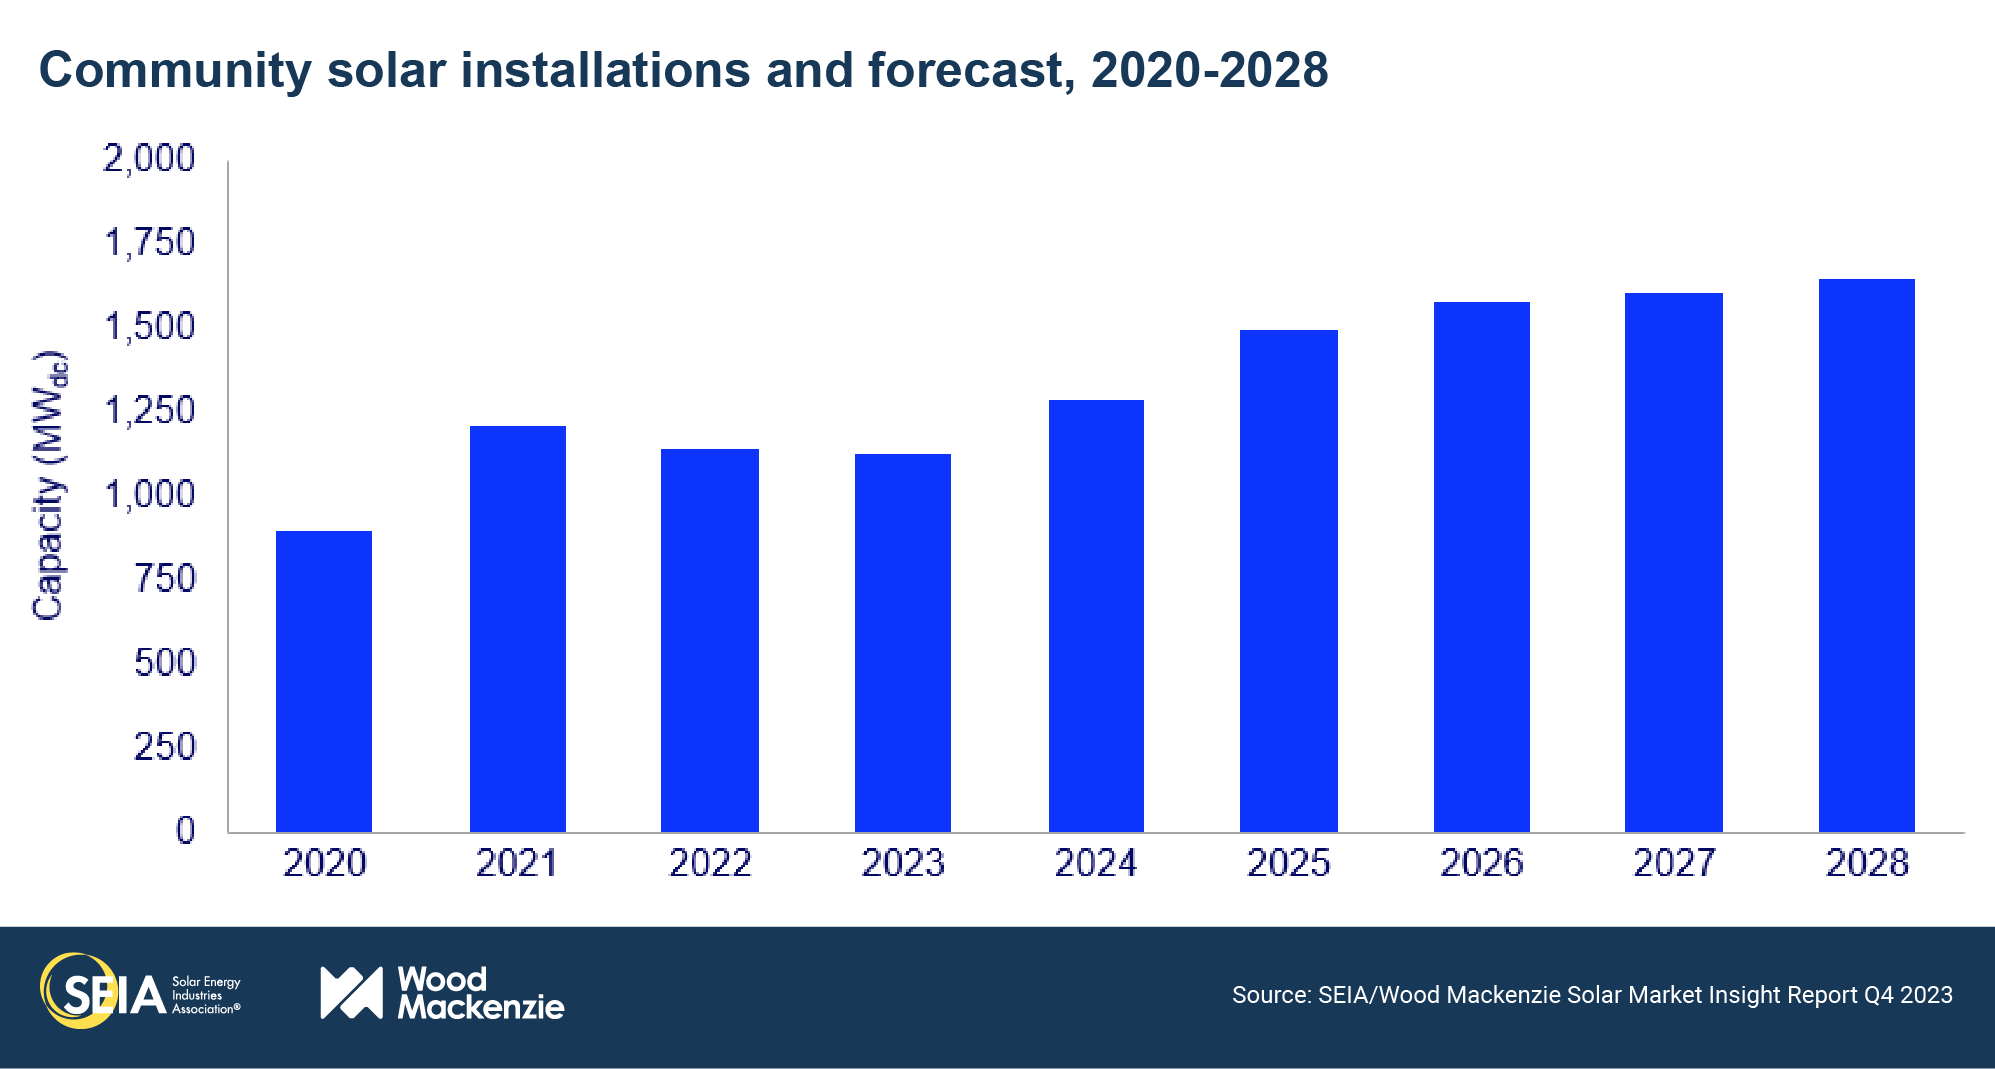
- The community solar segment installed 274 MWdc, a 14% increase over Q3 2022 and flat compared to last quarter. We continue to see stagnation in some major markets as interconnection, permitting, and siting challenges persist.
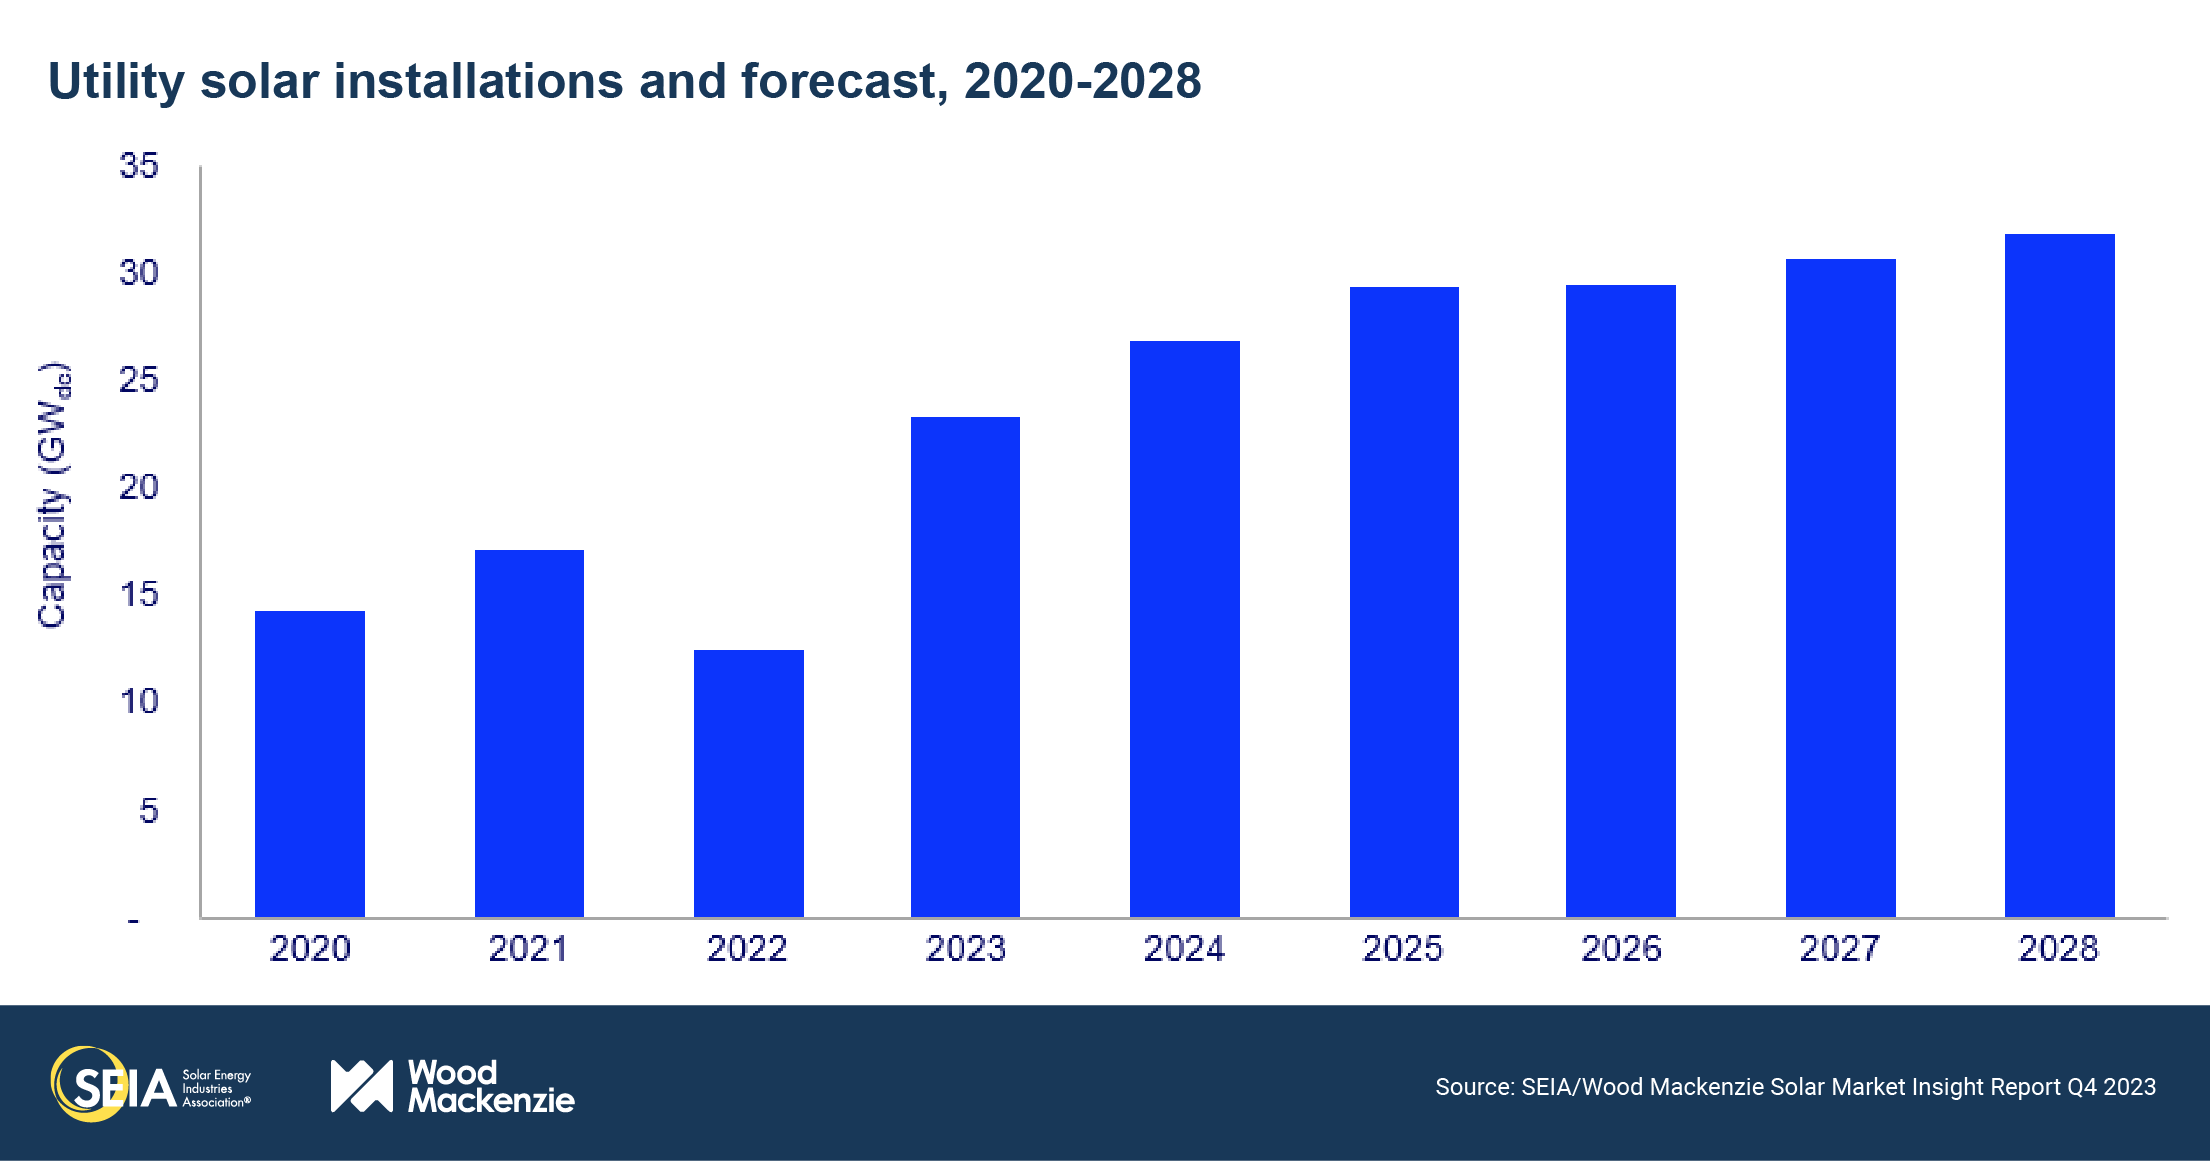
- The utility-scale segment installed just over 4 GWdc in Q3 2023, representing 58% growth over Q3 2022 (when supply chain constraints were severely suppressing installations) and flat compared to last quarter. This segment has already installed nearly as much capacity through the third quarter as all of 2022, mostly due to abating supply chain constraints.
- Imbalances in global solar module supply and demand have put significant downward pressure on module pricing, with average global pricing falling 30-40% from the first quarter to the third quarter. However, this imbalance is driven by excess capacity in China, which makes up less than 0.1% of US module imports due to a combination of tariffs and enforcement of the Uyghur Forced Labor Prevention Act (UFLPA). Still, the ripple effects caused by this imbalance have pushed US module prices down 10-15% over the same timeframe as supply constraints have alleviated.
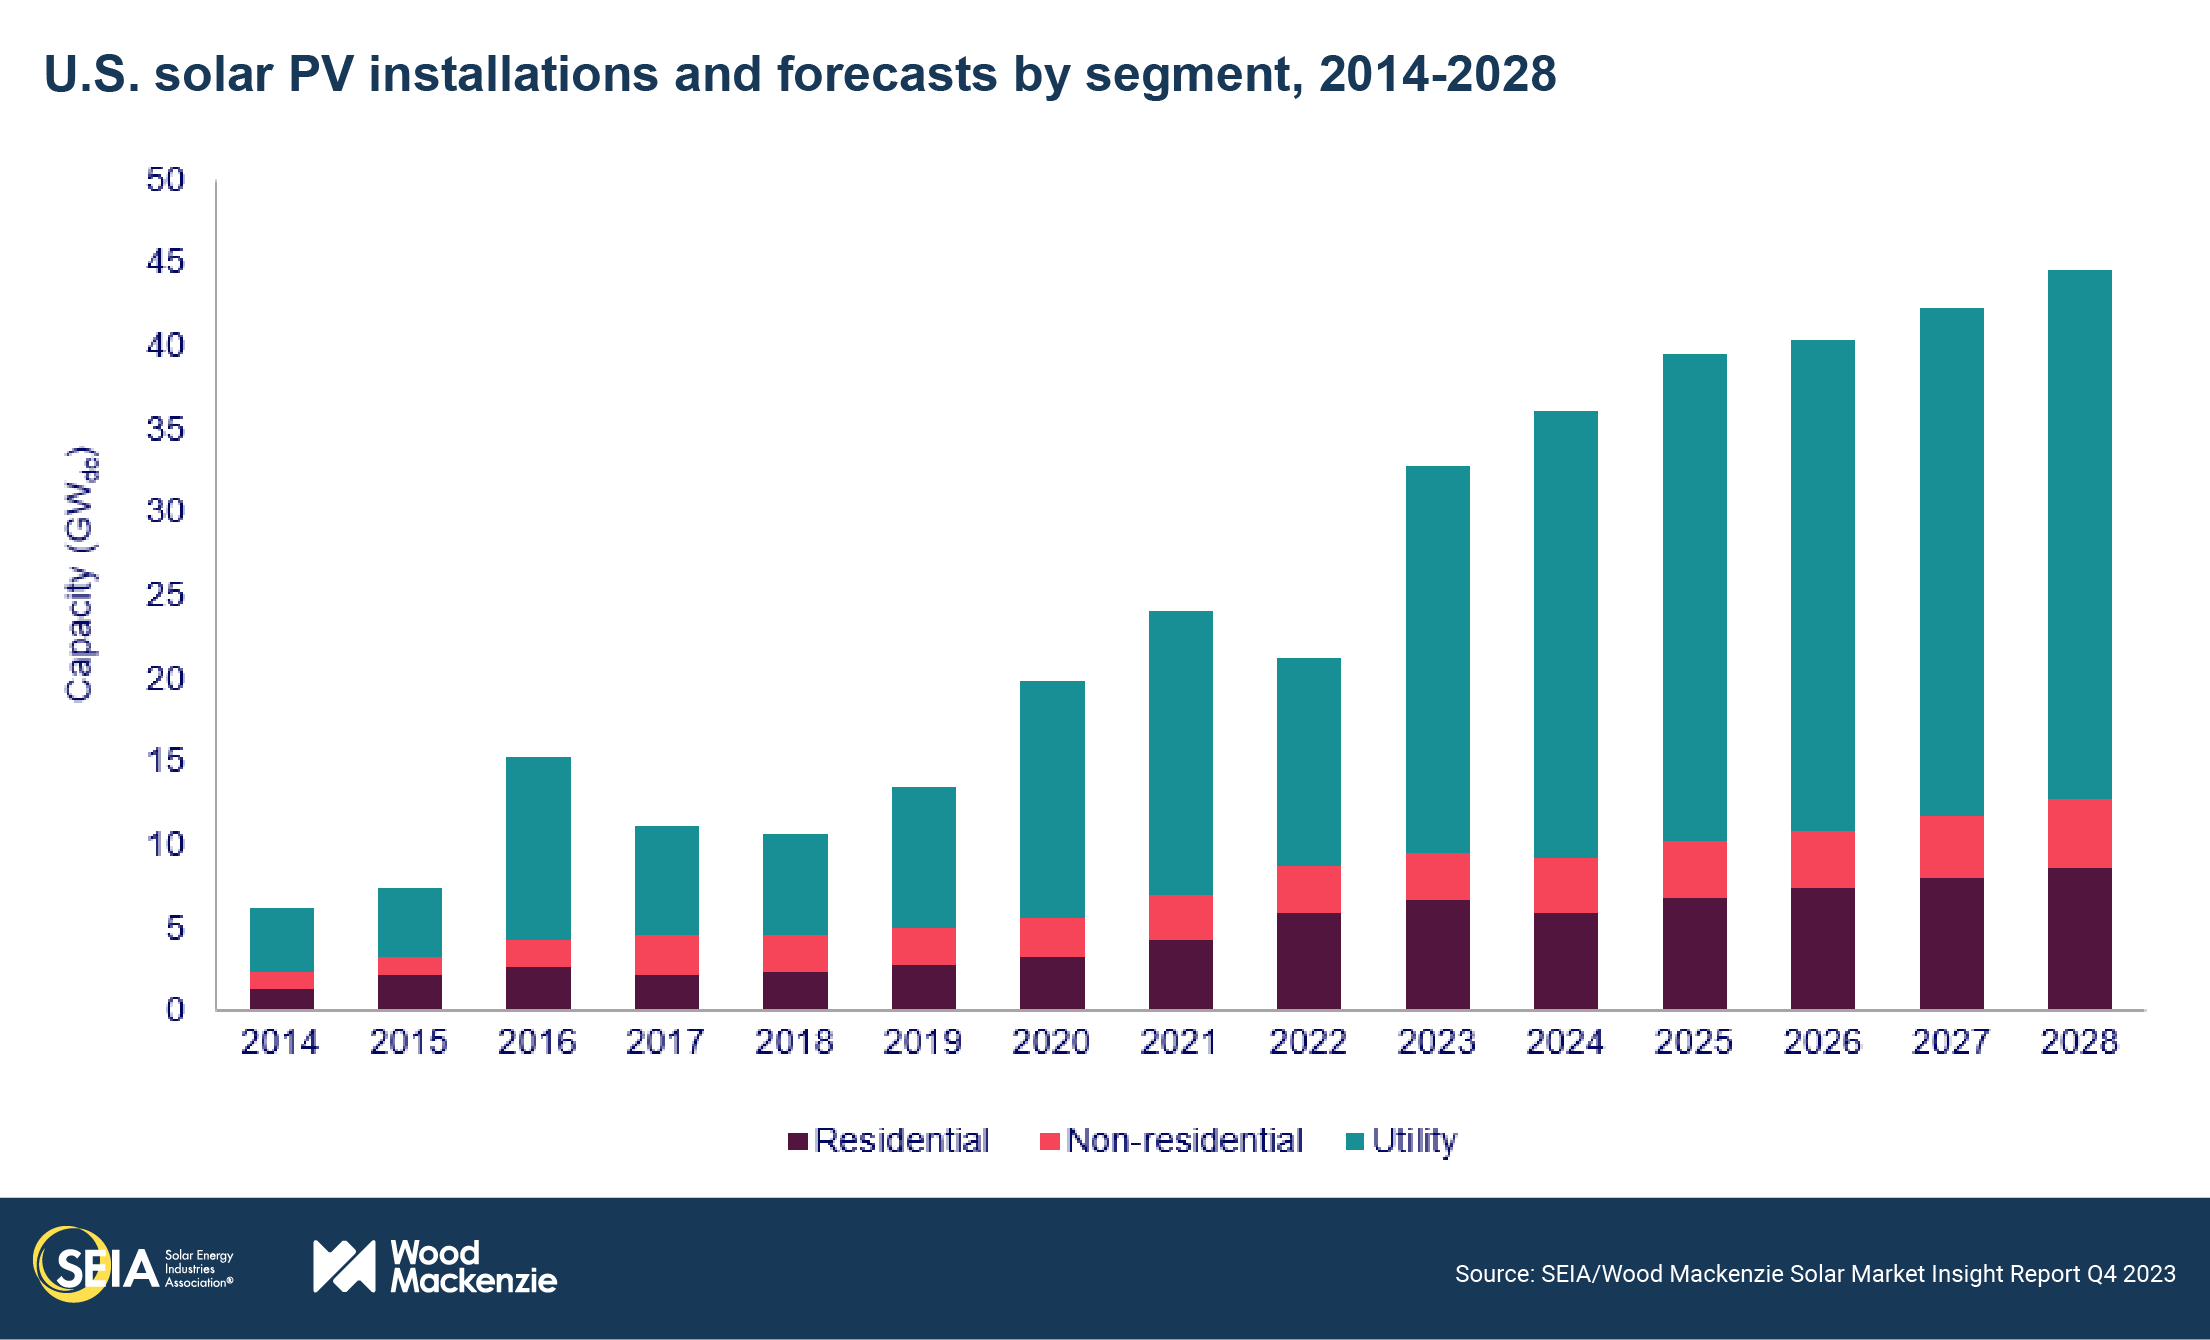
- Wood Mackenzie expects the US solar industry to grow 55% this year compared to 2022, a slight upward revision to last quarter’s expectations. With nearly 33 GWdc of capacity expected, it will be the nation’s largest year of solar installations by far. Unsurprisingly, most of this growth comes from the utility-scale segment, which bore the brunt of the supply chain impacts in 2022.
- Our growth outlook for the US solar industry remains strong, averaging 14% annually over the next five years. However, sustained growth will become more challenging in the longer-term as interconnection bottlenecks and transmission capacity suppress the pace of installations.
2. Introduction
The US solar industry installed 6.5 gigawatts-direct current (GWdc) of capacity in the third quarter of 2023, a 35% increase from Q3 2022 and a 1% increase from last quarter. While module supply for the utility-scale segment remains moderately tight, increased imports compared to last year have supported installation volume recovery.
The residential segment also contributed to healthy volumes in the third quarter, with 1.8 GWdc installed. California led this growth, with a record 735 MWdc installed, more than 150 MWdc larger than last quarter. Installations in California are surging as backlogs of sales made before the mid-April switch to net billing are interconnected. Commercial and community solar volumes followed a similar pattern as last quarter – declining slightly or remaining flat. For commercial solar, slowdowns in major Northeast markets are being partially offset by growth in California and emerging markets. For community solar, there are healthy pipelines in most major markets, but interconnection and permitting timelines continue to slow deployment. Utility-scale solar had yet another quarter of solid year-over-year growth, up 58% compared to Q3 2022. We expect utility-scale solar to end the year strong with a total of over 23 GWdc of installations, which would represent 86% growth over 2022.
Overall, photovoltaic (PV) solar accounted for 48% of all new electricity-generating capacity additions in the first three quarters of 2023.
As module supply constraints ease, limited availability of other equipment takes the spotlight
As we near the end of 2023, it’s clear that the utility-scale solar industry has recovered significantly after a rough 2022. The segment has already installed 12 GWdc, slightly less than total utility-scale installations in 2022. As we’ve reported in the past, supplier diversification and releases of module detentions from Customs and Border Protection (CBP) have resulted in notable increases in solar module imports this year compared to last year. As more equipment has moved through ports and made its way to project sites, installations have ramped up, with average quarterly volumes in Q1-Q3 nearly double that of 2022.
However, it’s important to acknowledge the differences in solar module supply dynamics between the US and the rest of the world. Other global regions are currently in a state of module oversupply. As China continues its massive expansion of manufacturing capacity across the entire solar value chain, there has been significant downward pressure on global module pricing. The impacts of this oversupply situation have escalated recently, with reports of spot module prices outside of the US as low as 14-15 cents/watt.
By contrast, the US market is somewhat insulated from these pricing dynamics. Less than 0.1% of US module imports this year have come from China due to a combination of tariffs (anti-dumping and countervailing duties [AD/CVD], Section 201, and Section 301). Almost 80% of modules for the utility-scale market come from Southeast Asia. And while Southeast Asia is generally a low-cost region for module production, manufacturers are still exposed to the restrictions on polysilicon sourcing from China due to the Uyghur Forced Labor Prevention Act (UFLPA).
Consequently, module supply to the US utility-scale sector is still tighter than other global regions. Demand for modules from top tier 1 manufacturers is high. This has kept US module pricing significantly above price points in other countries, even without anticircumvention tariffs (for more on solar component pricing, see Wood Mackenzie’s PV Pulse). On balance, availability of modules for the US utility-scale market is still constrained but has improved substantially this year. Of course, module availability will continue to improve as more domestic manufacturing comes online.
As module supply has loosened, supply of other types of electrical equipment has become a greater concern for the utility-scale segment. Transformer availability has become a widespread problem, with wait times extending past 2 years in some cases. High-voltage circuit breaker lead times have nearly doubled in the last year to an average of 100 weeks (see Wood Mackenzie’s report H2 2023 US solar PV system pricing). This has already increased balance of system (BOS) pricing for utility-scale solar. With no signs of this trend reversing, we expect electrical equipment availability to be one of several factors slowing utility-scale solar growth in the next several years.
A tale of two residential solar markets
Third quarter installations for the residential solar market were also robust, setting another quarterly installation record. As a result, we now anticipate 13% growth in residential solar this year. This may come as a surprise to those monitoring the steep declines in residential solar stock prices in recent months. And this is why it’s important to understand the dynamics shaping residential solar growth, which point to two different sets of residential solar markets.
In California and several Northeast states, installation volumes are rising. The switch to net billing in mid-April drove a dramatic increase in residential solar sales in California. That enormous backlog of sales has driven intense installation growth in the last two quarters, and we expect this to last through the first quarter of 2024. Some in the industry have been surprised by this delay, but project-level installation data proves there can easily be a 2-3 quarter lag between sales and interconnection. We expect installation volumes to drop off precipitously once this sales pipeline runs out (likely in early to mid-2024). But California’s growth is currently bolstering national residential solar installation volumes.
In the Northeast, retail rate increases that occurred last year are also driving growth. The Northeast generally has high retail rates compared to the rest of the country. And since the Northeast was heavily impacted by high gas prices during the energy crisis, rates rose substantially. Retail rate increases are creating opportunities for significant customer savings. While we do expect rates to decline as more moderate gas prices impact utility costs (and in some cases, they already have), higher retail rates are driving installation volume growth today.
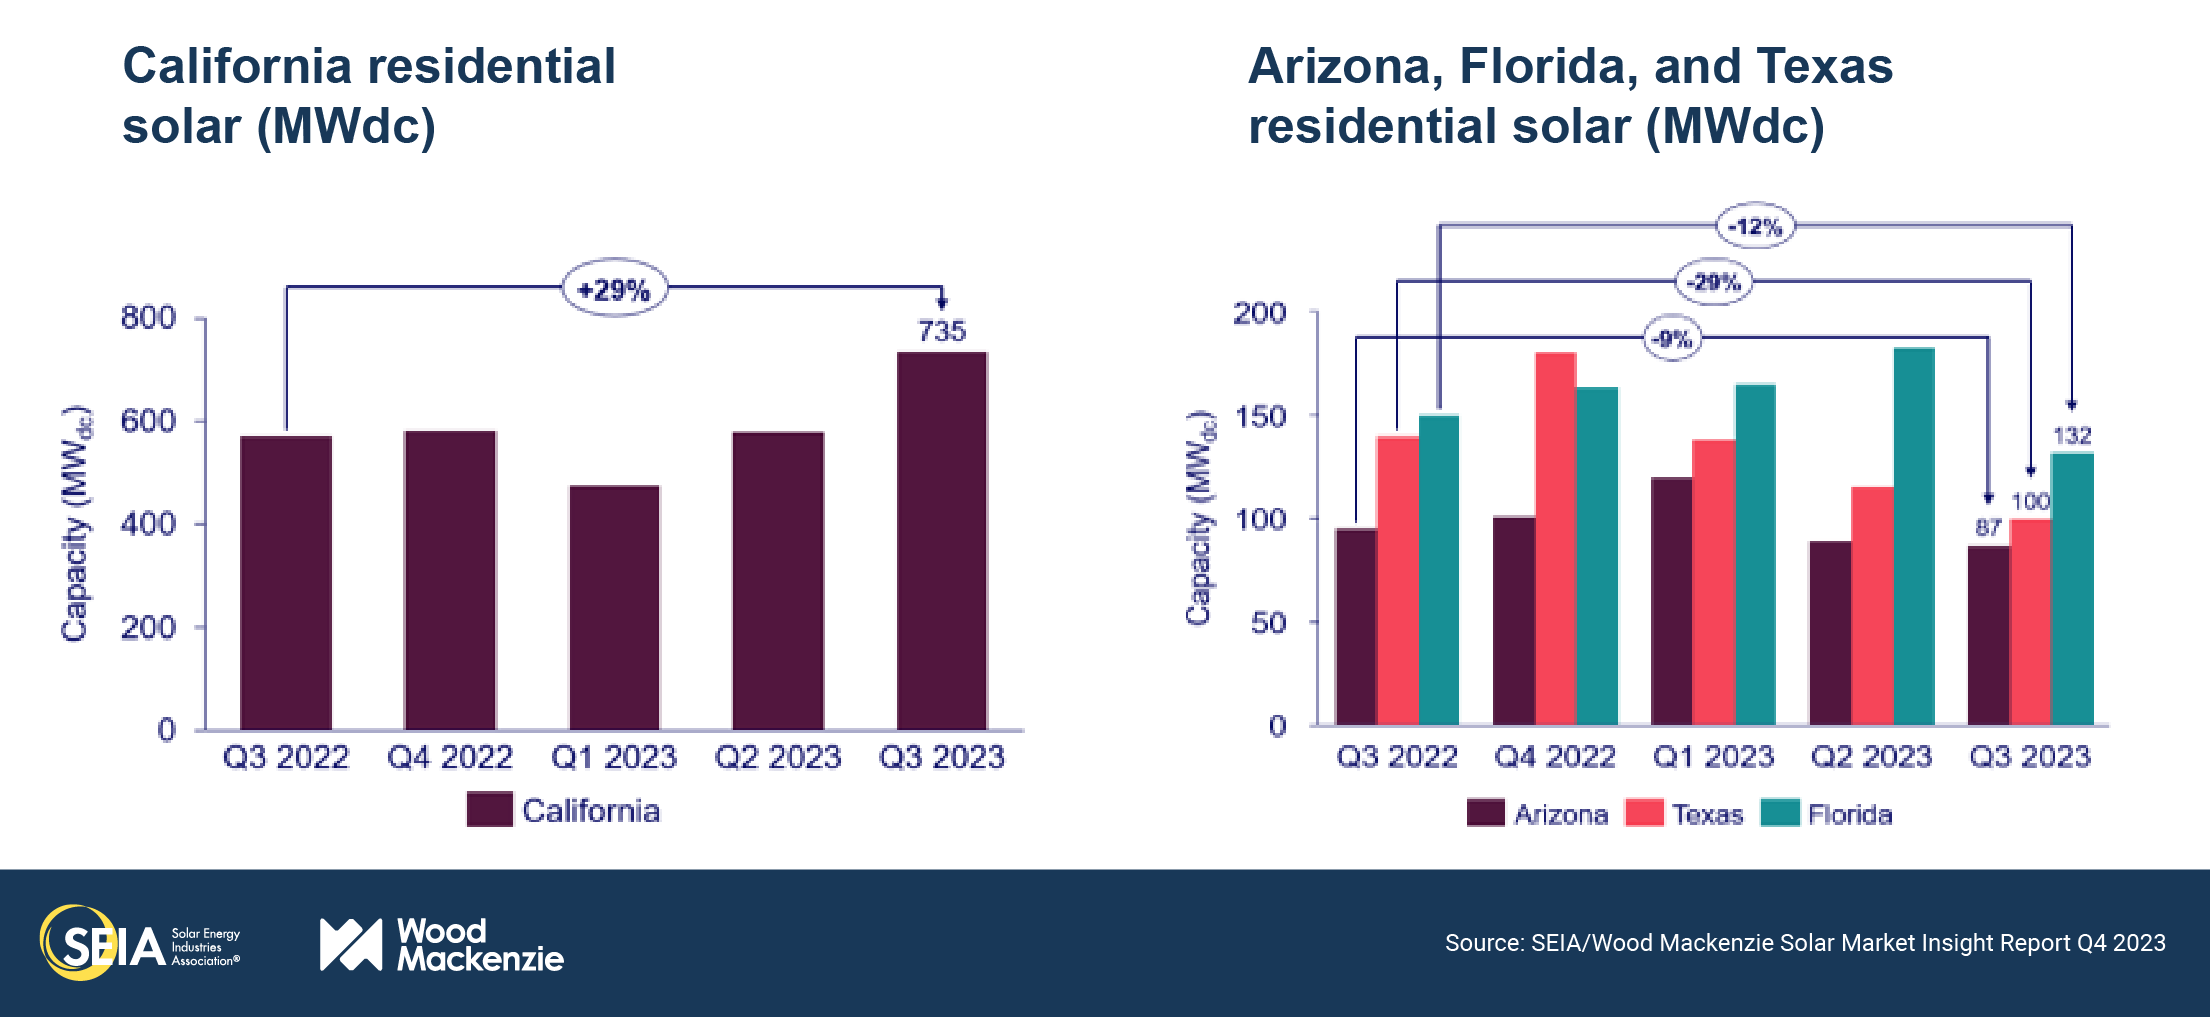
This growth is being partially offset by a trend that characterizes the second set of markets: shrinking sales volumes from rising interest rates. Solar loans became much more expensive in 2022 because of federal interest rate increases. In price-sensitive markets like Texas, Arizona, and Florida, sales volumes, particularly for loan companies, started declining in late 2022 and have continued since then. This decline in sales began impacting installation volumes in the first half of this year for Arizona and Texas, and not until the third quarter for Florida (see chart).
Next year, installation growth in California and the Northeast will no longer offset the impacts of declining residential solar sales volumes, mostly because of the anticipated drop in California. As a result, we expect the residential solar market to decline by 12% in 2024.
Robust near-term growth will give way to more modest long term expectations
Our outlook for the US solar industry puts average annual growth at 14% between 2023 and 2028. But growth is much stronger in the near-term before falling to the low single-digits starting in 2026. There are differences between each segment, but growth in all solar segments slows down slightly in the next few years. For residential solar, California’s slowdown will impact the broader market and many mature markets will also reach higher levels of penetration. For commercial and community solar, pipelines in major state markets are getting built out faster than they’re being replenished. And for utility-scale solar, despite healthy early-stage pipeline growth, project execution will become increasingly challenging as interconnection timelines lengthen, grid congestion worsens, and labor availability remains limited.
Solar is still the core technology of the US energy transition. Wood Mackenzie expects it will be the largest category of generating capacity on the US grid by 2050. But challenges to this industry’s growth are very real, requiring continued innovation to maximize the value that solar brings to an increasingly complex grid. Interconnection reform, regulatory modernization, and increasing storage attachment rates will be key tools.
3. Market segment outlooks
3.1. Residential PV
- 1,832 MWdc installed in Q3 2023
- Up 12% from Q3 2022
- Up 3% from Q2 2023
Residential solar sales and installation trends vary
In Q3 2023, the residential solar market installed 1,832 MWdc, growing 12% year-over-year and setting yet another quarterly record. The segment’s total installation volumes for the first three quarters of 2023 increased by 24% year-over-year, with thirty-four states plus Puerto Rico seeing annual growth during this timeframe. While high interest rates persist, the segment has some tailwinds, such as module oversupply resulting in lower pricing. Coupled with increasing retail rates, installers can still provide customers with a compelling value proposition in some states. With third-party ownership (TPO) products less sensitive to interest rate increases than loans, installers also continue to report an increase in TPO installations.
Despite installation growth, installers continue to face challenging market conditions and significant reductions in sales volumes in many states due to high interest rates, illustrating the variance between sales and installation trends in different state markets. However, the sales slowdown has already impacted some states’ installation volumes, as many industry players have decreased their expectations for 2023 and 2024. Notably, Arizona, Florida, and Texas, three of the largest residential solar markets, experienced quarterly and annual declines in installed capacity in the third quarter. Installers are coping with these challenges as best as possible, focusing more on operational efficiencies or experimenting with pricing and product offering tweaks to survive the slowdown.
Wood Mackenzie forecasts 13% growth for the residential solar market in 2023. Although we anticipate a weaker fourth quarter of installations for many states, we increased our outlook for this year by 3%, primarily driven by a boost to California, which added a record-breaking 735 MWdc of installed capacity in Q3 despite continued utility interconnection delays. We now expect that installation backlogs from sales made under NEM 2.0 will last through early 2024 based on installer feedback. Like past quarters, Wood Mackenzie expects the reduction in sales in California under the new net billing regime to lead to a statewide contraction in 2024. Coupled with high interest rates, which will counteract some of the benefits of the IRA in the short-term, we reduced our 2024 forecast by 5%, resulting in a 12% national contraction. The residential solar market will recover in 2025 and grow at an average annual rate of 10% between 2025-2028 as growth picks up in emerging markets.
3.2. Commercial PV
- 363 MWdc installed in Q3 2023
- Down 3% from Q3 2022
- Down 6% from Q2 2023
Note on market segmentation: Commercial solar encompasses distributed solar projects with commercial, industrial, agricultural, school, government, or nonprofit offtakers, including remotely net-metered projects. This excludes community solar (covered in the following section).
Commercial solar growth slows down slightly while developers continue to explore new states
Quarter-over-quarter, commercial solar installations decreased slightly. But installations through the first three quarters of the year are still driving our expectation for 9% growth in 2023. The commercial solar industry is seeing a slowdown in growth in more mature state markets such as New York, New Jersey, and Massachusetts. As a result, developers are shifting their focus to states with lower development costs, more available land, growing electricity demand, and rising electricity rates. Healthy installation volumes in certain states across the nation signal near-term growth for 2024.
Many nontraditional commercial solar states are seeing growth, even without strong incentives. Due to an increase in energy demand and rising electricity rates, Ohio and Florida are witnessing significant commercial solar growth. At the same time, more mature markets such as New York and Massachusetts are experiencing a decrease in installations quarter-over-quarter. The pipeline of commercial solar projects in Massachusetts’ SMART program dropped by roughly 40 MWdc this quarter.
We have lowered our five-year outlook for commercial solar slightly (2%) compared to last quarter due to lower-than-expected installation volumes in the third quarter. However, we expect to see an average of 8% growth over the next five years. Even though growth in some more saturated states is slowing, development in emerging markets will increase. We expect slight demand pull-in next year due to the wage and apprenticeship requirements of the IRA – developers with late-stage projects continue to report that they procured equipment or started construction early enough to avoid the extra administrative burden associated with these requirements. In the long term, growth will gradually increase due to the IRA and higher electricity rates. We expect 1,700 MWdc to come online nationally this year and to grow to 2,442 MWdc by 2028.
3.3. Community solar PV
- 274 MWdc installed in Q3 2023
- Up 14% from Q3 2022
- Flat from Q2 2023
Note on market segmentation: Community solar projects are part of formal programs where multiple residential and non-residential customers can subscribe to the power produced by a local solar project and receive credits on their utility bills.
Strong Q3 2023 volumes in key state markets drive 13% increase to 2023 community solar outlook
Community solar installations increased 14% year-over-year in Q3 2023, resulting in 827 MWdc of new installations so far this year – an 8% increase compared to the first three quarters of 2022. Third quarter growth was driven by strong installation volumes in both New York and Maine, totalling 117 MWdc and 74 MWdc, respectively. Maryland is also having a particularly strong year with Q1-Q3 2023 installation volumes up 176% from 2022. As a result, we have increased our 2023 outlook for community solar installations by 13%. Compared to the 6% market contraction in 2023 reported last quarter, we now anticipate flat growth year-over-year, with national installed capacity exceeding 1.1 GWdc.
Despite consistent installations this year, the longer-term outlook for community solar is more uncertain. Interconnection remains by far the greatest hurdle to community solar development, and developers continue to report they will not pursue new development in state markets with poor interconnection or siting conditions, such as Maine and Massachusetts. Additionally, we continue to monitor progress in newer state markets, namely California, New Mexico, Virginia, and Delaware. These states make up a combined 30% of our outlook from 2024 to 2028. While we expect some projects to reach completion in Delaware and Virginia this year, no projects have come online in these newer state programs as of Q3 2023. Additionally, the proposed decision on California’s community solar program has been delayed into at least Q4 2023, the result of which is a key factor in determining the trajectory of the total market.
Overall, our national outlook for community solar remains positive with 8% average annual growth expected from 2024 to 2028. Near term growth is driven by very robust pipelines in mature markets like New York and Illinois. Longer-term, newer state markets support lasting growth as mature markets become more saturated. Finally, community solar developers will begin to benefit from the incentives within the IRA as soon as next year.
3.4. Utility PV
- 4.0 GWdc installed in Q3 2023
- Up 58% from Q3 2022
- 171 GWdc of utility-scale solar will be added between 2023 and 2028
Utility-scale solar achieves its strongest third quarter on record at 4 GWdc
The utility-scale solar sector continued its growth trajectory with 4 GWdc of installations in Q3 2023, its strongest third quarter on record. The sector achieved 58% growth compared to Q3 2022. A cumulative 1.1 GWdc of projects were contracted in Q3 2023, significantly less than past quarters due to high interest rates and tight financing conditions. Combined with quarterly installations, the project pipeline declined slightly to 84.3 GWdc.
The strong deployment growth in Q3 2023 has largely been due to module supply chain stabilization within the past year. Total module imports were 29.6 GWdc in 2022 compared to 24.6 GWdc in the first half of this year, which has eased the procurement challenges seen in previous quarters. However, bottlenecks for equipment procurement have transitioned to transformers and high-voltage circuit breakers. Lead times for these components have increased to an average of 115 to 130 weeks and 60 to 160 weeks, respectively. Higher lead times have significantly impacted project development in the near term, with many developers rushing to secure these components.
Limited EPC availability also continues to impact project timelines, particularly in regions with more stringent environmental permitting regulations and complex topographies. EPC availability has been constrained by a lack of trained personnel, and the administrative complexity related to meeting the prevailing wage requirement is hitting developers harder than originally expected. Many EPCs are also still adapting to the apprenticeship requirements, which has increased their administrative burden.
Wood Mackenzie forecasts that utility-scale solar installations will total 171 GWdc between 2023-2028, a 1% increase compared to our last forecast. The 2023 outlook increased by 484 MWdc (2%) due to strong installations through the first three quarters of 2023. This momentum will continue through 2026, leading to a total increase of 5.3 GWdc in the 2023-2026 period. Lower cost competitiveness of solar and challenged project economics due to increasing renewables penetration have driven a downgrade of 3.7 GWdc in the 2027-2028 period.
4. US solar PV forecasts
5. National solar PV system pricing
- Residential system pricing is up 3% year-over-year
- Commercial system pricing is down 2% year-over-year
- Utility segment system pricing is up 6% for fixed-tilt and 5% for single-axis tracking year-over-year
Note: In November 2023, Wood Mackenzie published a refreshed customer acquisition cost analysis and outlook. Therefore, there are changes to the modeled residential customer acquisition costs and overall national average turnkey pricing in this report compared to past quarters.
Wood Mackenzie employs a bottom-up modeling methodology to capture, track and report national average PV system pricing by segment for systems installed each quarter. The methodology is based on the tracked wholesale pricing of major solar components and data collected from industry interviews. Wood Mackenzie’s Supply Chain data and models are leveraged to enhance and bolster our pricing outlooks. Wood Mackenzie assumes all product is procured and delivered in the same year as the installation except modules for the utility segment, which are procured one year prior to commercial operation.
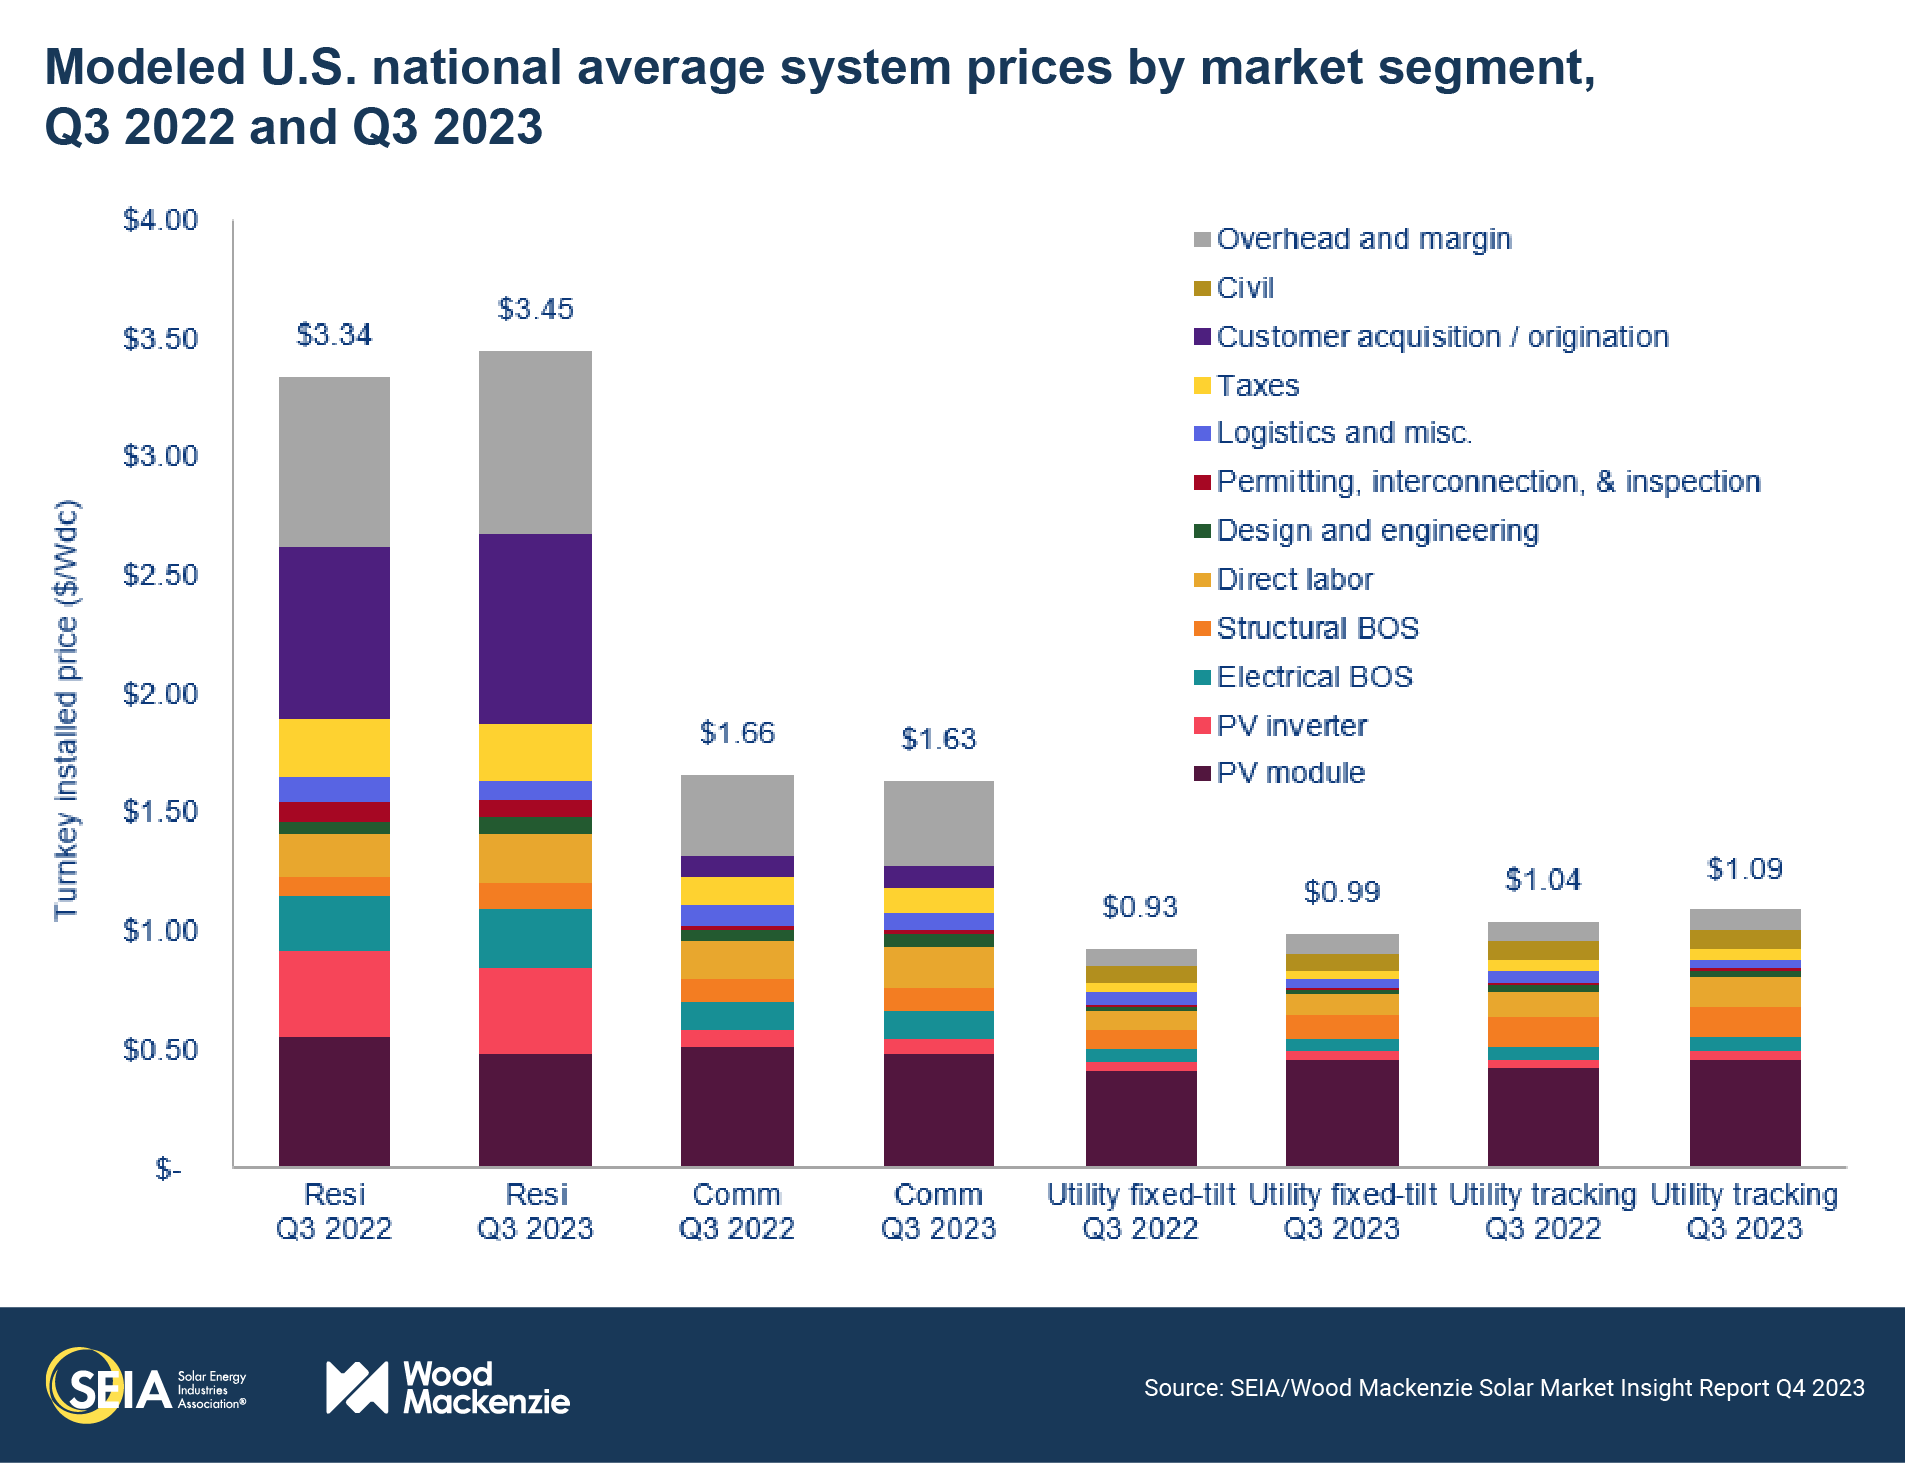
Module prices declined 12% for the residential and 6% for the commercial segment year-over-year. The utility segment continues to see elevated module pricing due to the one-year lag in module procurement reflected in our pricing data. For distributed solar, the decline in module costs has been offset by an increase in the balance of equipment as well as soft costs. Across the four different market segments, labor and engineering costs have increased anywhere from 5-25%. Equipment component costs have also been increasing over the last few quarters due to the rise in inflation. National PV system prices are up across all segments except for the commercial segment, which witnessed a drop of 2% year over year.
License
Ownership rights
This report (“Report”) and all Solar Market Insight® (“SMI”)TM reports are jointly owned by Wood Mackenzie and the SEIA® (jointly, “Owners”) and are protected by United States copyright and trademark laws and international copyright/intellectual property laws under applicable treaties and/or conventions. Purchaser of Report or other person obtaining a copy legally (“User”) agrees not to export Report into a country that does not have copyright/intellectual property laws that will protect rights of Owners therein.
Grant of license rights
Owners hereby grant user a non-exclusive, non-refundable, non-transferable Enterprise License, which allows you to (i) distribute the report within your organization across multiple locations to its representatives, employees or agents who are authorized by the organization to view the report in support of the organization’s internal business purposes, and (ii) display the report within your organization’s privately hosted internal intranet in support of your organization’s internal business purposes. Your right to distribute the report under an Enterprise License allows distribution among multiple locations or facilities to Authorized Users within your organization.
Owners retain exclusive and sole ownership of this report. User agrees not to permit any unauthorized use, reproduction, distribution, publication or electronic transmission of any report or the information/forecasts therein without the express written permission of Owners.
Disclaimer of warranty and liability
Owners have used their best efforts in collecting and preparing each report.
Owners, their employees, affiliates, agents, and licensors do not warrant the accuracy, completeness, correctness, non-infringement, merchantability, or fitness for a particular purpose of any reports covered by this agreement. Owners, their employees, affiliates, agents, or licensors shall not be liable to user or any third party for losses or injury caused in whole or part by our negligence or contingencies beyond Owners’ control in compiling, preparing or disseminating any report or for any decision made or action taken by user or any third party in reliance on such information or for any consequential, special, indirect or similar damages, even if Owners were advised of the possibility of the same. User agrees that the liability of Owners, their employees, affiliates, agents and licensors, if any, arising out of any kind of legal claim (whether in contract, tort or otherwise) in connection with its goods/services under this agreement shall not exceed the amount you paid to Owners for use of the report in question.
related content
You May Also Like