
Other Links: Purchase the Full Report | Press Release
The quarterly SEIA/Wood Mackenzie Power & Renewables U.S. Solar Market InsightTM report shows the major trends in the U.S. solar industry. Learn more about the U.S. Solar Market Insight Report. Released June 18, 2019
Key Figures
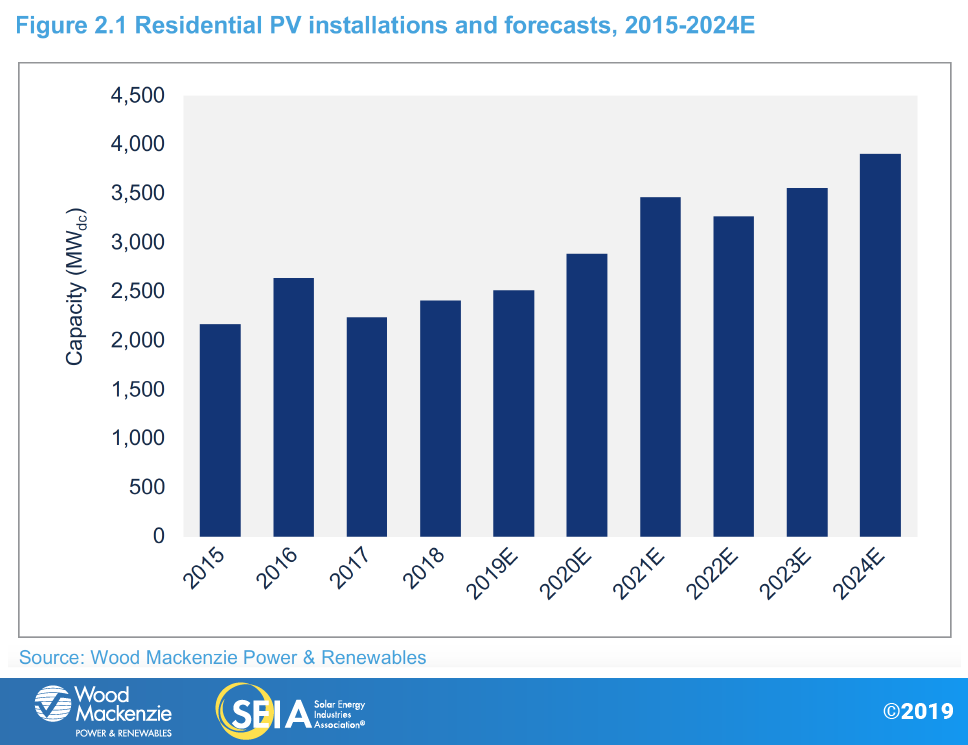
- In Q1 2019, the U.S. solar market surpassed 2 million installations – just three years after the market surpassed the 1 million installation milestone. The industry is expected to hit 3 million installations in 2021 and 4 million installations in 2023.
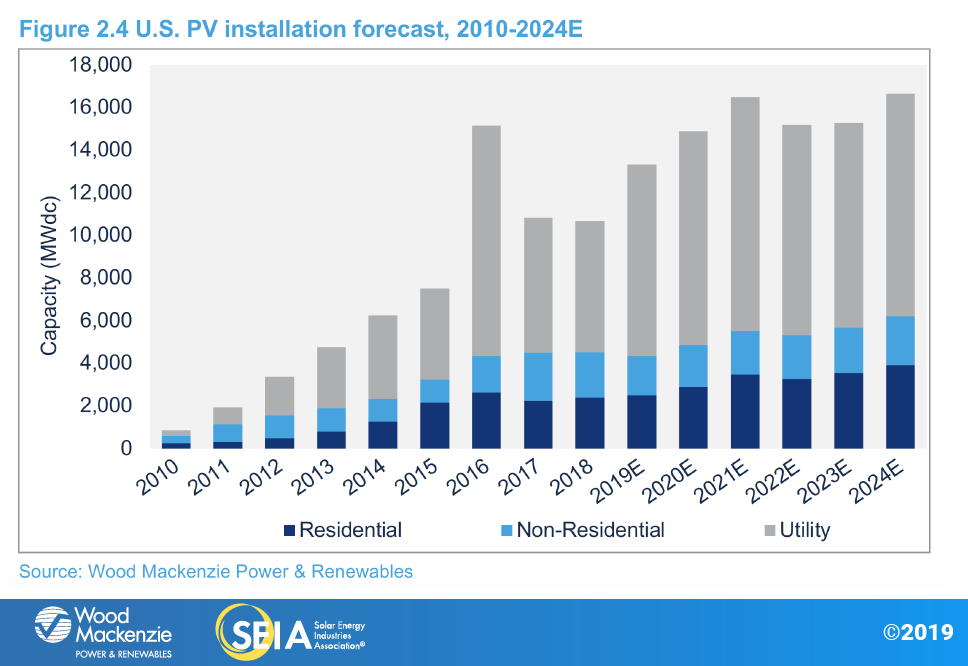
- In Q1 2019, the U.S. solar market installed 2.7 GWdc of solar PV, marking the largest Q1 ever recorded. This represented a 37% decline from Q4 2018 and a 10% increase from Q1 2018.
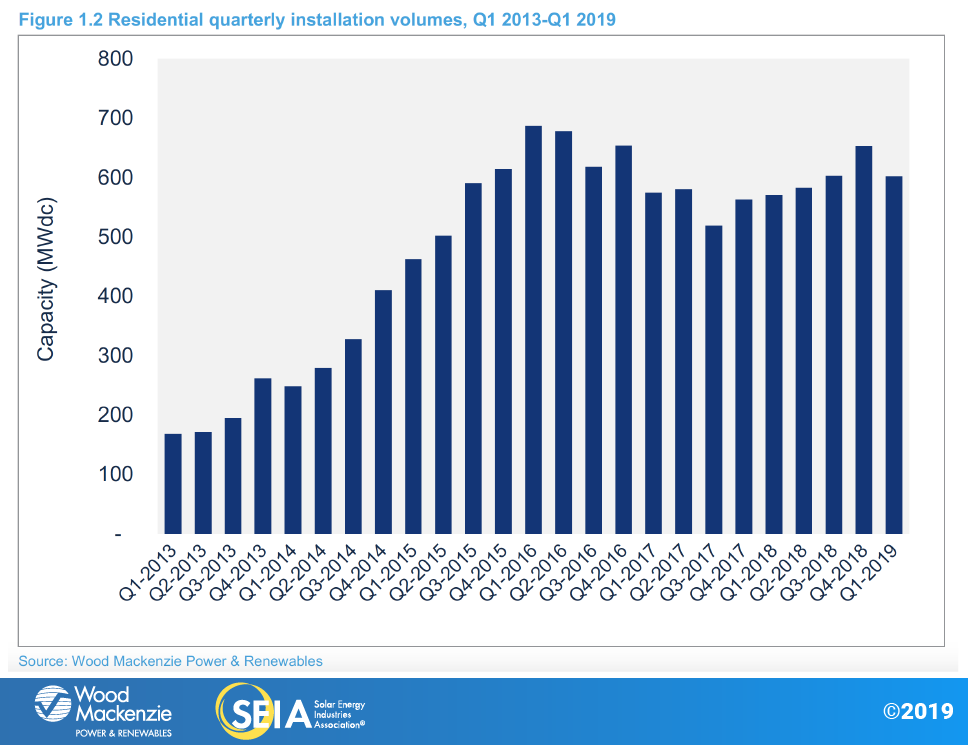
- Residential solar continues its modest rebound, with a third consecutive quarter of more than 600 MWdc of installed capacity.
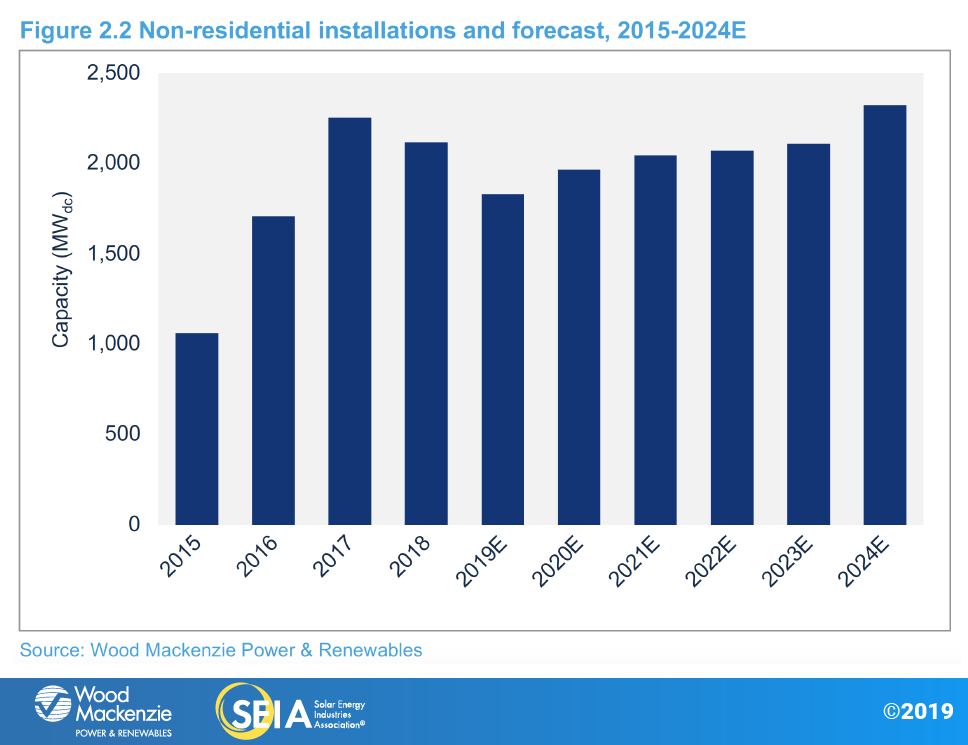
- Non-residential PV saw 438 MWdc installed – its lowest quarter since Q1 2017 – as policy shifts in states like California, Massachusetts and Minnesota continue to hamper growth.
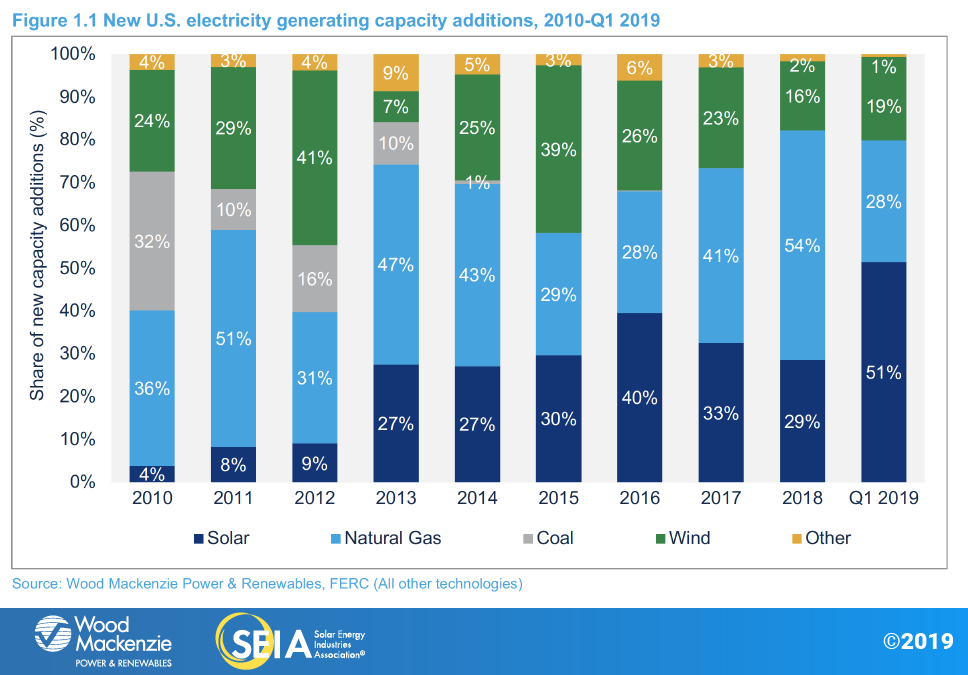
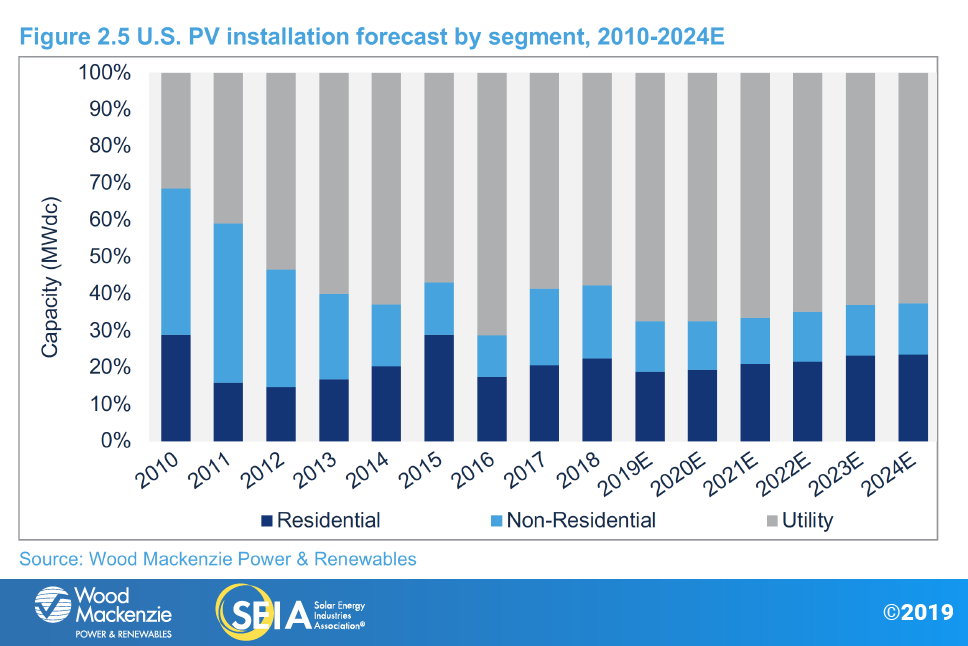
- There were 1.6 GWdc of utility-scale solar installed in Q1 2019, accounting for 61% of U.S. capacity additions this quarter.
- Wood Mackenzie forecasts 25% growth in 2019 compared to 2018, with more than 13 GWdc of installations expected.
- Total installed U.S. PV capacity will more than double over the next five years, with annual installations reaching 16.4 GWdc in 2021 prior to the expiration of the residential federal Investment Tax Credit (ITC) and a drop in the commercial tax credit to 10% for projects not yet under construction.
1. Introduction
In Q1 2019, the U.S. solar market installed 2.7 gigawatts direct current (GWdc) of solar photovoltaic (PV) capacity, a 10% increase year-over-year and the strongest Q1 in the industry’s history. After a year in which the residential sector grew 8%, the rebound continued, with the sector experiencing a third consecutive quarter with more than 600 MWdc added. Conversely, non-residential PV suffered both quarterly and annual declines due to policy transitions and interconnection issues in key markets. The quarter was buoyed by 1.6 GW of utility-scale installations, with new project procurement growing the contracted pipeline to nearly 28 GW. Across all market segments, solar PV accounted for 51% of all new electricity generating capacity additions in Q1 2019. Further, solar surpassed the 2 million installation milestone in Q1 2019, after reaching the first million just three years ago in 2016.
Residential solar continues rebound in a strong first quarter
After growing 8 percent in 2018, the residential solar market grew 5% on a year-over-year basis and is effectively tied for the second-largest quarter since Q4 2016. Since bottoming out in Q3 2017, quarterly growth in five of the last six quarters suggests that the market is adopting a more sustainable growth profile, with a mix of local and regional installers operating alongside national installers. However, state markets with higher penetration levels and increasing customer-acquisition costs continue to struggle with flat or declining installations on a quarterly basis. The continued emergence of new markets has helped to sustain robust installation volumes nationally.
Non-residential PV continues to struggle, entering a second consecutive year of annual decline
Unlike the residential market, a handful of state-specific regulatory cliffs and policy reforms that took effect in 2018 continued to impact non-residential installations in Q1 2019. Major policy reforms in the core non-residential markets of California and Massachusetts are still hampering development. In the case of California, installations were flat on both a year-over-year and quarter-over-quarter basis, which suggests that installation declines stemming from the transition to new time-of-use rates may be abating. Massachusetts is still being negatively impacted by the transition to its new incentive program, which has slowed most non-residential development. As the state transitions to the new SMART program, utility interconnection approvals for qualified projects are taking much longer than anticipated, leaving most projects waiting months, if not years, to interconnect and begin earning SMART tariff revenue. This has resulted in market declines on both a year-over-year and quarter-over-quarter basis.
Module tariffs dampen 2018 utility-scale installs, but post-announcement procurement breaks records
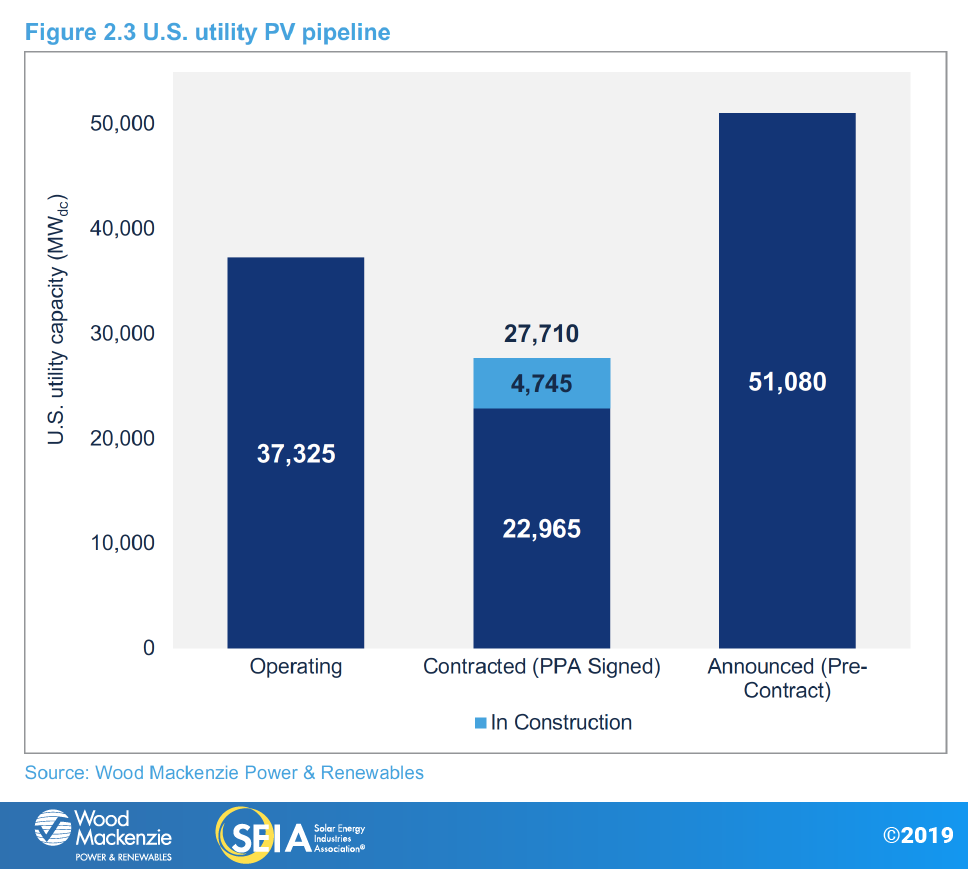
Utility PV maintained the largest share of installations in the U.S. solar market this quarter – 1.6 GWdc of utility PV capacity came online in Q1 2019, representing 61% of quarterly capacity additions. With 4.7 GWdc of projects under construction, 2019 is on track to be a strong year for utility PV, with 46% growth over 2018 expected.
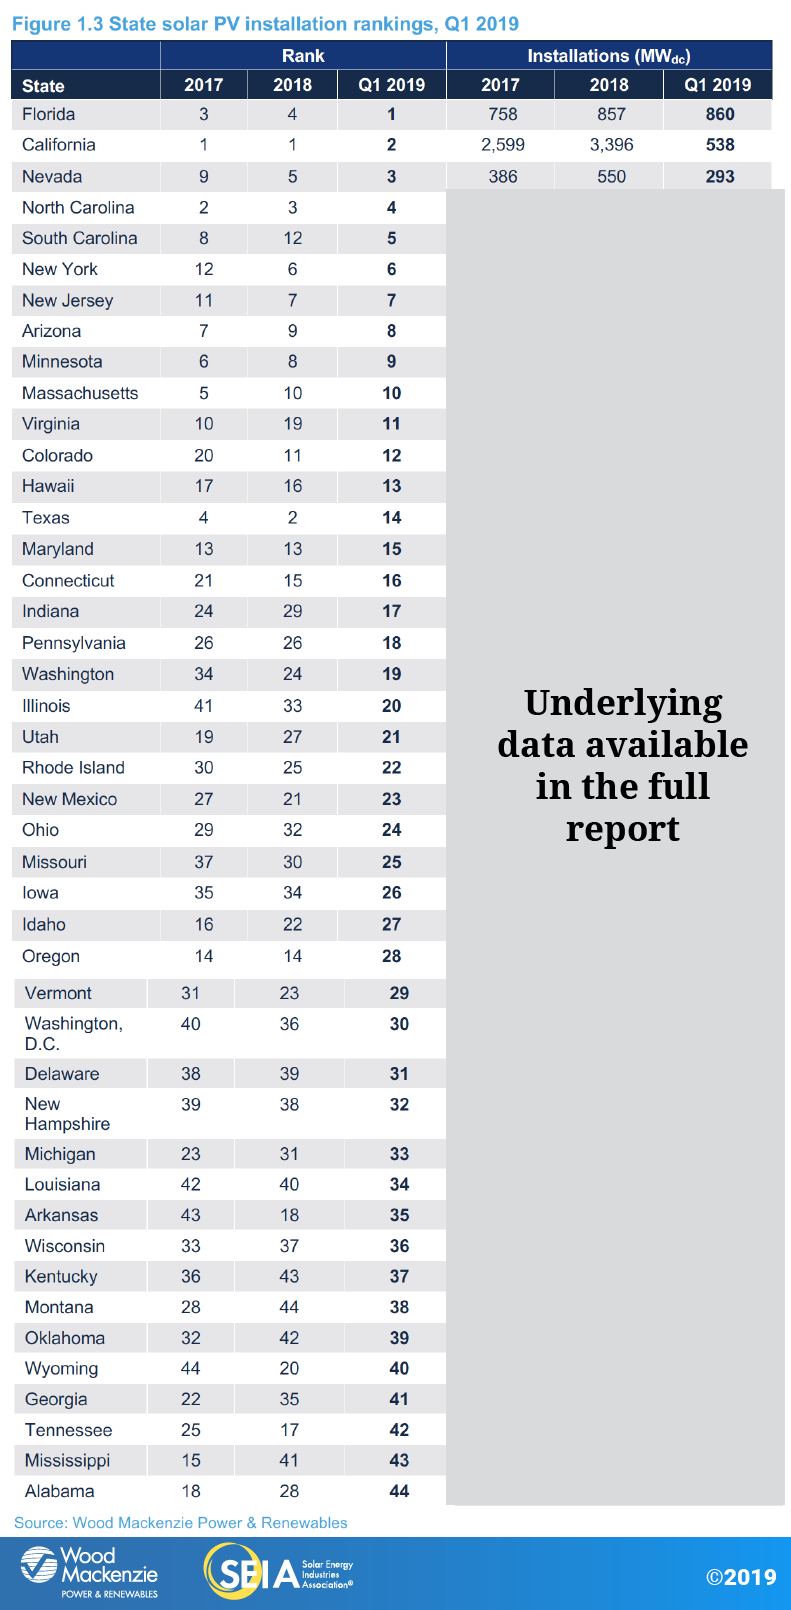
After a record 15.0 GWdc of U.S. utility solar was procured in 2018, new project announcements have slowed slightly in 2019 but levels still remain healthy. As of May 2019, 3.8 GW have been procured, pushing the contracted pipeline to 27.7 GW. The growth is primarily due to a 1.5 GWdc announcement from Florida Power & Light and 1.1 GWdc announced by Duke Energy in the Carolinas. Florida Power & Light’s development of its own solar projects makes up the bulk of Florida’s five-year forecast, with additional announcements from Duke Florida, Teco Energy and Jacksonville Electric expected to add to the pipeline in that state.
Voluntary procurement of utility PV based on its economic competitiveness continues to be the primary driver of projects announced in 2019. While many states, utilities and cities have announced or proposed 50% or 100% renewable energy or zero-carbon standards, the announcements have not yet resulted in an uptick in RPS-driven procurement. Corporate procurement of utility solar drove 22% of projects announced in 2018 and continues apace in 2019, with 14% of projects announced having a corporate offtaker. (Wood Mackenzie classifies large offsite projects with C&I offtakers as utility-scale rather than distributed due to the size and structure of the deals.) As the number of corporations pledging to use 100% renewable power continues to grow, corporate procurement is expected to remain a strong driver of utility PV.
2. Market Segment Outlooks
2.1. Residential PV
Key figures
- 603 MWdc installed in Q1 2019
- Down 8% from Q4 2018
- Up 6% from Q1 2018
Despite steady installations in Q1 2019, the residential market is still highly reliant on legacy state markets, such as California and the Northeast, which have seen only modest to flat growth over the past several quarters. As these major state markets continue to grow past early-adopter consumers, higher costs of customer acquisition will challenge the industry to innovate product offerings and diversify geographically. Indeed, 29% of residential capacity in Q1 2019 came from markets outside the top 10 (by cumulative capacity), the highest share for emerging markets in industry history.
From 2019-2021, residential growth will range from 5%-20% due to both emerging markets with strong resource fundamentals like Florida and Texas, and markets where recent policy developments have increased our near-term forecasts. Maryland’s recent renewable portfolio standard increase, the removal of South Carolina’s net metering cap, and new incentive programs such as Illinois’ Adjustable Block Program will provide significant upside and growth to our residential forecasts over the next few years. Meanwhile, California’s new home solar mandate will also help to offset market penetration challenges beginning in 2020.
In the long term, the ITC step-down is expected to pull in demand in both legacy and emerging markets before declining in 2022. Growth resumes in 2023 and continues into 2024 based on economic fundamentals as the market adjusts to post-ITC market conditions. That said, long-term growth in a post-ITC world will be contingent on geographic diversification outside of legacy state markets and technological/business-model innovation to improve product offerings in solar-plus-storage.
2.2. Non-residential PV
Key figures
- 438 MWdc installed in Q1 2019
- Down 28% from Q4 2018
- Down 18% from Q1 2018
Non-residential installation totals in Q1 2019 were the weakest since Q1 2017 as all three major state markets (California, Massachusetts and Minnesota) saw declining volumes due to state-level policy reforms and interconnection delays that continue to limit development opportunities. Overall, the non-residential PV market is on track for another down year as the segment acclimates to a reduced incentive environment across major state markets. However, this will be incrementally offset starting in 2020 as the next wave of states with robust community solar mandates – New York, Maryland, Illinois and New Jersey – experience growth.
Furthermore, recent policy developments in New York and Maryland will ultimately provide for growth in our long-term outlook. Significant revisions to the Value of Distributed Energy Resources (VDER) docket in New York have bolstered our long-term forecasts for both commercial and community solar, while an RPS increase in Maryland will boost the sagging SREC market to the benefit of the entire non-residential segment.
Increasing solar-plus-storage viability will also begin to have an impact on non-residential demand as policymakers and business leaders increasingly consider energy storage in their decisions. New York’s recent development of the Bridge Incentive increases our long-term solar-plus-storage forecasts with further potential upside. By 2023, roughly 30% of total non-residential PV will come from community solar, and ~20% will come from solar-plus-storage projects.
2.3. Utility PV
Key figures
- 1,633 MWdc installed in Q1 2019
- Utility PV pipeline currently totals 27.7 GWdc
The U.S. utility solar forecast for 2019-2024 has grown by 5.1 GWdc since last quarter. The largest contributor is an increase to Florida’s five-year outlook from 6.0 GWdc to 9.0 GWdc due to new solar procurement by Florida Power & Light (FPL), Duke Energy Florida, and other Florida utilities (most of which is utility self-build). This positions Florida to be the top state for utility PV over the next six years.
Since last quarter, the 2019 forecast has grown by 1.2 GW, due largely to late project announcements in Texas that raised the state’s forecast by 720 MWdc. While the forecast for 2020 saw little change to overall expected capacity additions, over 10.0 GWdc of utility PV are still expected to come online that year. From 2021-2023, our utility PV forecast has increased by 2.8 GWdc. While the bulk of this increase is found in Florida, there are a growing number of utilities such as Xcel Energy, Idaho Power and PacifiCorp, among others, announcing additional solar procurement, expedited coal plant retirement, or plans to achieve 50% to 100% renewable or carbon-free energy targets, all of which have boosted the midterm forecast.
During this time, utility PV also becomes increasingly competitive with wind. As the wind-focused federal Production Tax Credit steps down, solar begins to fall below the cost of wind on a levelized cost of energy (LCOE) basis in many traditional wind states such as Illinois, Iowa, Kansas, Michigan and the Dakotas by the mid-2020s. (Wood Mackenzie’s LCOE calculations for solar take the ITC incentive into account.) This is likely not only to drive more solar procurement in wind-dominant regions of Midcontinent Independent System Operator and Southwest Power Pool, but also to make solar the preferred renewable technology for corporate offtakers. Oklahoma Gas & Electric’s recent RFP for solar-plus-storage is the first example of what is likely to be a trend in solar procurement in the Prairies and Midwest.
Our 2024 forecast has also increased by 1.1 GWdc. Many utilities such as Dominion, Tennessee Valley Authority and FPL have outlined solar procurement plans for 2024 and beyond. Despite the ITC having fully stepped down to 10% by that time, utility PV will remain economically competitive with new-build wind and natural gas in many places.
3. National Solar PV System Pricing
We employ a bottom-up modeling methodology to track and report national average PV system pricing for the major market segments. This methodology is based on tracked wholesale pricing of major solar components and data collected from interviews with major installers.
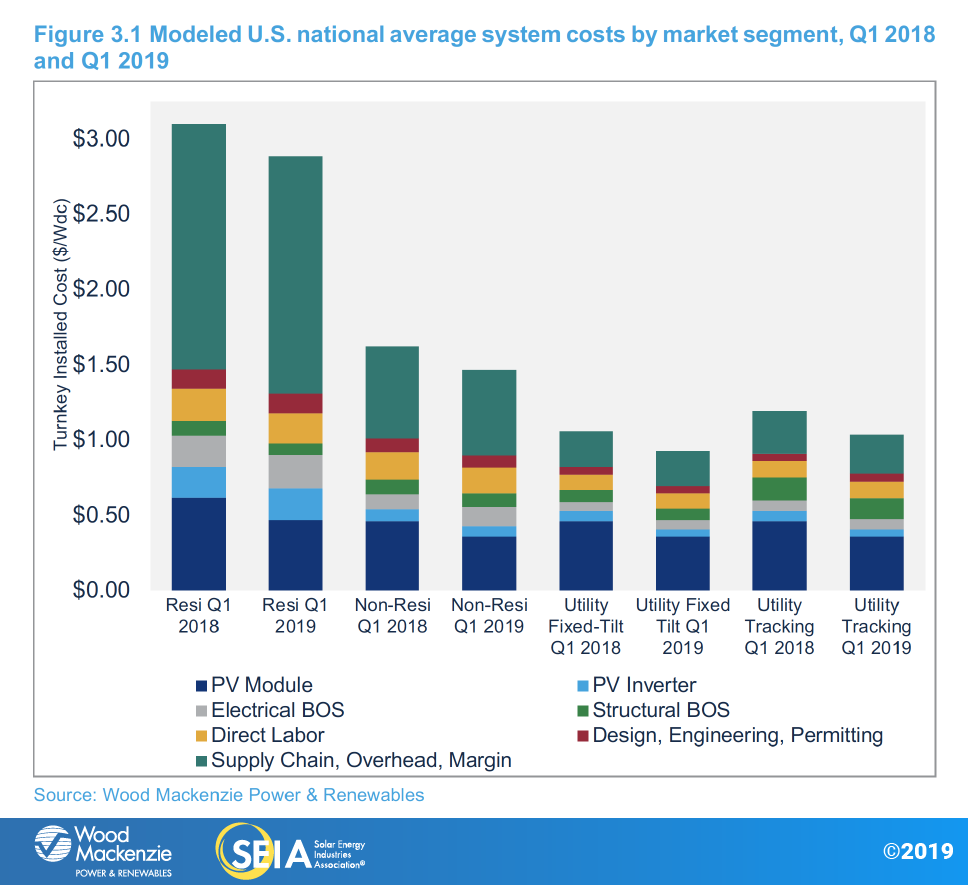
In Q1 2019, system pricing fell in all market segments. System pricing fell by 3.0%, 2.7%, 0.1% and 0.1% in the residential, non-residential, utility fixed-tilt and utility single-axis tracking markets, respectively. Prices across market segments are now all at historic lows despite tariffs on modules, inverters, aluminum and steel: $2.89/Wdc, $1.47/Wdc, $0.93/Wdc and $1.04/Wdc for residential, non-residential, utility fixed-tilt and utility single-axis tracking systems, respectively. Year-over-year system pricing fell by 6.8%, 9.8%, 12.6% and 12.9% in the residential, non-residential, utility fixed-tilt and utility single-axis tracking markets, respectively.
4. Component Pricing
- Starting Q1 2019, the U.S. solar market insight report series is expanding its coverage to include pricing information on mono wafer, mono cells and mono modules, in addition to their multi counterparts. Among all components, only polysilicon prices declined in Q1 2019. Wafers, multi cells and multi modules saw no change in spot prices. Mono cell and mono module prices increased by $0.01 in Q1 2019 from Q4 2018. Strong market demand and tight supply, especially for high-quality mono products, drove the price trends. Details can be found in Figure 4.1 below.
- In the U.S., multi module prices did not change between Q4 2018 and Q1 2019. Mono PERC module prices fell only slightly from the Q4 2018 level to $0.40/W in Q1 2019, reflecting the tightening module supply in the U.S. market.
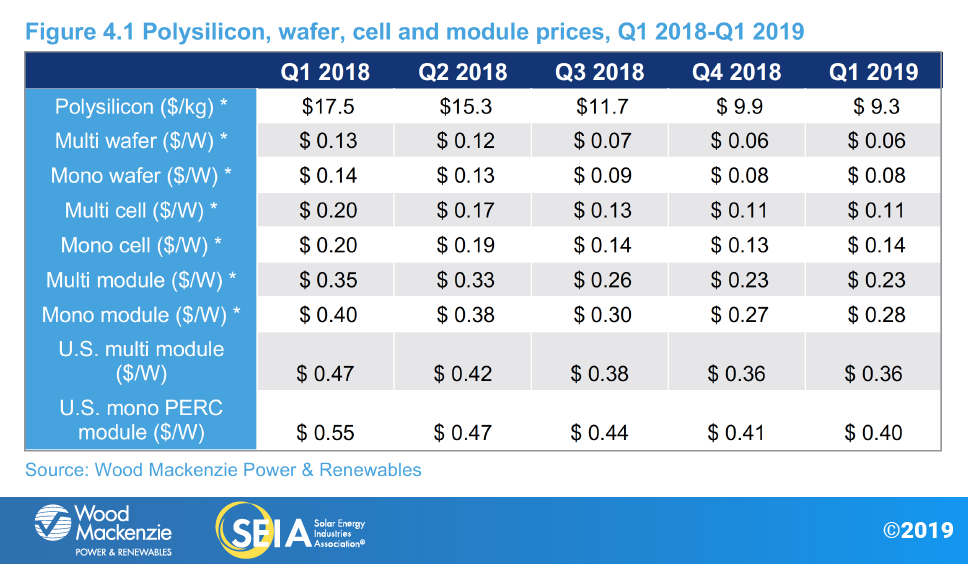
*Global spot prices
About the Report
U.S. solar market insight® is a quarterly publication of Wood Mackenzie Power & Renewables, Inc. d/b/a Greentech Media and the Solar Energy Industries Association (SEIA)®. Each quarter, we collect granular data on the U.S. solar market from nearly 200 utilities, state agencies, installers and manufacturers. This data provides the backbone of this U.S. solar market insight® report, in which we identify and analyze trends in U.S. solar demand, manufacturing and pricing by state and market segment. We also use this analysis to look forward and forecast demand over the next five years. All forecasts are from Wood Mackenzie, Limited; SEIA does not predict future pricing, bid terms, costs, deployment or supply.
- References, data, charts and analysis from this executive summary should be attributed to “Wood Mackenzie/SEIA U.S. solar market insight®.”
- Media inquiries should be directed to Wood Mackenzie’s PR team ([email protected]) and Morgan Lyons ([email protected]) at SEIA.
- All figures are sourced from Wood Mackenzie. For more detail on methodology and sources, click here.
- Wood Mackenzie Power and Renewables (WM P&R) partners with Clean Power Research to acquire project-level datasets from participating utilities that utilize the PowerClerk product platform. For more information on Clean Power Research’s product offerings, visit https://www.cleanpower.com/
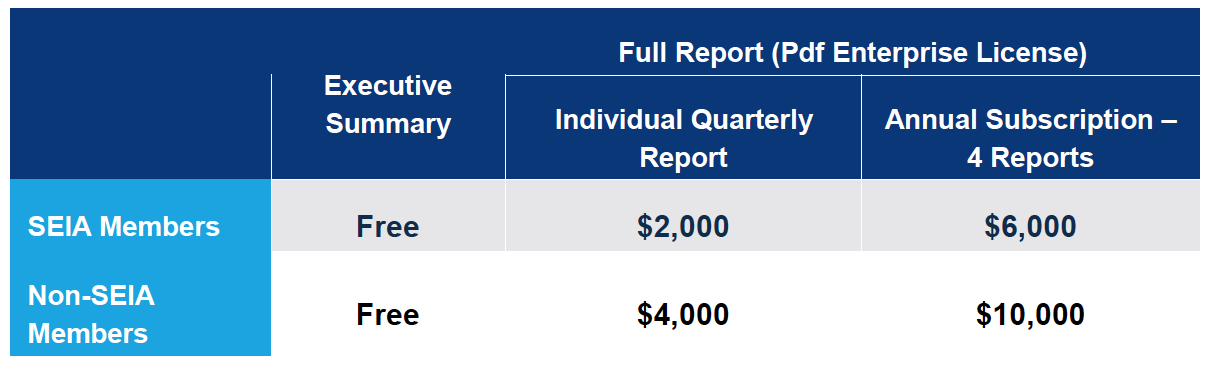
Our coverage in these reports includes 43 individual states and Washington, D.C. However, the national totals reported include all 50 states, Washington, D.C. and Puerto Rico. The U.S. solar market insight® is offered in two versions – the Executive Summary and the Full Report. The Executive Summary is free, and the Full Report is available individually each quarter or as part of an annual subscription. Detailed data and forecasts by state are available in the Full Report. To find out more, click here.
Note on U.S. solar market insight report title: WM P&R and SEIA have changed the naming convention for the U.S. solar market insight report series. Starting with the report released in June 2016 onward, the report title will reference the quarter in which the report is released, as opposed to the most recent quarter in which installation figures are tracked. The exception will be our year in review publication, which covers the preceding year’s installation volumes despite being released during the first quarter of the current year.
About the Authors
Wood Mackenzie Power & Renewables | U.S. Research Team
Austin Perea, Senior Solar Analyst (lead author)
Colin Smith, Senior Solar Analyst
Michelle Davis, Senior Solar Analyst
Allison Mond, Senior Solar Analyst
Benjamin Gallagher, Senior Solar Analyst
Lindsay Cherry, Solar Analyst
Xiaojing Sun, Senior Solar Analyst
Solar Energy Industries Association | SEIA
Shawn Rumery, Director of Research
Aaron Holm, Data Engineer
Rachel Goldstein, Research Analyst
Justin Baca, Vice President of Markets & Research

