Solar Market Insight Report 2017 Year in Review
Other Links: Purchase the full report | Press Release |
Key Figures
- In 2017, the U.S. market installed 10.6 GWdc of solar PV, a 30% decrease year-over-year from 2016.
- In 2017, 30% of all new electric generating capacity brought online in the U.S. came from solar, ranking second during that period only to natural gas.
- Q4 2017 saw price increases in most PV market segments stemming from increases in module costs. This was due to a global shortage of Tier 1 module supply and the uncertainty spurred by the Section 201 petition. However, the price increases were mitigated by falling prices in racking and inverters, improving operating efficiencies, and likely margin compression.
- The residential PV sector fell 16% from 2016. This contraction was driven by weakness in California and major Northeast markets, which continue to feel the impact of pullback from certain national installers that have shifted away from rapid-expansion strategies.
- In contrast to residential PV, the non-residential sector grew 28% year-over-year, primarily driven by regulatory demand pull-in from looming policy deadlines in California and the Northeast, in addition to the continued build-out of a robust community solar pipeline in Minnesota.
- Voluntary procurement, rather than state-mandated Renewable Portfolio Standards, will continue to be the primary driver of new utility PV demand, anticipated to drive 1/3 of utility build-out in 2018.
- GTM Research forecasts slight growth in 2018 from 2017, with another 10.6 GWdc of new PV installations expected.
- In response to the impact of Section 201 and corporate tax reform, GTM Research has reduced its total U.S. solar PV forecasts by 13% from 2018E-2022E since the last edition of this report.
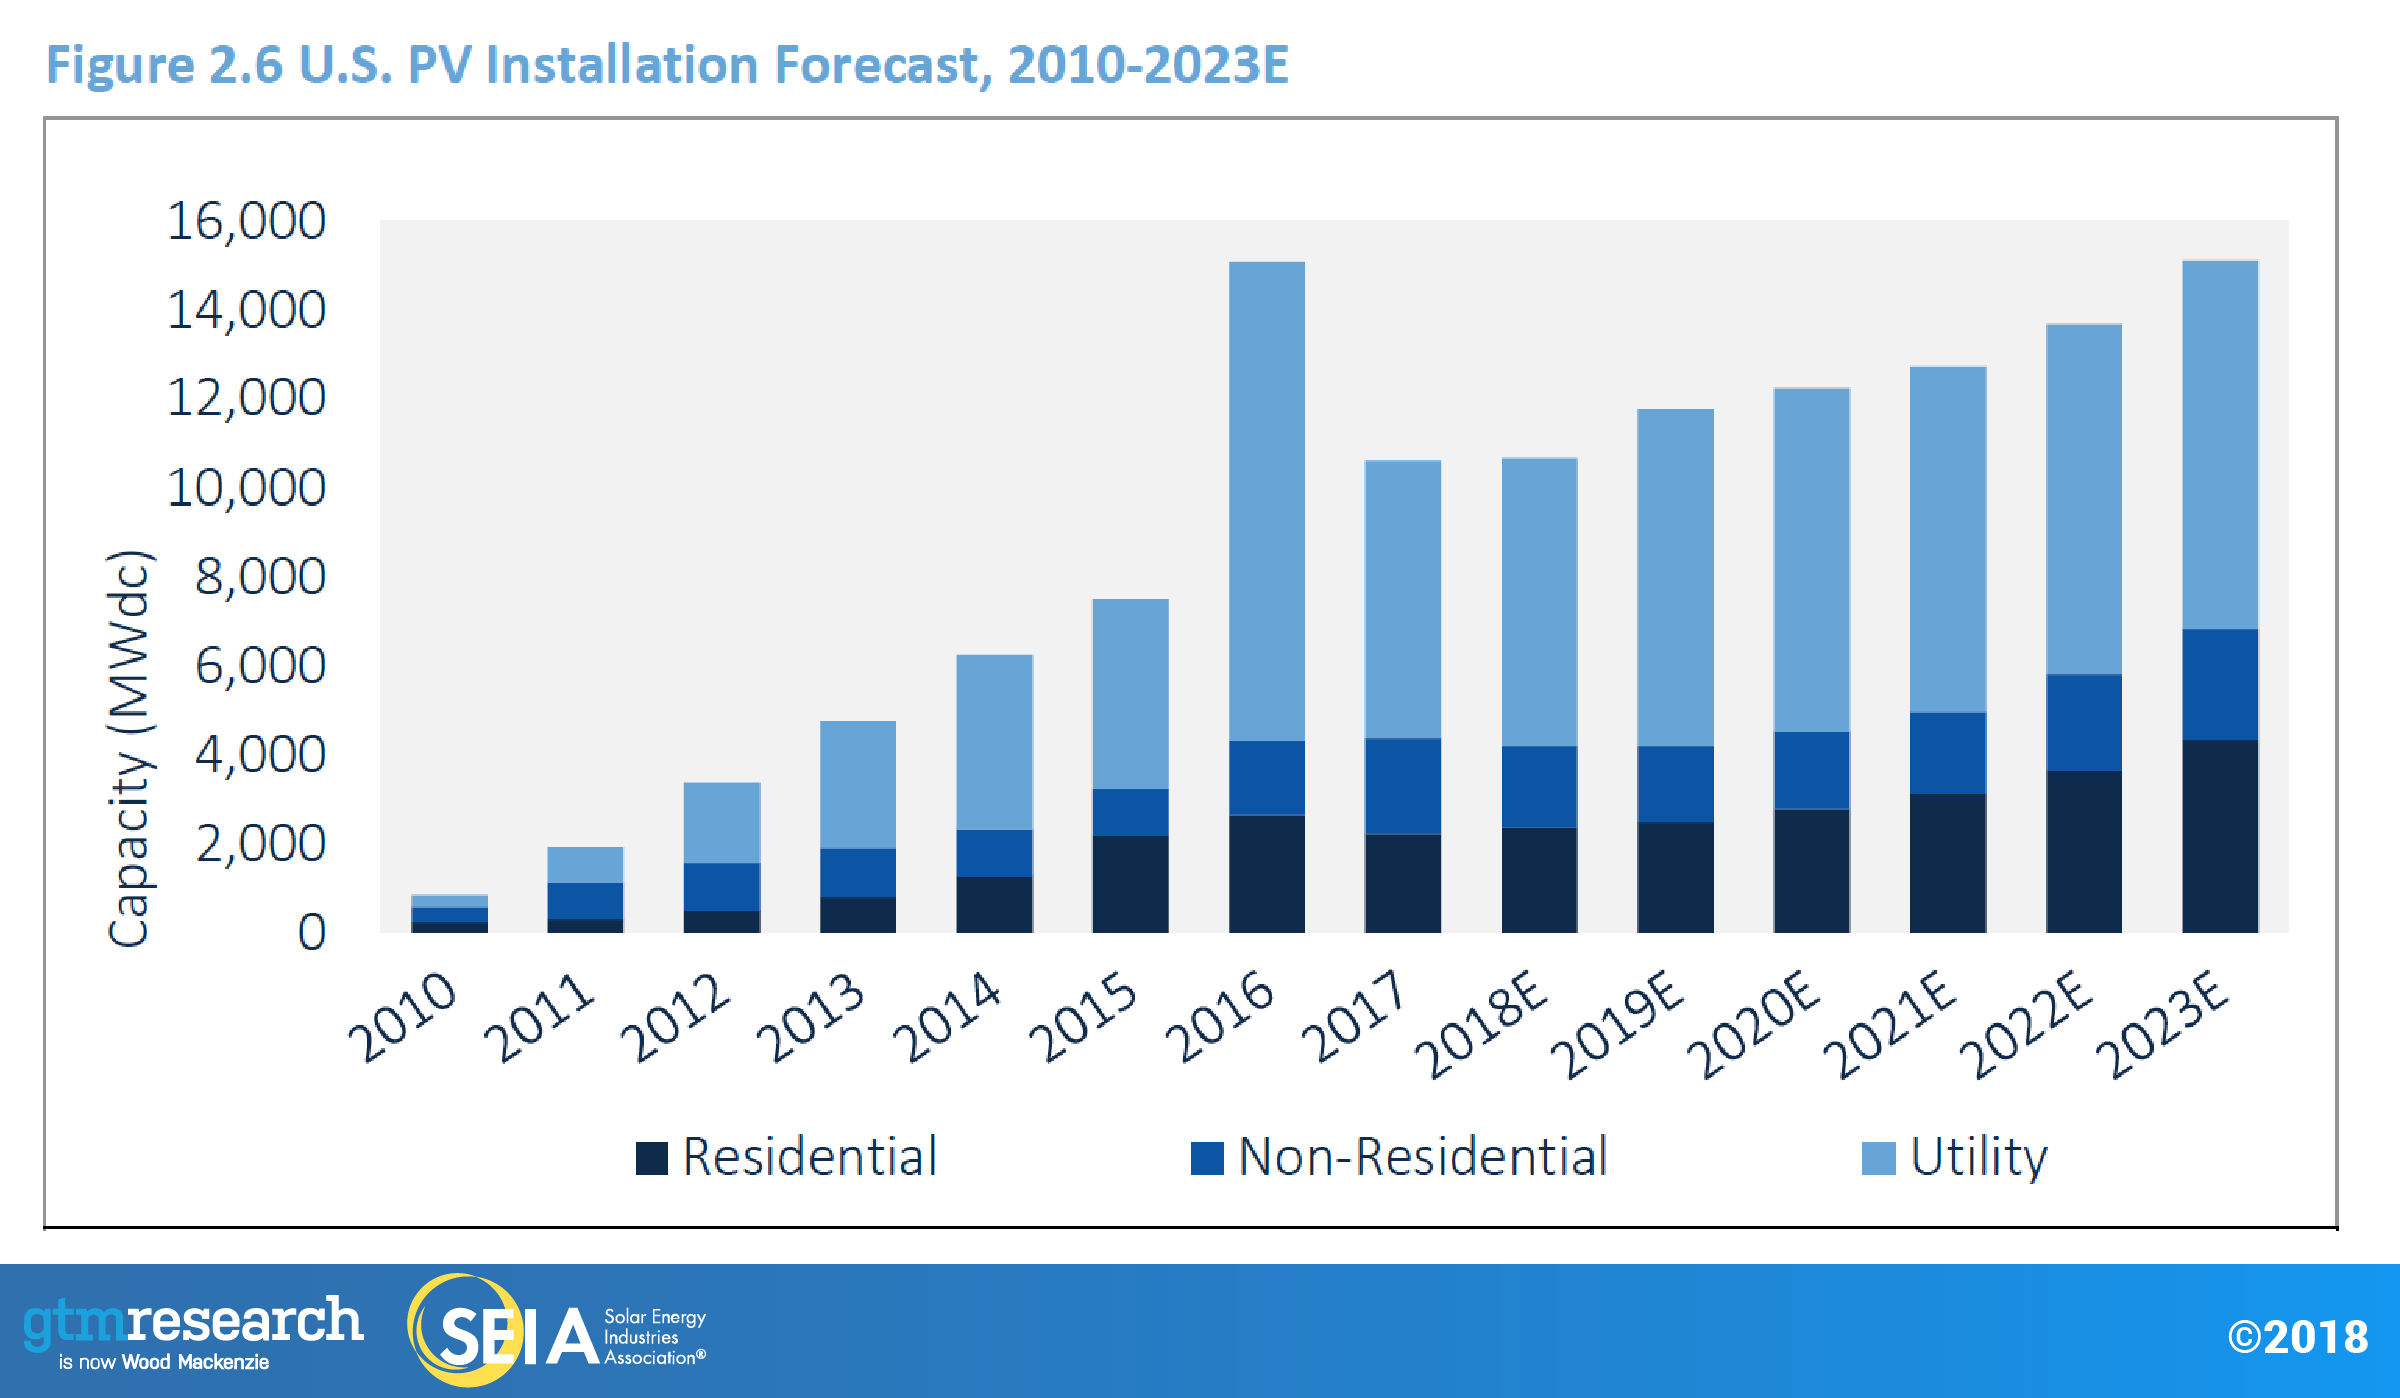
- Total installed U.S. PV capacity is expected to more than double over the next five years, and by 2023, over 15 GW of PV capacity will be installed annually.
1. Introduction
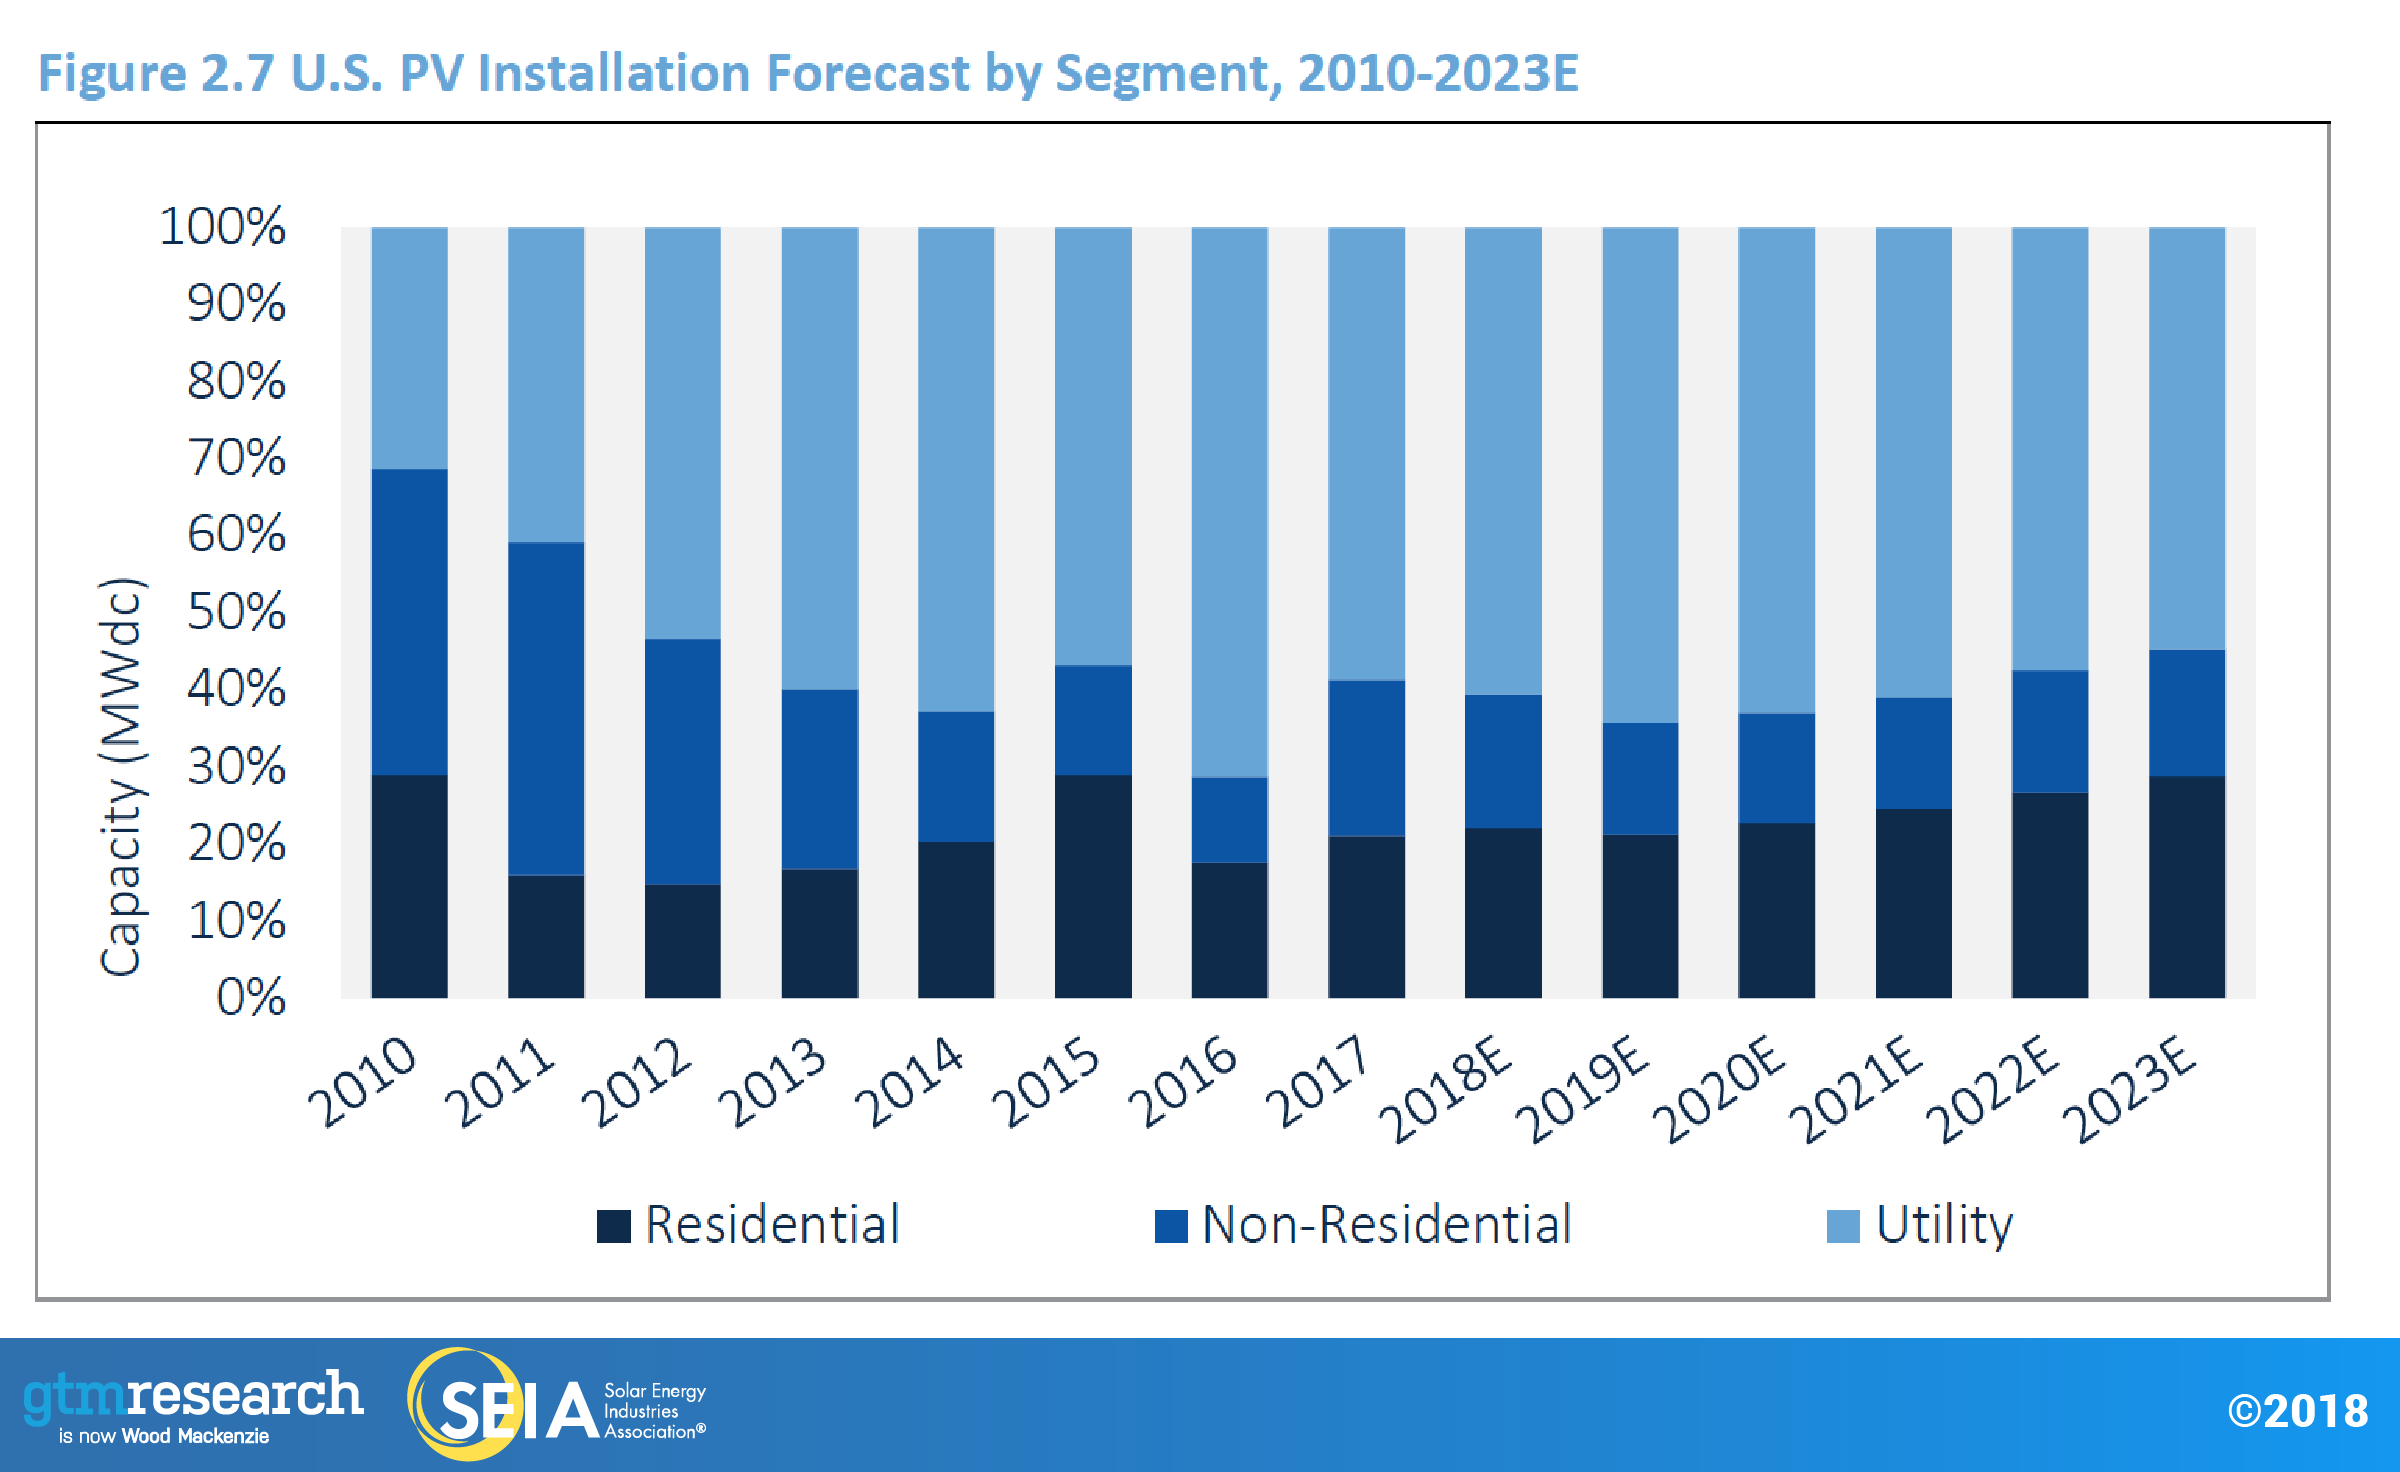
In 2017, the U.S. solar market installed 10.6 gigawatts direct current (GWdc) of solar photovoltaic (PV) capacity. Despite installing 30% less solar than what was installed in a unique and record-breaking 2016 that coincided with the year the federal Investment Tax Credit (ITC) had been set to expire, the market still exceeded 2015 levels by 40%. In line with previous years, 59% of the installed capacity came from the utility PV segment, while distributed solar accounted for 41% of installations.
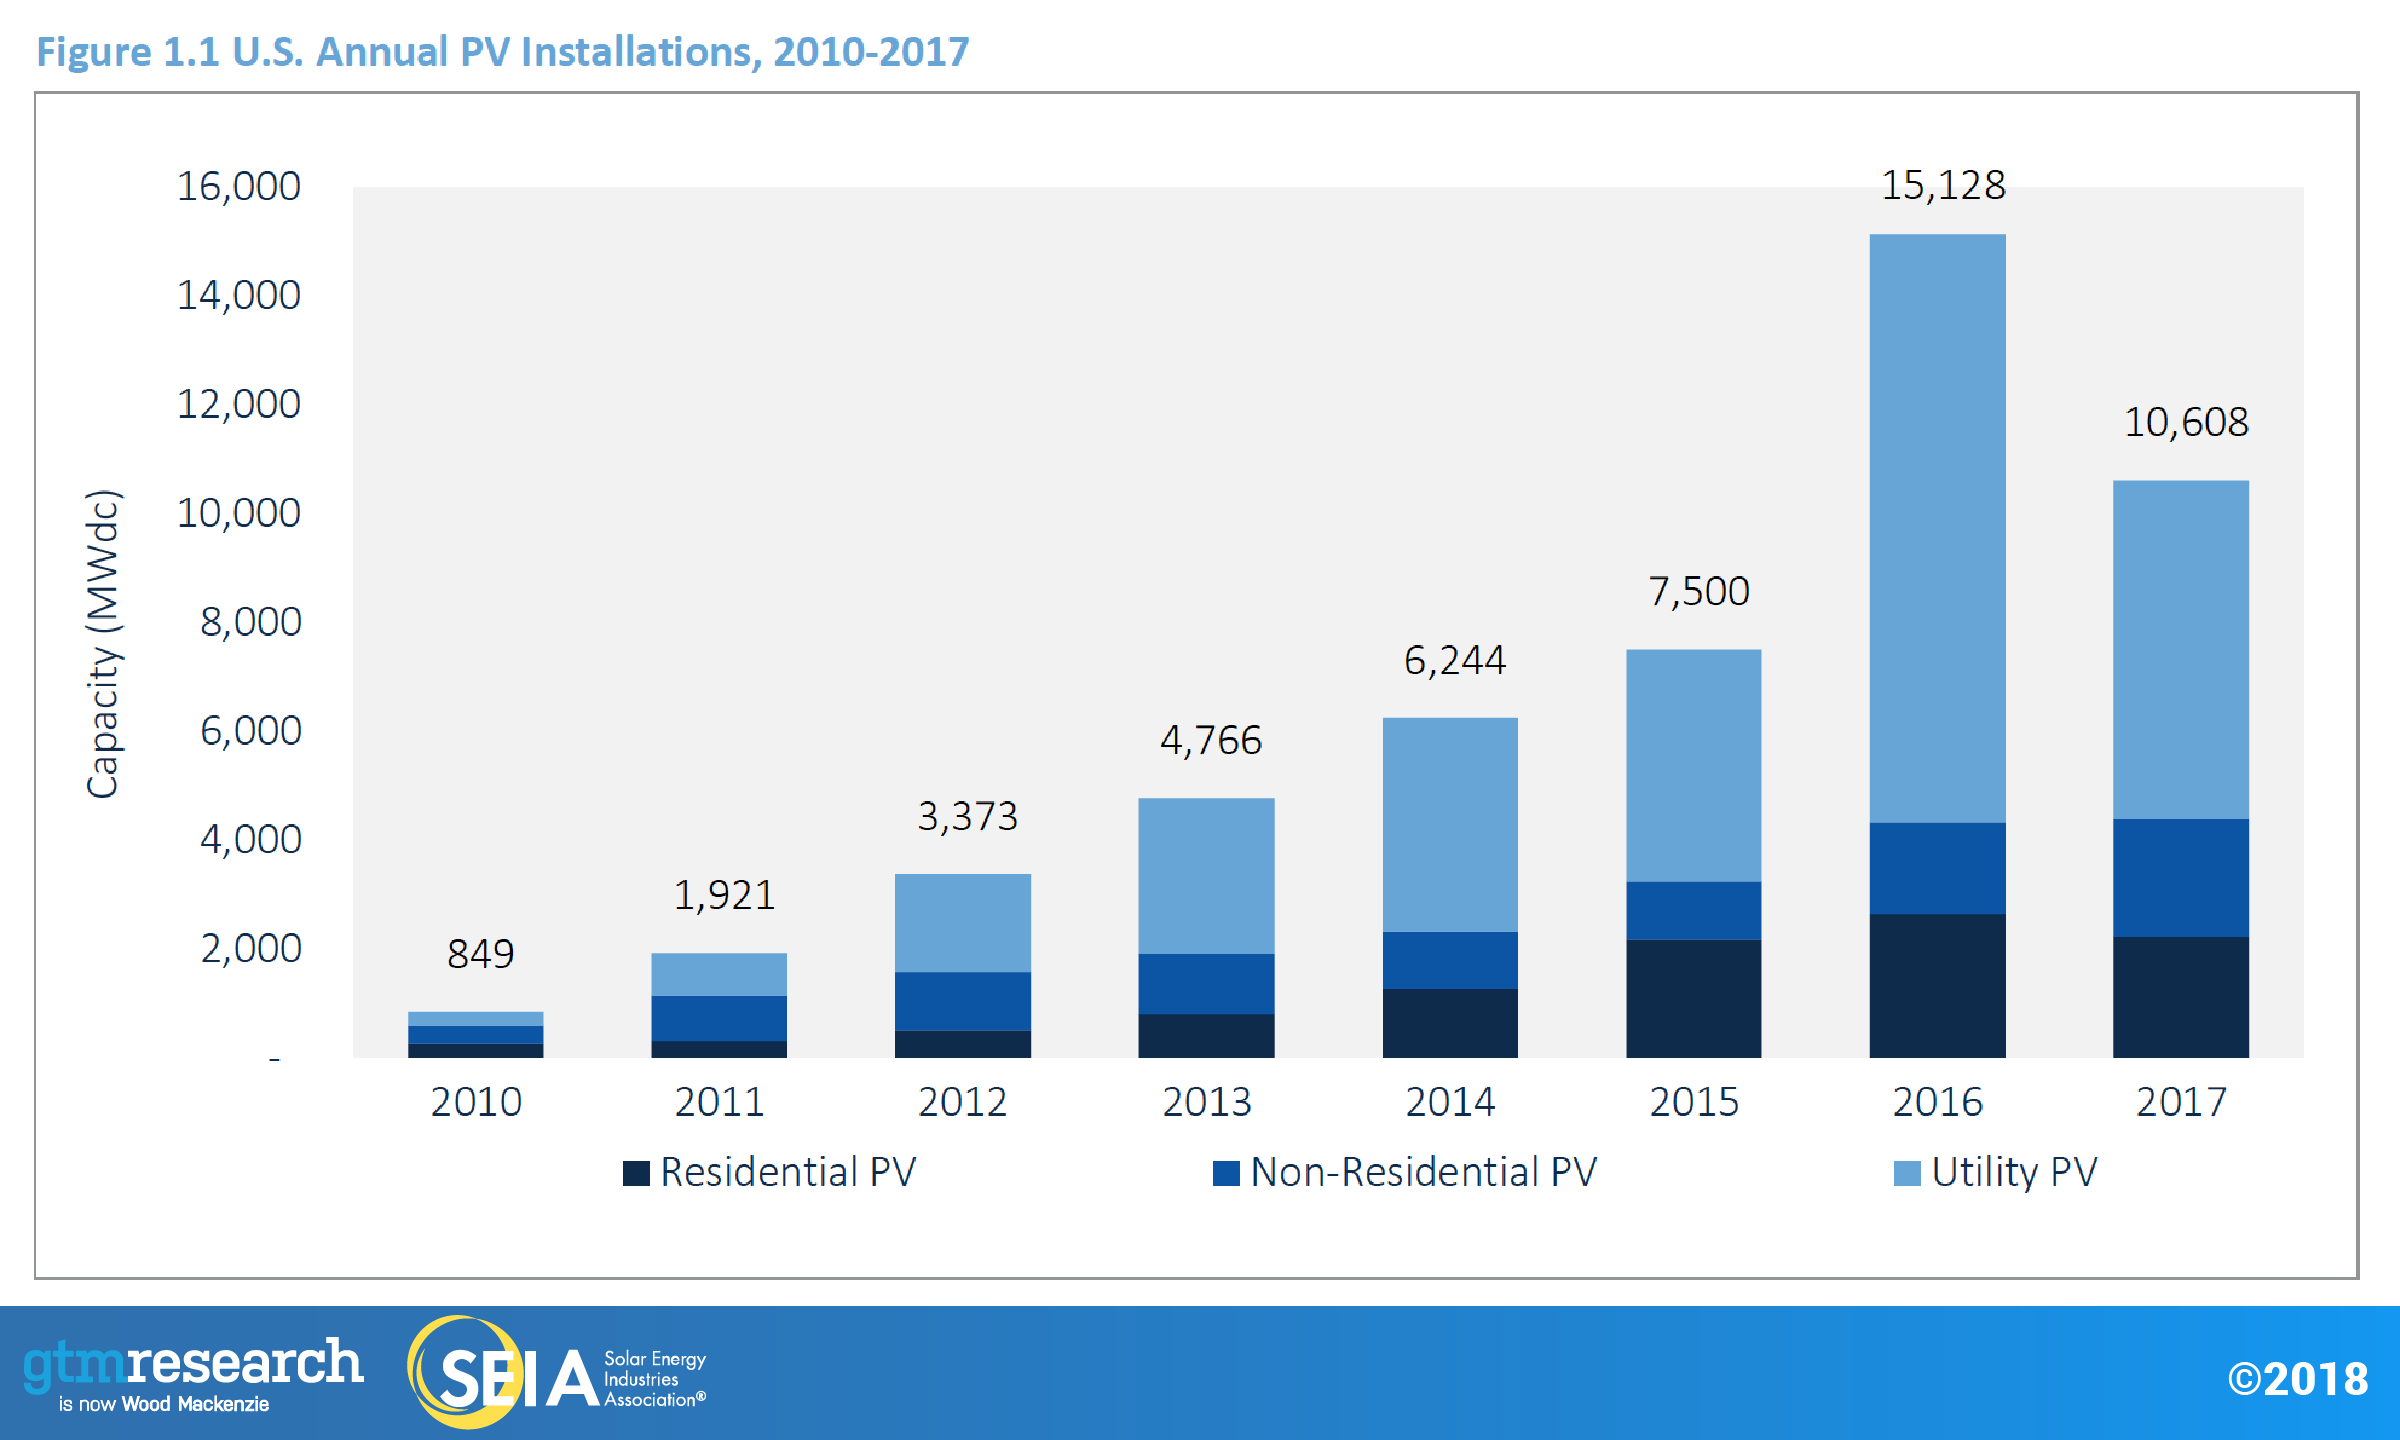
2017 bucked many historical trends in what proved to be a transitional year for the solar market. All segments experienced role reversal, as residential and utility PV – long the growth segments of the solar market – both saw installations fall on an annual basis for the first time since the first edition of Solar Market Insight in 2010, marking a “reset” year for both segments. Meanwhile, the long-beleaguered non-residential PV segment was the only market to experience growth in 2017.
For residential PV, the downturn in 2017 stems from segment-wide customer acquisition challenges that are constraining growth across most major state markets. Amidst other variables such as NEM reform, loss of state incentives, and competitive landscape trends, we are also monitoring the relationship between increasing customer penetration and low installation growth as the pool of attractive early-adopter customers grows increasingly thin in certain markets. While the relationship between market penetration and growth does not fully explain the market downturn, GTM Research believes it is increasingly becoming a factor in constraining growth amongst major state markets
Meanwhile, the year-over-year downturn for utility PV in 2017 was largely expected, due to the massive influx of projects trying to leverage the 30% federal Investment Tax Credit (ITC) in 2016. However, uncertainty surrounding the Section 201 tariffs caused many projects to be shelved this year, while PURPA project cancellation and interconnection delays resulted in many projects spilling over into 2018.
Finally, both closing regulatory windows and the realization of a robust community-solar pipeline drove substantial growth in non-residential solar in 2017. This is the second consecutive year for such growth after the space essentially remained flat from 2012-2015.
1.1 Federal Policy Spotlight: Section 201 and Corporate Tax Reform
Federal policy reared its head not once, but twice, via corporate tax reform and the prospect of Section 201 tariffs (finally announced January 22, 2018). Together, these two major federal policy developments will have long-lasting implications for the market and our base-case outlook.
Section 201 Tariffs
On January 22, President Trump announced a 30% ad valorem year-one tariff on imported c-Si cells and modules. These tariffs will decline 5 percentage points per year for a period of four years, resulting in a 15% tariff in 2021, after which the tariff will expire unless extended by the president. Based on current pricing trends, the 30% tariffs result in a roughly $0.10/W increase in year 1 module prices.
The decision on loose cell imports functions as a tariff rate quota, with the first 2.5 gigawatts of imported crystalline-silicon (c-Si) cells excluded from the tariff in each of the four years. This mechanism is designed to allow domestic module manufacturers without cell manufacturing capacity to continue importing inexpensive cells for module manufacturing purposes. Additionally, the Trump administration excluded nearly all Generalized System of Preferences beneficiary countries, except for Thailand and the Philippines. Any excluded GSP beneficiary country will be subject to the tariff if it exceeds 3% of total imports of c-Si PV products, or all excluded GSP countries will become subject to the tariff if they collectively account for more than 9% of imports.
When accounting for additional changes to the state policy landscape, utility procurement plans, and the competitive landscape, GTM Research’s updated base-case forecast between 2018 and 2022 is now 13% lower than what was projected in the last edition of the U.S. Solar Market Insight report.
Corporate Tax Reform
The Tax Cuts and Jobs Act of 2017 introduces a handful of changes to tax law that will have varying implications for the solar industry. Of the multitude of changes made to the tax code, the most impactful provisions to solar are:
- Corporate Tax Rate Reduction: At its core, the law lowers the top corporate tax rate from 35% to 21%. In theory, this could reduce the availability of tax equity financing given that overall corporate tax liability will be lower. However, elimination of the corporate alternative minimum tax could offset some of this reduction. While there are no public announcements of major banks exiting the solar tax equity market altogether, a couple of possible outcomes are that tax equity investors will account for a smaller share of the capital stack or require additional cash returns. If tax equity pricing goes up, one additional possible outcome is downward pressure on solar asset owners’ returns, given that they or lenders will have to take on a higher share of the capital stack. Another impact of the lower tax rate is a decrease in the effective value of depreciation. Depending on the degree to which investors elect for 100% expensing (see below), this could be somewhat offset by the time-value effects.
- Base Erosion Anti-Abuse Tax: The BEAT provision effectively puts in place a new corporate minimum tax if a company’s income tax liability falls below 11% of its U.S. income, when adjusted for tax credits and certain cross-border payments not previously counted as income. This provision could diminish the supply of tax equity from investors with high levels of offshore income who are at risk of falling short of the 11% minimum tax threshold. However, 80% of the solar Investment Tax Credit is excluded from determining the tax liability under the BEAT provision, which means 20% of the ITC is at risk of being lost if an investor is noncompliant with BEAT. To date, our survey of tax equity providers and legal teams suggests that the BEAT provision only affects a limited number of tax equity investors and corporates with significant cross-border payments.
- 100% Bonus Depreciation: Beginning in 2019 (and potentially in 2018), investors will have the option to take 100% bonus depreciation – a change from the optional 50% bonus deprecation schedule in effect before the tax legislation passed. Though relatively few investors took advantage of 50% bonus depreciation, it’s unclear whether investors will opt in or out of full bonus depreciation in 2018 for two reasons. First, the law does not specify whether projects put into service in 2018 are actually eligible to elect out of 100% bonus depreciation, and second, tax equity investors’ risk appetite for taking on full bonus depreciation in the lower tax rate environment is untested and thus has yet to be determined.
To be clear, there are a number of changes to corporate tax law that are likely to have implications for the market that have not been elucidated here. For instance, lower tax rates also mean that business and utilities have more expendable income to divert toward capital investment. However, we’ve highlighted the most relevant aspects into which we currently have visibility.
2. Photovoltaics
2.1 Market Segment Trends
2.1.1 Residential PV
Key Figures
- 2,227 MWdc installed in 2017
- Down 16% from 2016
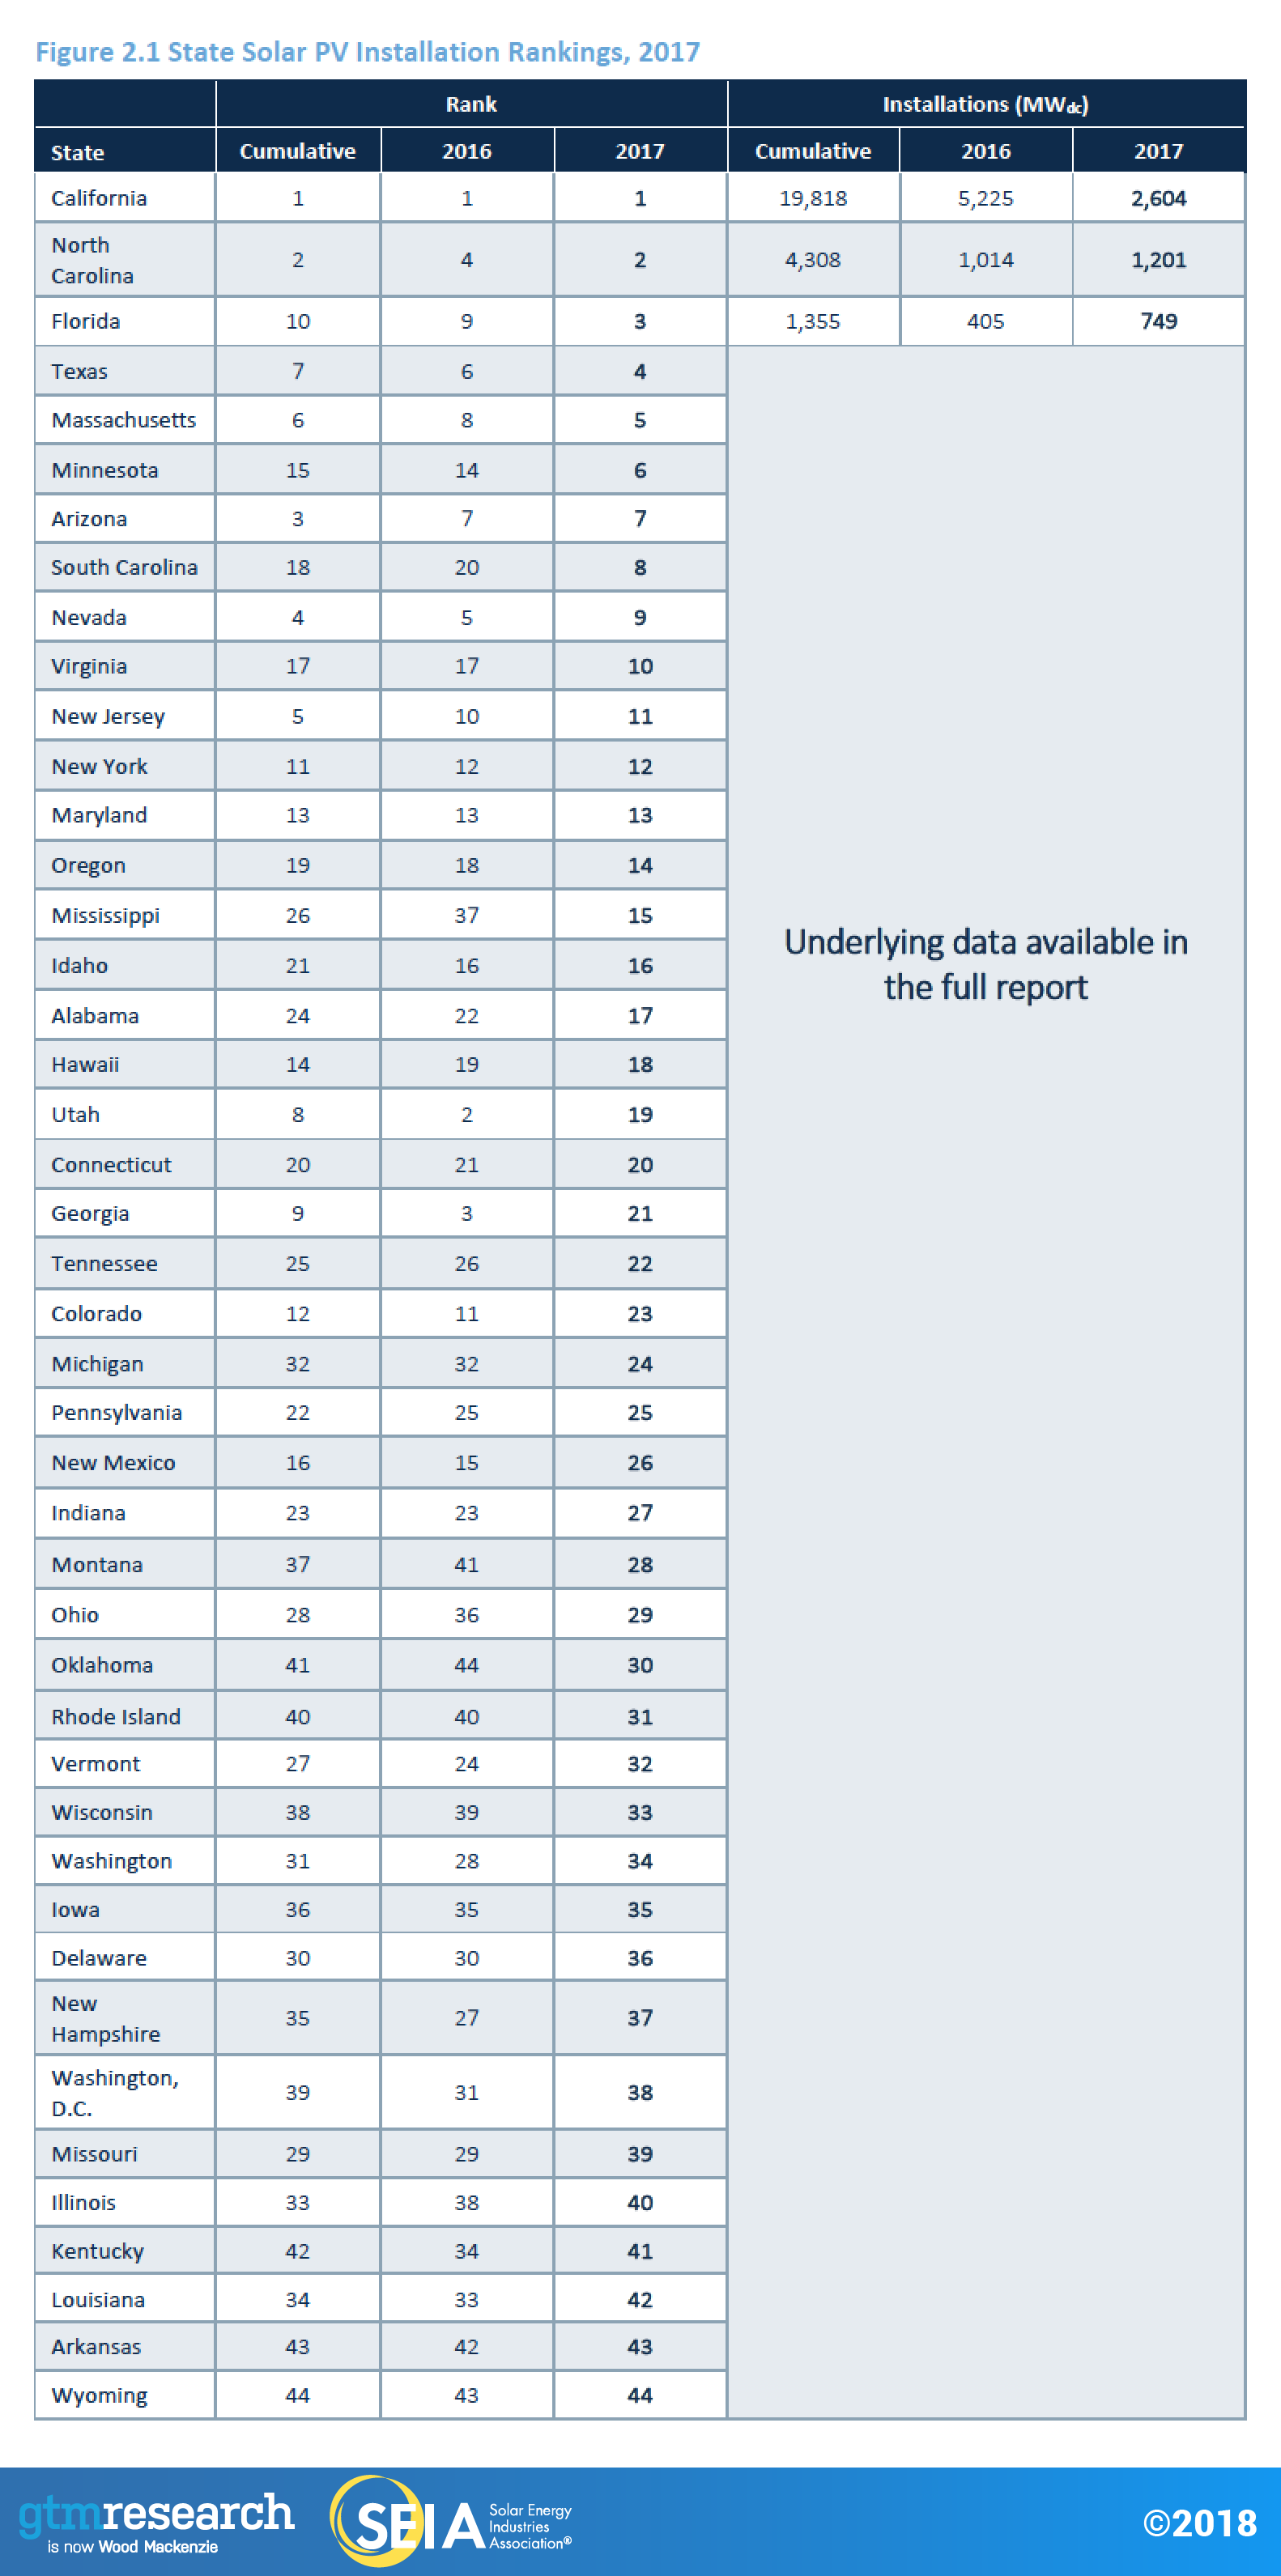
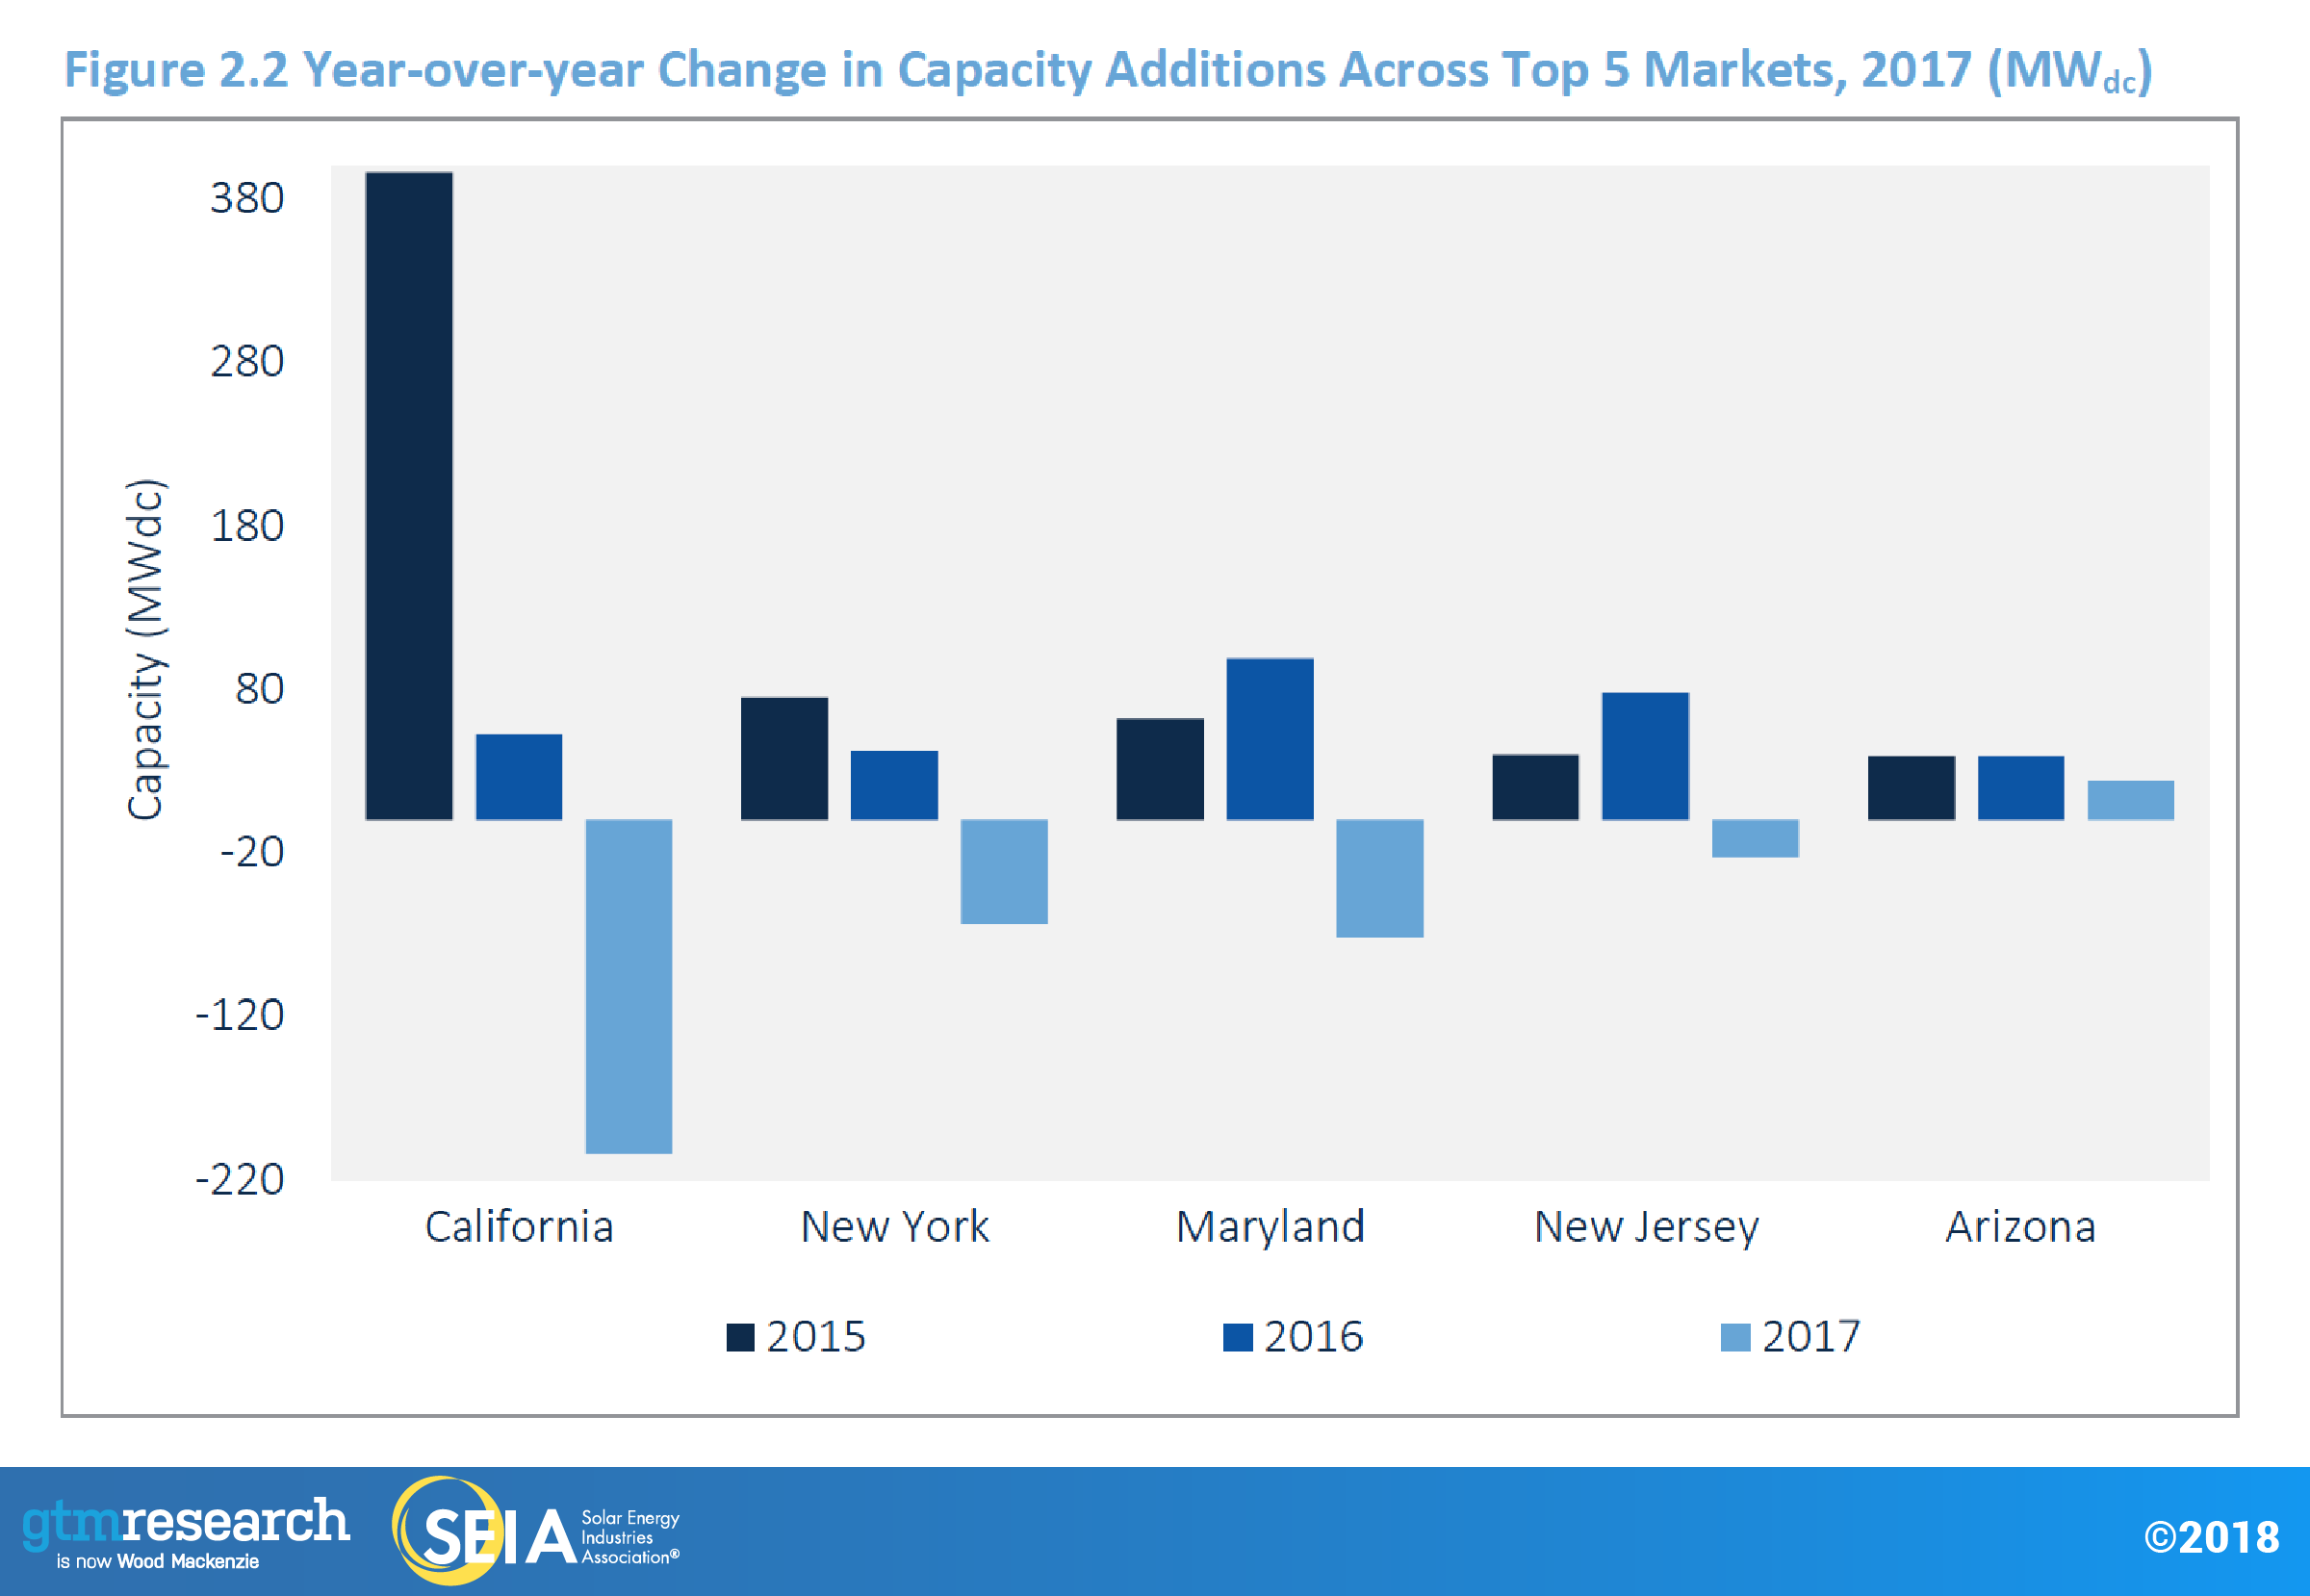
For the first time since this report series began in 2010, residential PV saw a year-over-year contraction. The downturn was primarily driven by weakness in established state markets; persistent customer-acquisition challenges and changes in business strategy among some top national installers also hampered growth. California, which has held at least a 40% share of the residential market since 2010, saw year-over-year losses that accounted for half of the national decline relative to 2016. Meanwhile, all major Northeast markets experienced annual contractions. Arizona was only one of two top 10 state markets that added residential installations compared to 2016, though this was primarily a function of regulatory demand pull-in as the state transitions to a lower export credit for solar. However, the segment continues to diversify, with the market share of states outside of the top 10 increasing from 16% in 2016 to 21% in 2017. Nonetheless, this was not enough to offset major market decline; on net the top 10 states added ~475 MW less than in 2016.
2.1.2 Non-Residential PV
Key Figures
- 2,147 MWdc installed in 2017
- Up 28% from 2016
Regulatory demand pull-in and community solar were the primary market movers in 2017. Together, these factors contributed to non-residential PV being the only market segment to experience annual growth. California benefited from developers rushing to install projects to meet a (since-lifted) end-of-the-year deadline to be grandfathered into more favorable, solar-friendly time-of-use periods. In the Northeast, developers in Massachusetts rushed to get projects installed under the SREC-II program while New York saw record-breaking installations as developers likewise rushed to install projects to maintain eligibility for remote net metering. Meanwhile, the build-out of the Xcel Energy’s robust community solar pipeline vaulted Minnesota to become the third-largest non-residential market in 2017.
2.1.2 Utility PV
Key Figures
- 6,234 MWdc installed in 2017
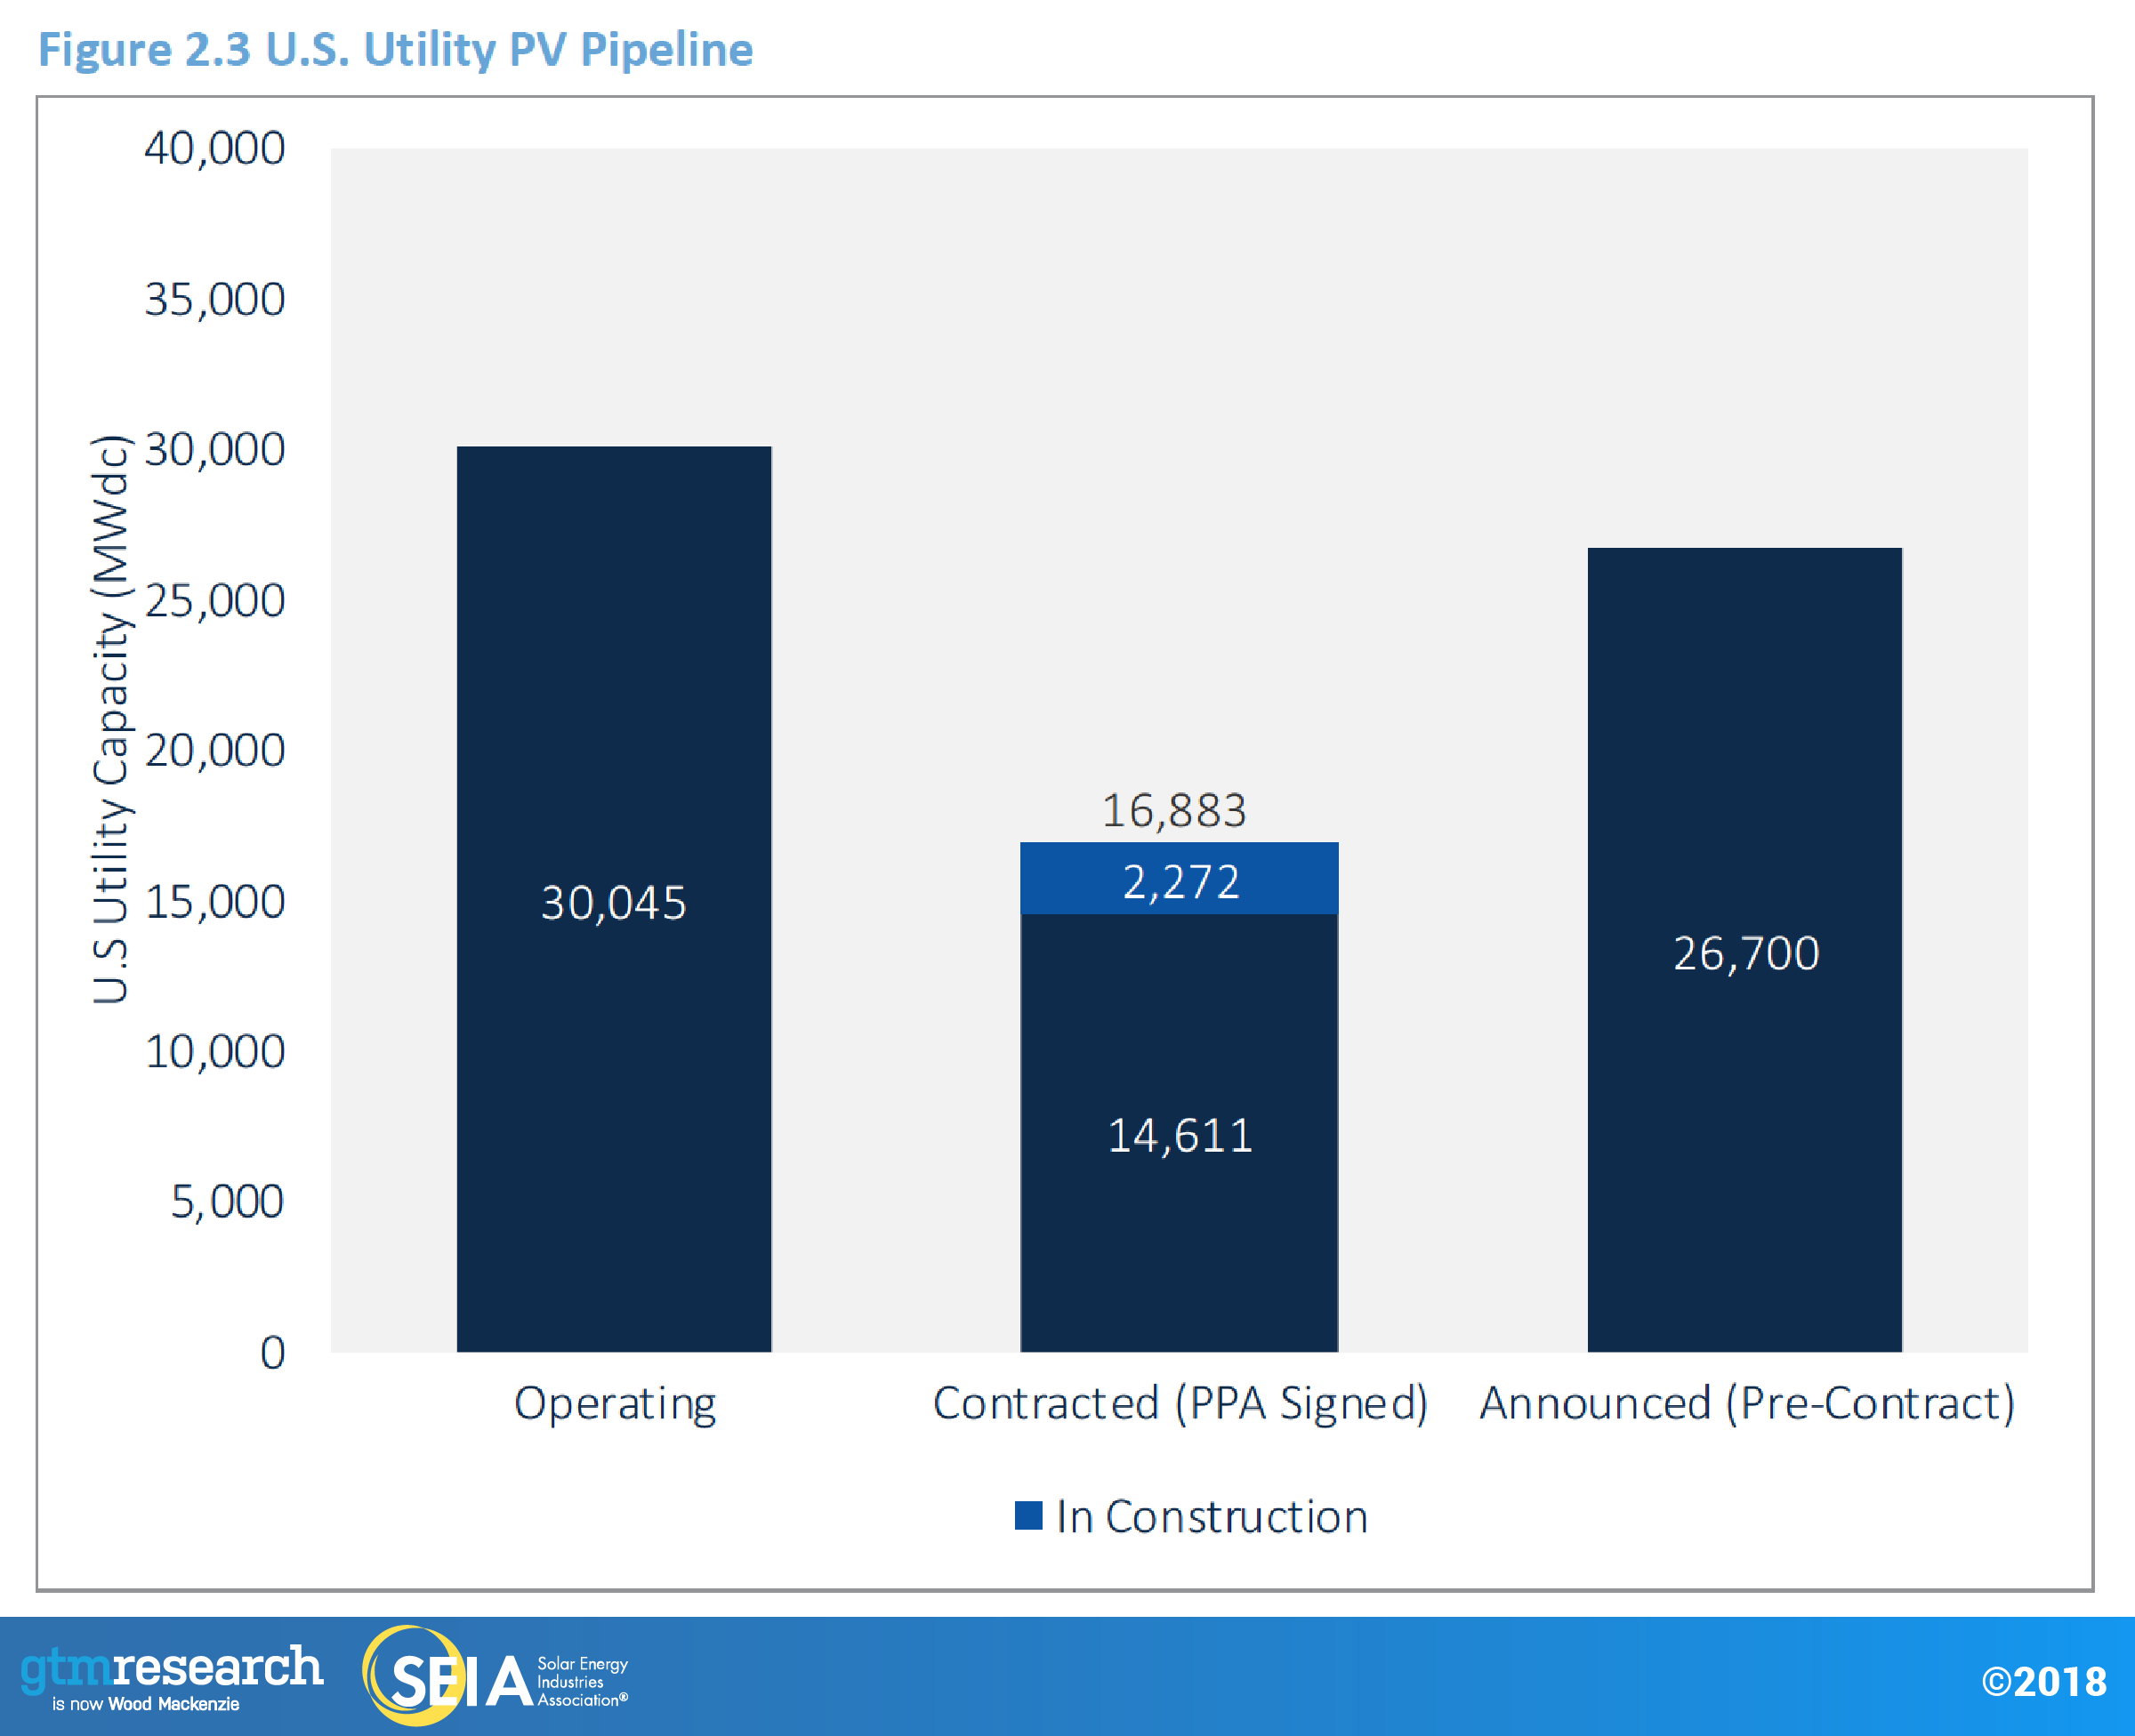
- Contracted utility PV pipeline currently totals 18.1 GWdc
Utility PV continues to hold the largest share of annual installations in the U.S. solar market. A total of 2.6 GWdc came online in Q4 2017, for a total of 6.2 GWdc in 2017. This accounts for 67% of Q4 and 59% of annual capacity additions. Lower-than-expected installation volumes over the second half of 2017 are attributed to both delays and consequent spillover of projects into 2018 due to the uncertainty of module tariffs being imposed, as well as delays and cancellations of PURPA projects in markets like Idaho and Montana.
Voluntary procurement was the largest driver of new capacity additions, with over 2.2 GWdc installed in 2017. It is also expected to drive 33% of capacity additions in 2018. Corporate offtakers drove 1.0 GWdc of 2017 capacity additions. This marks the second year with over 1.0 GWdc driven by corporate procurement. We can expect corporate procurement to drive 5% to 12% of annual capacity additions over the next five years. Initially, PURPA was expected to be the largest driver of utility PV in 2017; however, continued utility pushback against new Qualifying Facility (QF) development led to project delays and cancellations. At the federal level, the PURPA Modernization Act of 2017 (HR 4476) was introduced in the U.S. House of Representatives to stem development of additional QF renewables by allowing utilities to challenge the 1-mile rule and reject QF contracts based on having access to wholesale markets. It faces an uncertain fate in the U.S. Senate.
A total of 2.0 GWdc are already in construction for 2018, and despite the recently imposed tariffs, GTM Research expects over 6.4 GWdc of new capacity to come online in 2018. Developers and EPCs reported that the uncertainty surrounding the possibility of tariffs caused at least 10% of H2 2017 pipelines to be delayed, and in some cases to spill over into 2018. This has led to 351 MWdc of additional projects in development for 2018.
With 2018 being relatively insulated from the impact of tariffs due to developers’ access to tariff-free module supply, 2019 and 2020 will be most sensitive to module tariffs, seeing a 20% and 17% decrease, respectively, over our Q4 2017 forecast. Existing power-purchase agreements for 2019 and 2020 that structured contracts with module pricing assumptions below $0.40/W will be at a high risk of cancellation or delay. Utilities in regulated markets like Duke Energy in North Carolina and Florida Power and Light are likely to adhere to previously announced procurement targets, with smaller emerging state markets seeing the most significant reduction in new procurement. Developers are likely to push out completion dates of 2019 or 2020 projects into 2020, 2021 or later to leverage the tariff stepdown, resulting in depression of expected capacity additions.
Long term, GTM Research expects utility PV growth to resume in 2022 and 2023. Utilities that have outlined long-term procurement of utility solar, such as Tucson Electric Power and Xcel Colorado, will leverage commence-construction rules to capture Investment Tax Credit levels above 10% and secure supplies of tariff-free modules after remedies expire in February 2022.
2.2 National Solar PV System Pricing
We employ a bottom-up modeling methodology to track and report national average PV system pricing for the major market segments. Our bottom-up methodology is based on tracked wholesale pricing of major solar components and data collected from interviews with major installers.
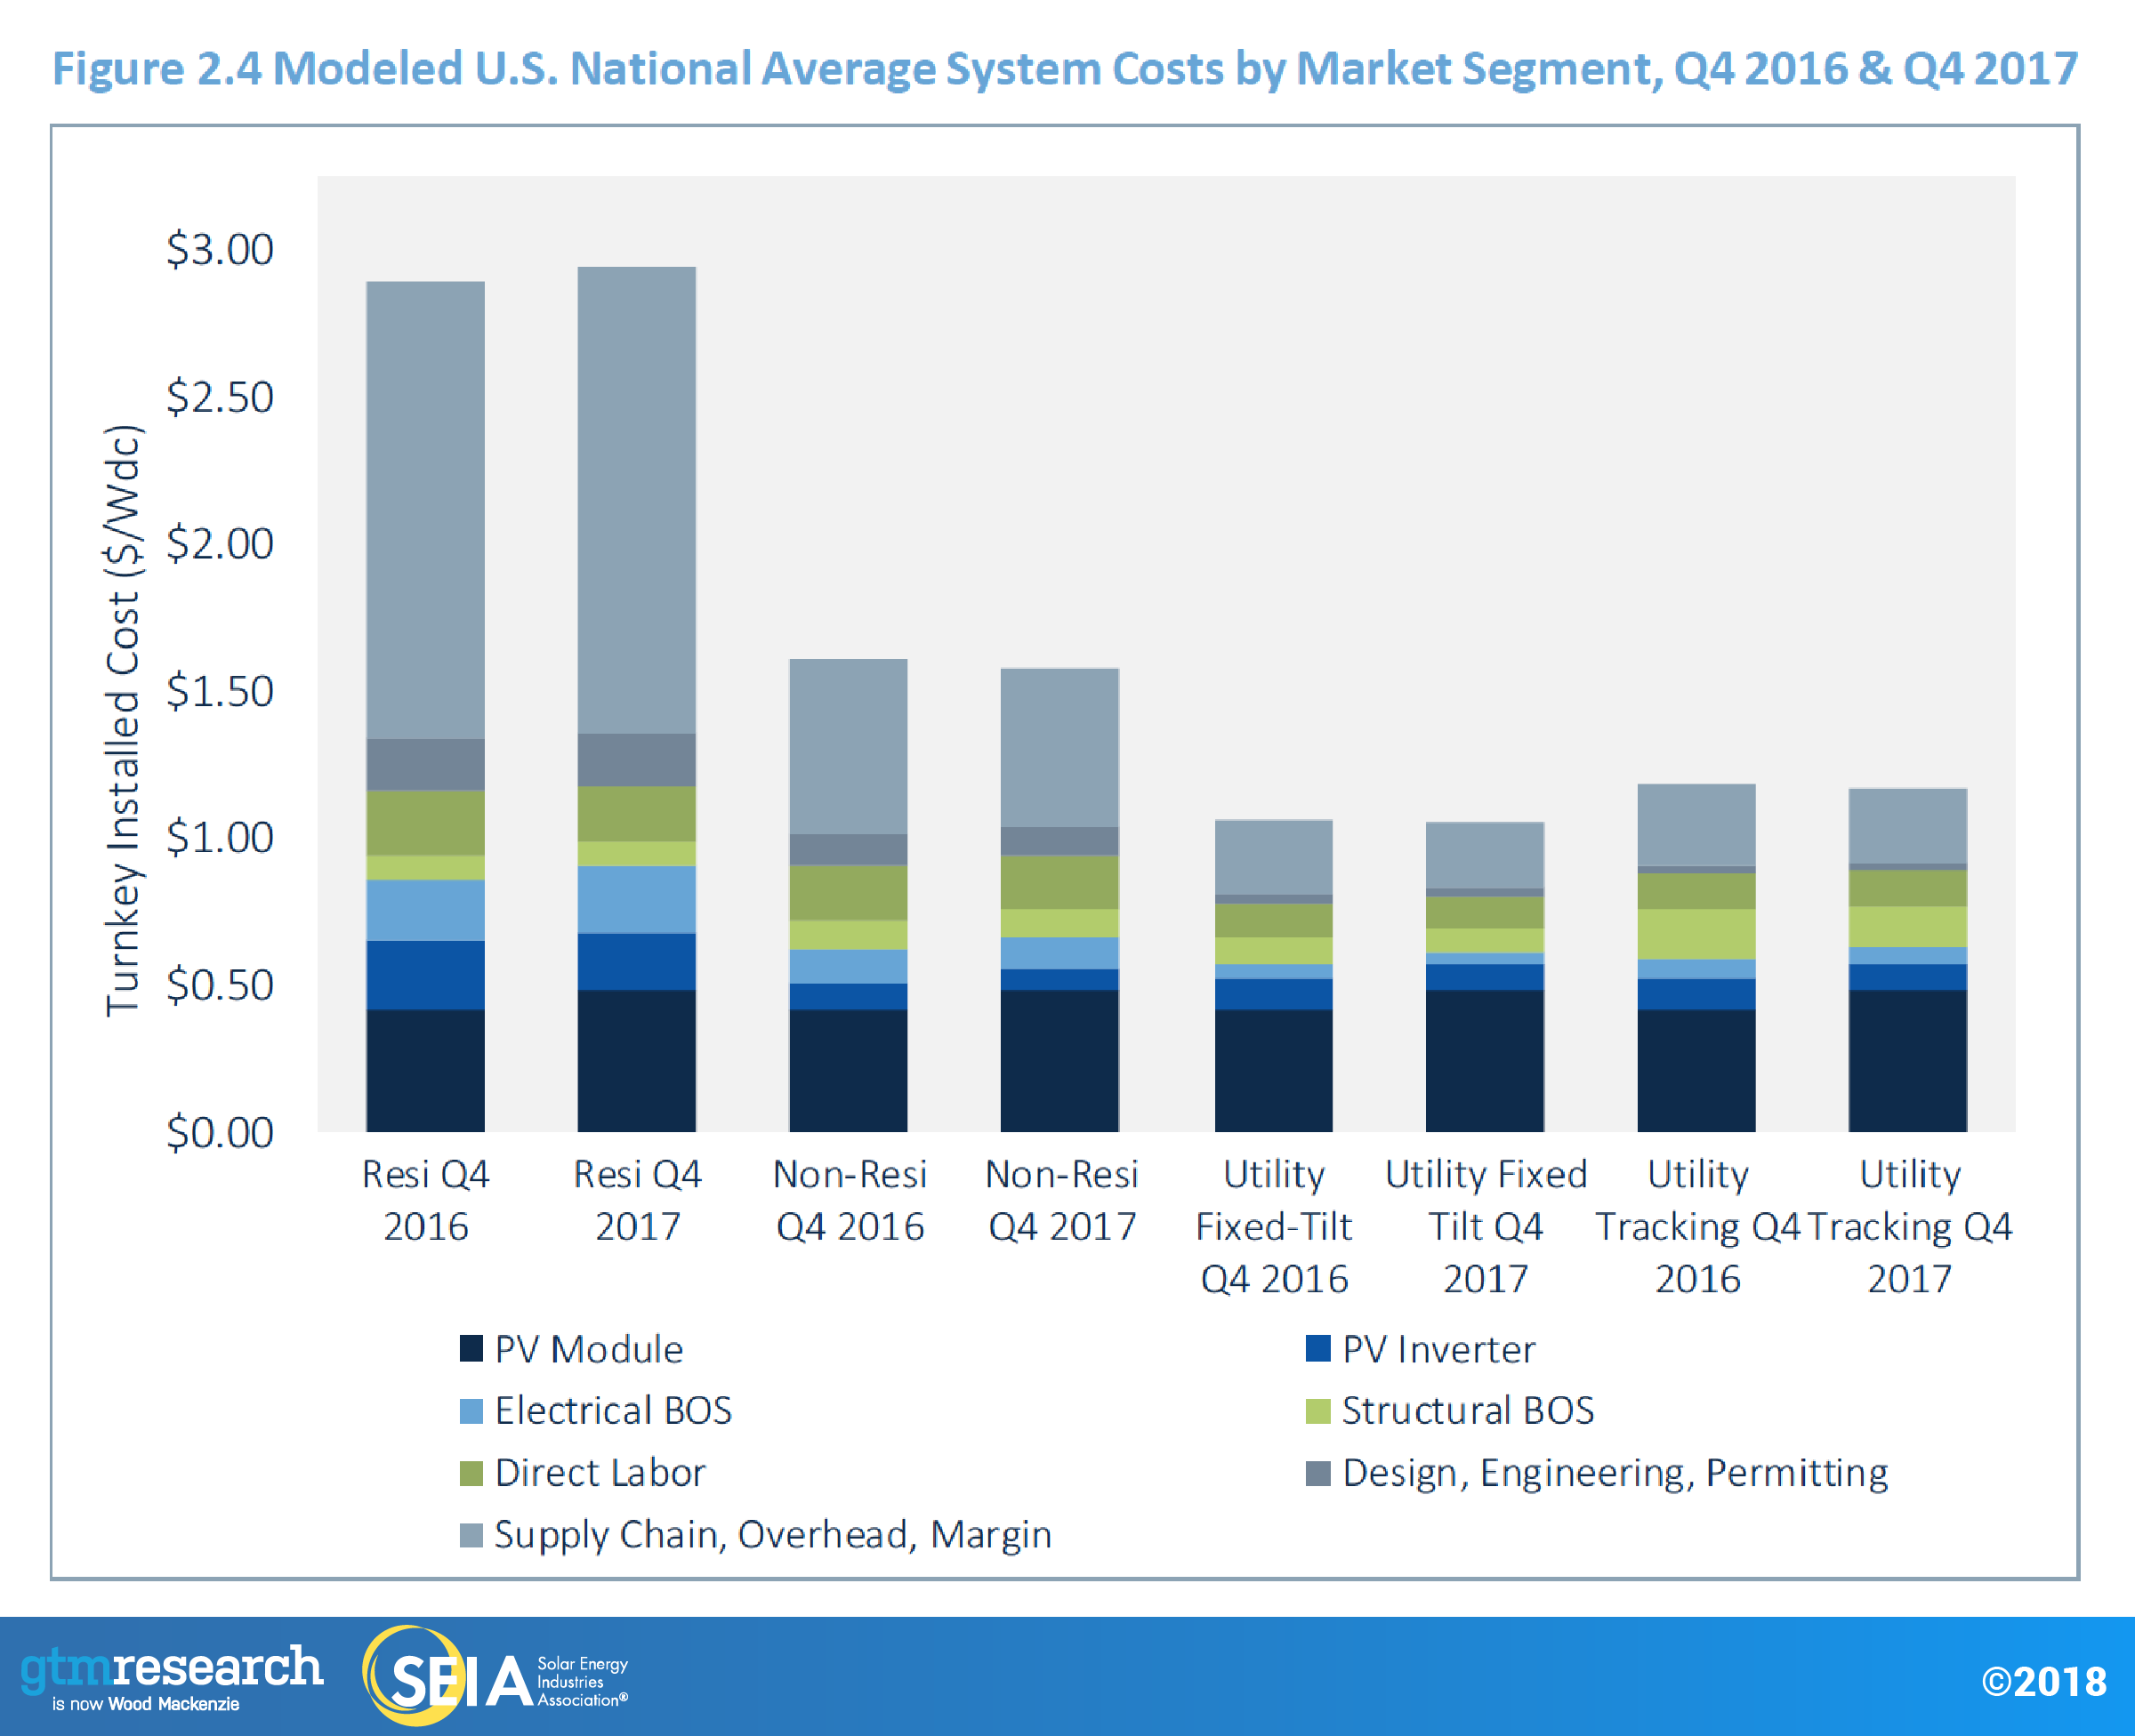
In Q4 2017, system pricing fell from Q3 only in the non-residential market segment. System pricing increased by 0.5%, 1.4% and 0.4% in the residential, utility fixed-tilt and utility single-axis tracking markets, respectively. This is the second quarter in a row where we have seen increases in pricing in most market segments.
2017 is a story of two halves. Quarter-over-quarter, both Q1 and Q2 saw average decreases in system pricing by 2.2% to 3.9%, depending on the market segment. In Q3 and Q4, however, on average, system pricing rose by 2% to 5.6%, depending on the market segment. This stark contrast between the first and second half of the year is due almost entirely to the increase of U.S. module prices.
The rush for module delivery before the Trump administration’s final decision on Section 201 severely impacted the trajectory of system pricing in 2017. In past Q4s, depending on the market segment, we have seen system pricing fall as much as 23% and on average by 16% year-over-year. Comparing Q4 2016 with Q4 2017, prices fell only by an average of 0.5%, with prices actually increasing by 2% for residential systems. This means that system pricing in Q4 2017 was almost equal to pricing in Q4 2016. However, despite module prices increasing by 14% in 2017, overall system prices still managed to decline. Decreases in pricing for racking and inverters, further adoption of 1,500-volt system architectures, improved operational efficiencies, and likely margin compression all contributed to mitigate the impact of increasing module prices. Thus, without the rush for modules in the second half of the year, system pricing across all market segments would have been substantially lower.
2.3 Component Pricing
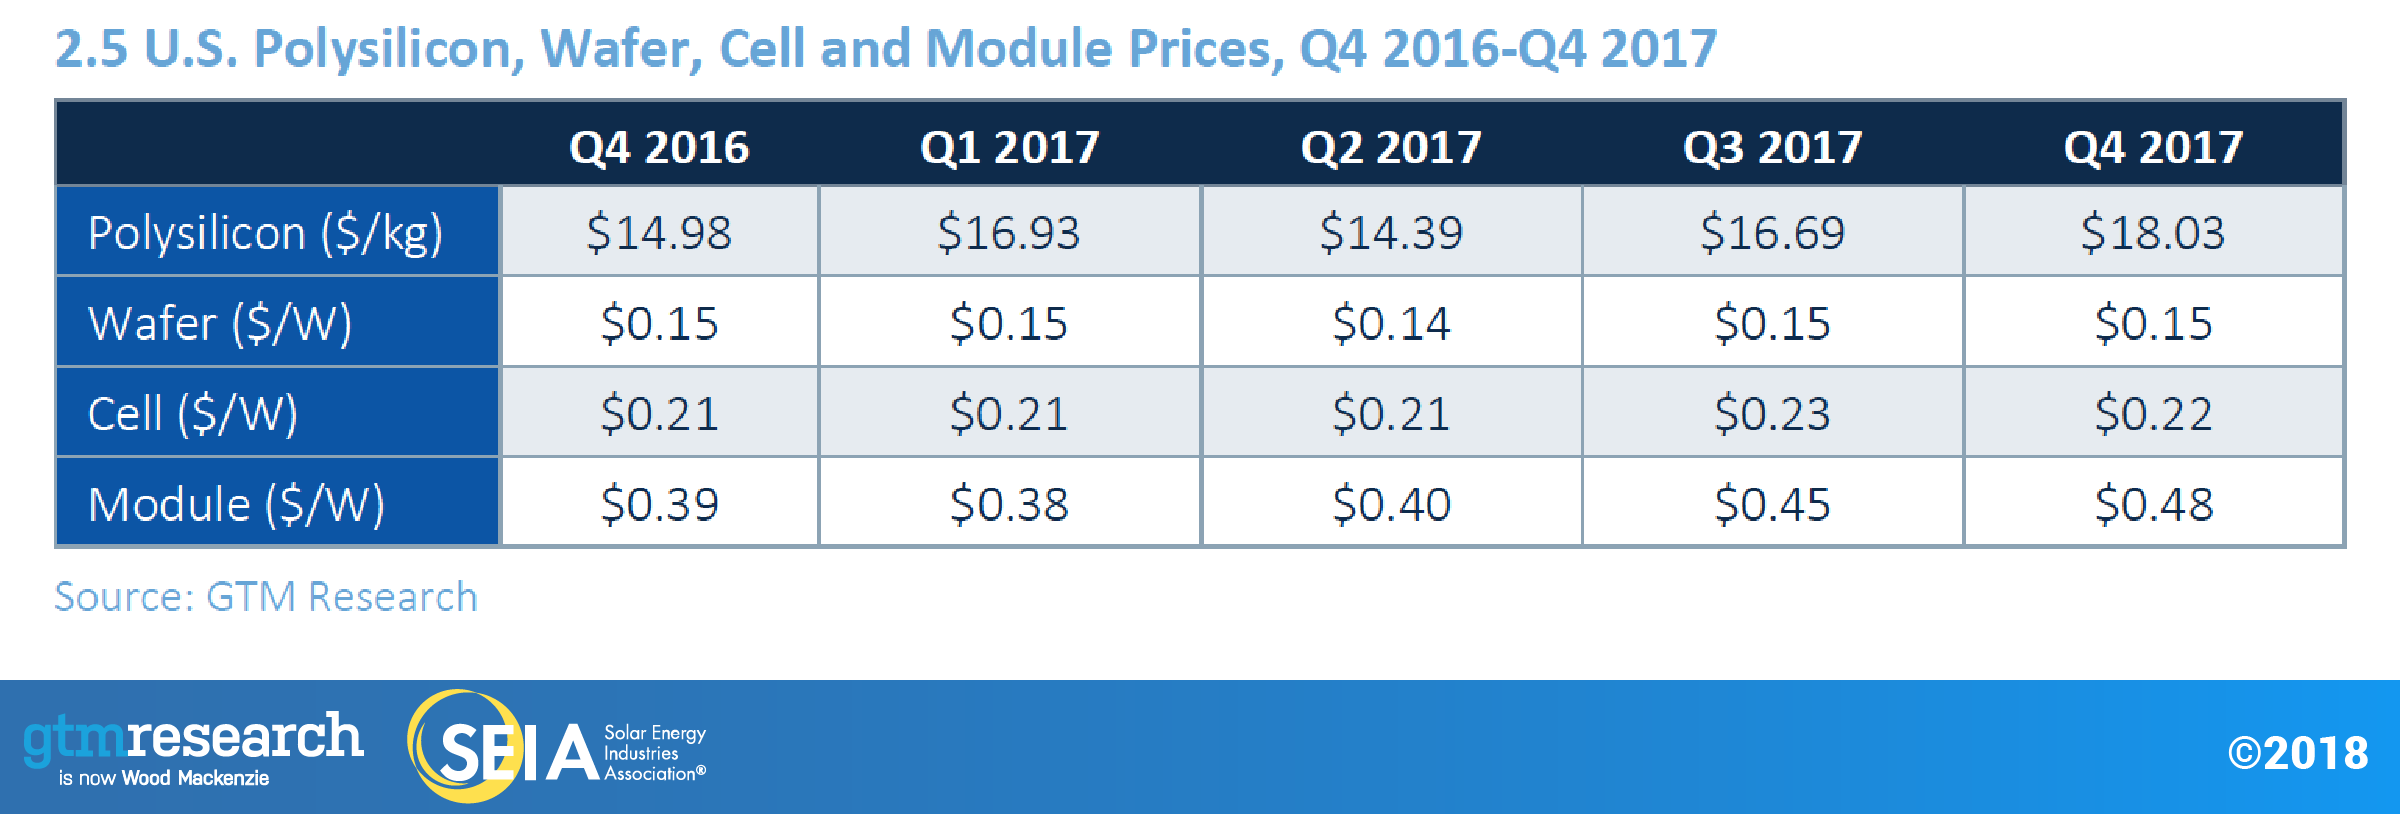
Price trends varied by component in Q4 2017, with differences driven by component-level demand and inventory levels.
- For polysilicon, the quarterly average price increased 8% quarter-over-quarter to $18.0/kg in Q4 2017. Polysilicon price growth has been driven by low supply as select firms are operating at lower utilizations, with some undergoing annual maintenance and others undergoing environmental inspections.
- Multi wafer and cell prices fell slightly quarter-over-quarter, to a respective $0.15/W to $0.22/W. Price trends were driven by low demand and buyer pressure to reduce prices.
In the past few years, U.S. module price trends were largely driven by antidumping and countervailing duties on Chinese suppliers. But recently, the main driver has shifted; current module price trends are largely a result of supply-demand tightness, with prices increasing to an average of $0.48/W for standard multi modules, as the U.S. leaned toward being a seller's market before the final results of the Section 201 petition were released.
2.4 Market Outlook
With President Trump’s decision on the Section 201 trade case now final, GTM Research has accordingly reduced its forecasts to account for the impact of tariffs on system pricing, in tandem with the impacts of corporate tax reform on customers, developers and financiers.
With that in mind, GTM Research forecasts U.S. solar to be essentially flat in 2018. With nearly two-thirds of the 2018 utility PV pipeline consisting of relatively less-price-sensitive renewable portfolio standard projects and projects currently in construction that secured tariff-free modules (either crystalline-silicon PV delivered before the tariffs went into effect or non-subject thin-film modules), tariff impacts on 2018 will be somewhat mitigated. The non-residential market will fall as a pipeline of projects grandfathered in under a more favorable policy and incentive environment wanes in 2018. Residential PV will see a slight rebound after falling 16% in 2017, with a more robust rebound blunted somewhat by the tariffs. This is especially true in major markets that faced higher costs of customer acquisition in 2017, which on net see essentially no growth in 2018.
In the medium term, the post-2018 utility pipeline has been reduced as more price-sensitive procurement drivers such as PURPA and voluntary procurement (i.e., projects made viable due to their economic competitiveness) are unable to pencil out under increased price assumptions. Though the utility segment is still expected to grow 17% in 2019, growth will be relatively flat from 2020-2022 as tariffs push out projects that were initially slated for completion in 2020-2021. Going forward, utility PV’s recovery will continue to be driven by procurement outside renewable portfolio standards, with more than 75% of the current pipeline coming from voluntary procurement, PURPA, off-site corporate procurement, and California-based community-choice aggregators.
For residential PV, the widespread customer-acquisition issues in major state markets that afflicted the segment in 2017 are only exacerbated in an increased pricing environment. This is especially true for large national installers scaling back expensive sales channels and transitioning to lower-cost customer-acquisition strategies in pursuit of profitability. These challenges are expected to continue in the near-term for large national installers, though 2017-2018 is expected to be the bottoming out of this trend as national installers exert less influence on the market 2018 than they did in 2017. Growth is therefore expected to remain in the sub-10% range through 2020 as the market aligns to the growth expectations of small and medium-sized installers leveraging less expensive customer-acquisition channels, with upside contingent on the extent to which national installers can sustainably scale new customer acquisition strategies and sales channels. Growth rates exceeding 10% are expected to resume in the early 2020s as emerging markets begin to account for a larger share of the residential market.
Meanwhile, the non-residential PV market is expected to experience two consecutive down years as the grandfathered project pipeline wanes in 2018 and the market acclimates to a reduced incentive environment across major state markets in 2019. However, this will be incrementally offset in 2020 as the next wave of states with robust community solar mandates – New York, Maryland, Illinois – begin to see the realization of those pipelines while the viability of solar-plus-storage spreads beginning in the next decade. By 2020, growth will resume across all segments, with 28 states in the U.S. expected to be 100+ MWdc annual solar markets, and with 25 of those states being home to more than 1 GWdc of operating solar PV.
Forecast details by state (43 states plus Washington, D.C.) and market segment through 2023 are available in the full report.
Acknowledgments
U.S. Solar Market Insight® is a quarterly publication of Wood Mackenzie, Limited, and the Solar Energy Industries Association (SEIA)®. Each quarter, we collect granular data on the U.S. solar market from nearly 200 utilities, state agencies, installers and manufacturers. This data provides the backbone of this U.S. Solar Market Insight® report, in which we identify and analyze trends in U.S. solar demand, manufacturing and pricing by state and market segment. We also use this analysis to look forward and forecast demand over the next five years. All forecasts are from Wood Mackenzie, Limited; SEIA does not predict future pricing, bid terms, costs, deployment or supply.
- References, data, charts and analysis from this executive summary should be attributed to “Wood Mackenzie, Limited/SEIA U.S. Solar Market Insight®.”
- Media inquiries should be directed to Mike Munsell ([email protected]) at GTM Research and Alex Hobson ([email protected]) at SEIA.
- All figures are sourced from Wood Mackenzie, Limited. For more detail on methodology and sources, visit www.gtmresearch.com/solarinsight.
- GTM Research partners with Clean Power Research to acquire project-level datasets from participating utilities that utilize the PowerClerk product platform. For more information on Clean Power Research’s product offerings, visit https://www.cleanpower.com/.
Our coverage in the U.S. Solar Market Insight reports includes 43 individual states and Washington, D.C. However, the national totals reported include all 50 states, Washington, D.C., and Puerto Rico.
Detailed data and forecasts for 43 states and Washington, D.C. are contained within the full version of this report, available at www.greentechmedia.com/research/ussmi.
Author’s Note: Revision to U.S. Solar Market Insight report title
GTM Research and SEIA have changed the naming convention for the U.S. Solar Market Insight report series. Starting with the report released in June 2016 onward, the report title will reference the quarter in which the report is released, as opposed to the most recent quarter in which installation figures are tracked. The exception will be our Year in Review publication, which covers the preceding year’s installation volumes despite being released during the first quarter of the current year.