Solar Market Insight Report 2018 Q2
Other Links: Purchase the Full Report | Press Release
The quarterly SEIA/GTM Research U.S. Solar Market InsightTM report shows the major trends in the U.S. solar industry. Learn more about the U.S. Solar Market Insight Report.
Key Figures
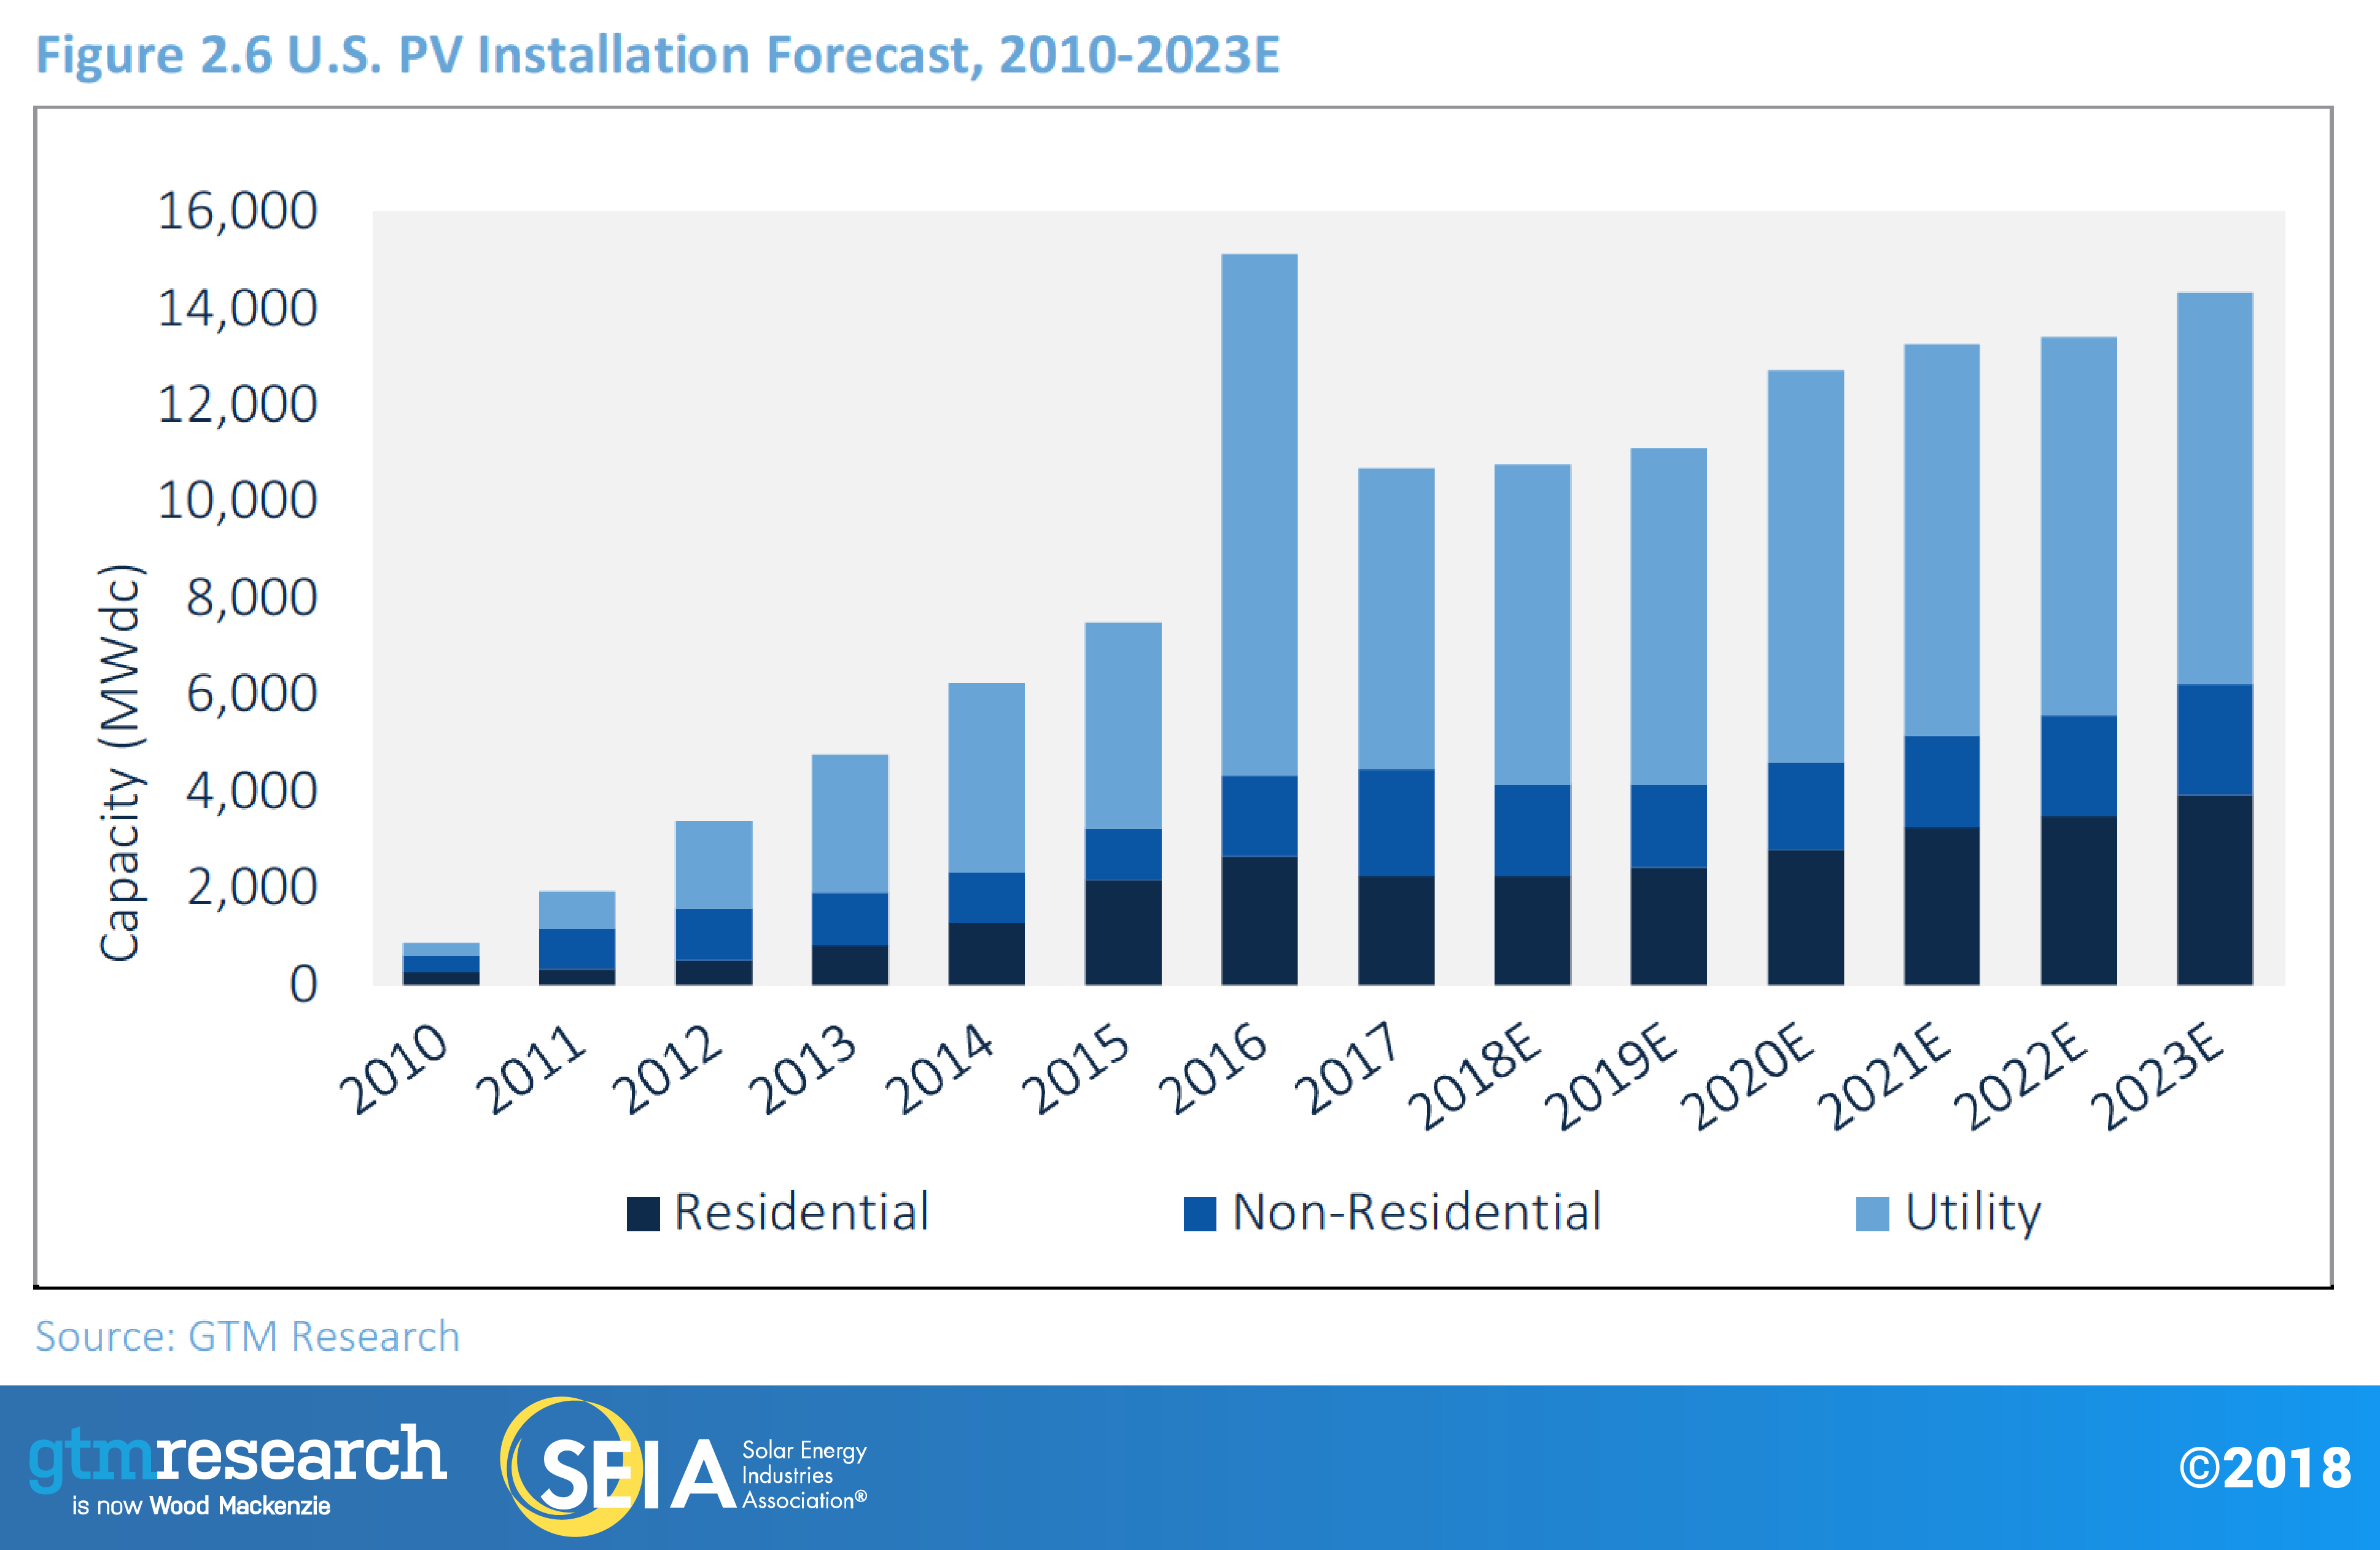
- In Q1 2018, the U.S. market installed 2.5 GWdc of solar PV, a 13% year-over-year increase and a 37% quarter-over-quarter decrease.
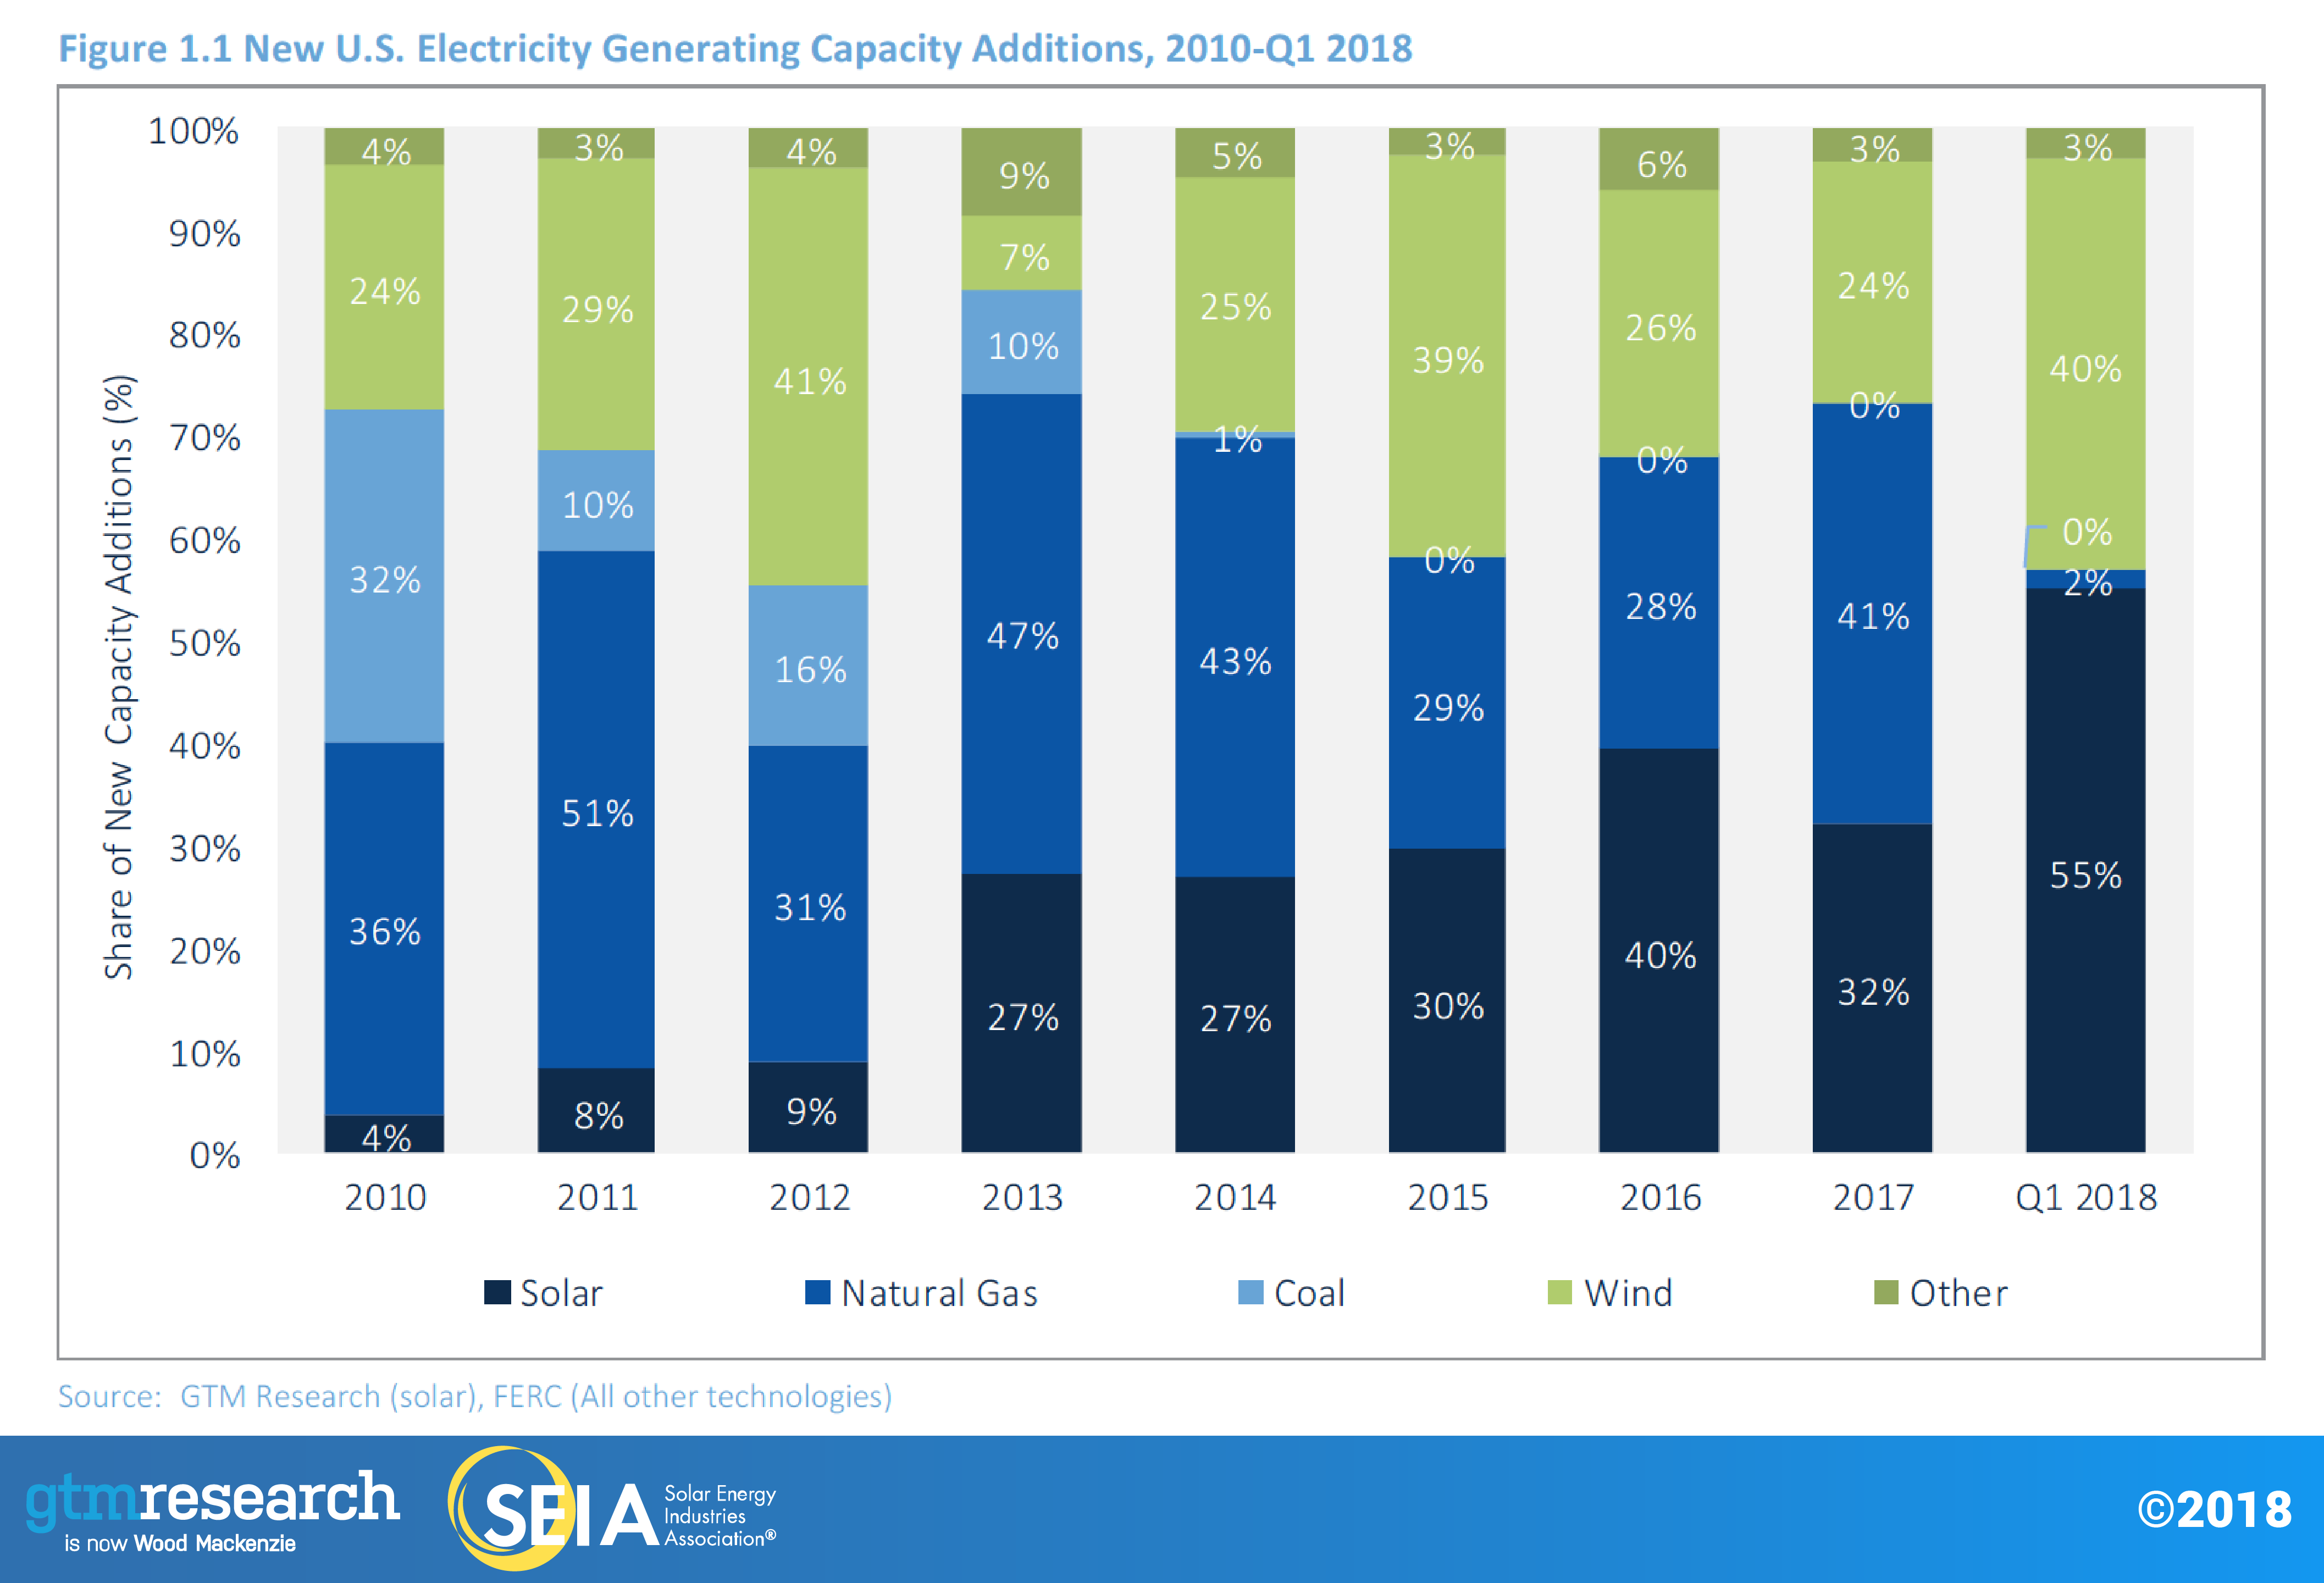
- In Q1 2018, 55% of all new electric generating capacity brought online in the U.S. came from solar – the second consecutive quarter in which solar accounted for the largest share of new capacity additions.
- The residential PV sector was essentially flat on both a year-over-year and quarter-over-quarter basis. After four consecutive quarters of year-over-year declines, residential PV shows some signs of improvement over 2017.
- Coming off its largest quarter ever, non-residential PV fell 34% quarter-over-quarter, despite posting 23% year-over-year growth. Regulatory demand pull-in from looming policy deadlines in California and the Northeast – in addition to the continued build-out of a robust community solar pipeline in Minnesota – are the leading growth factors.
- While voluntary procurement by utilities is the largest driver of utility-scale PV, corporate procurement/offsite commercial and industrial now accounts for 2.0 GWdc, or 10%, of projects in development.
- GTM Research forecasts flat growth in 2018 vs. 2017, with another 10.8 GWdc of new PV installations expected.
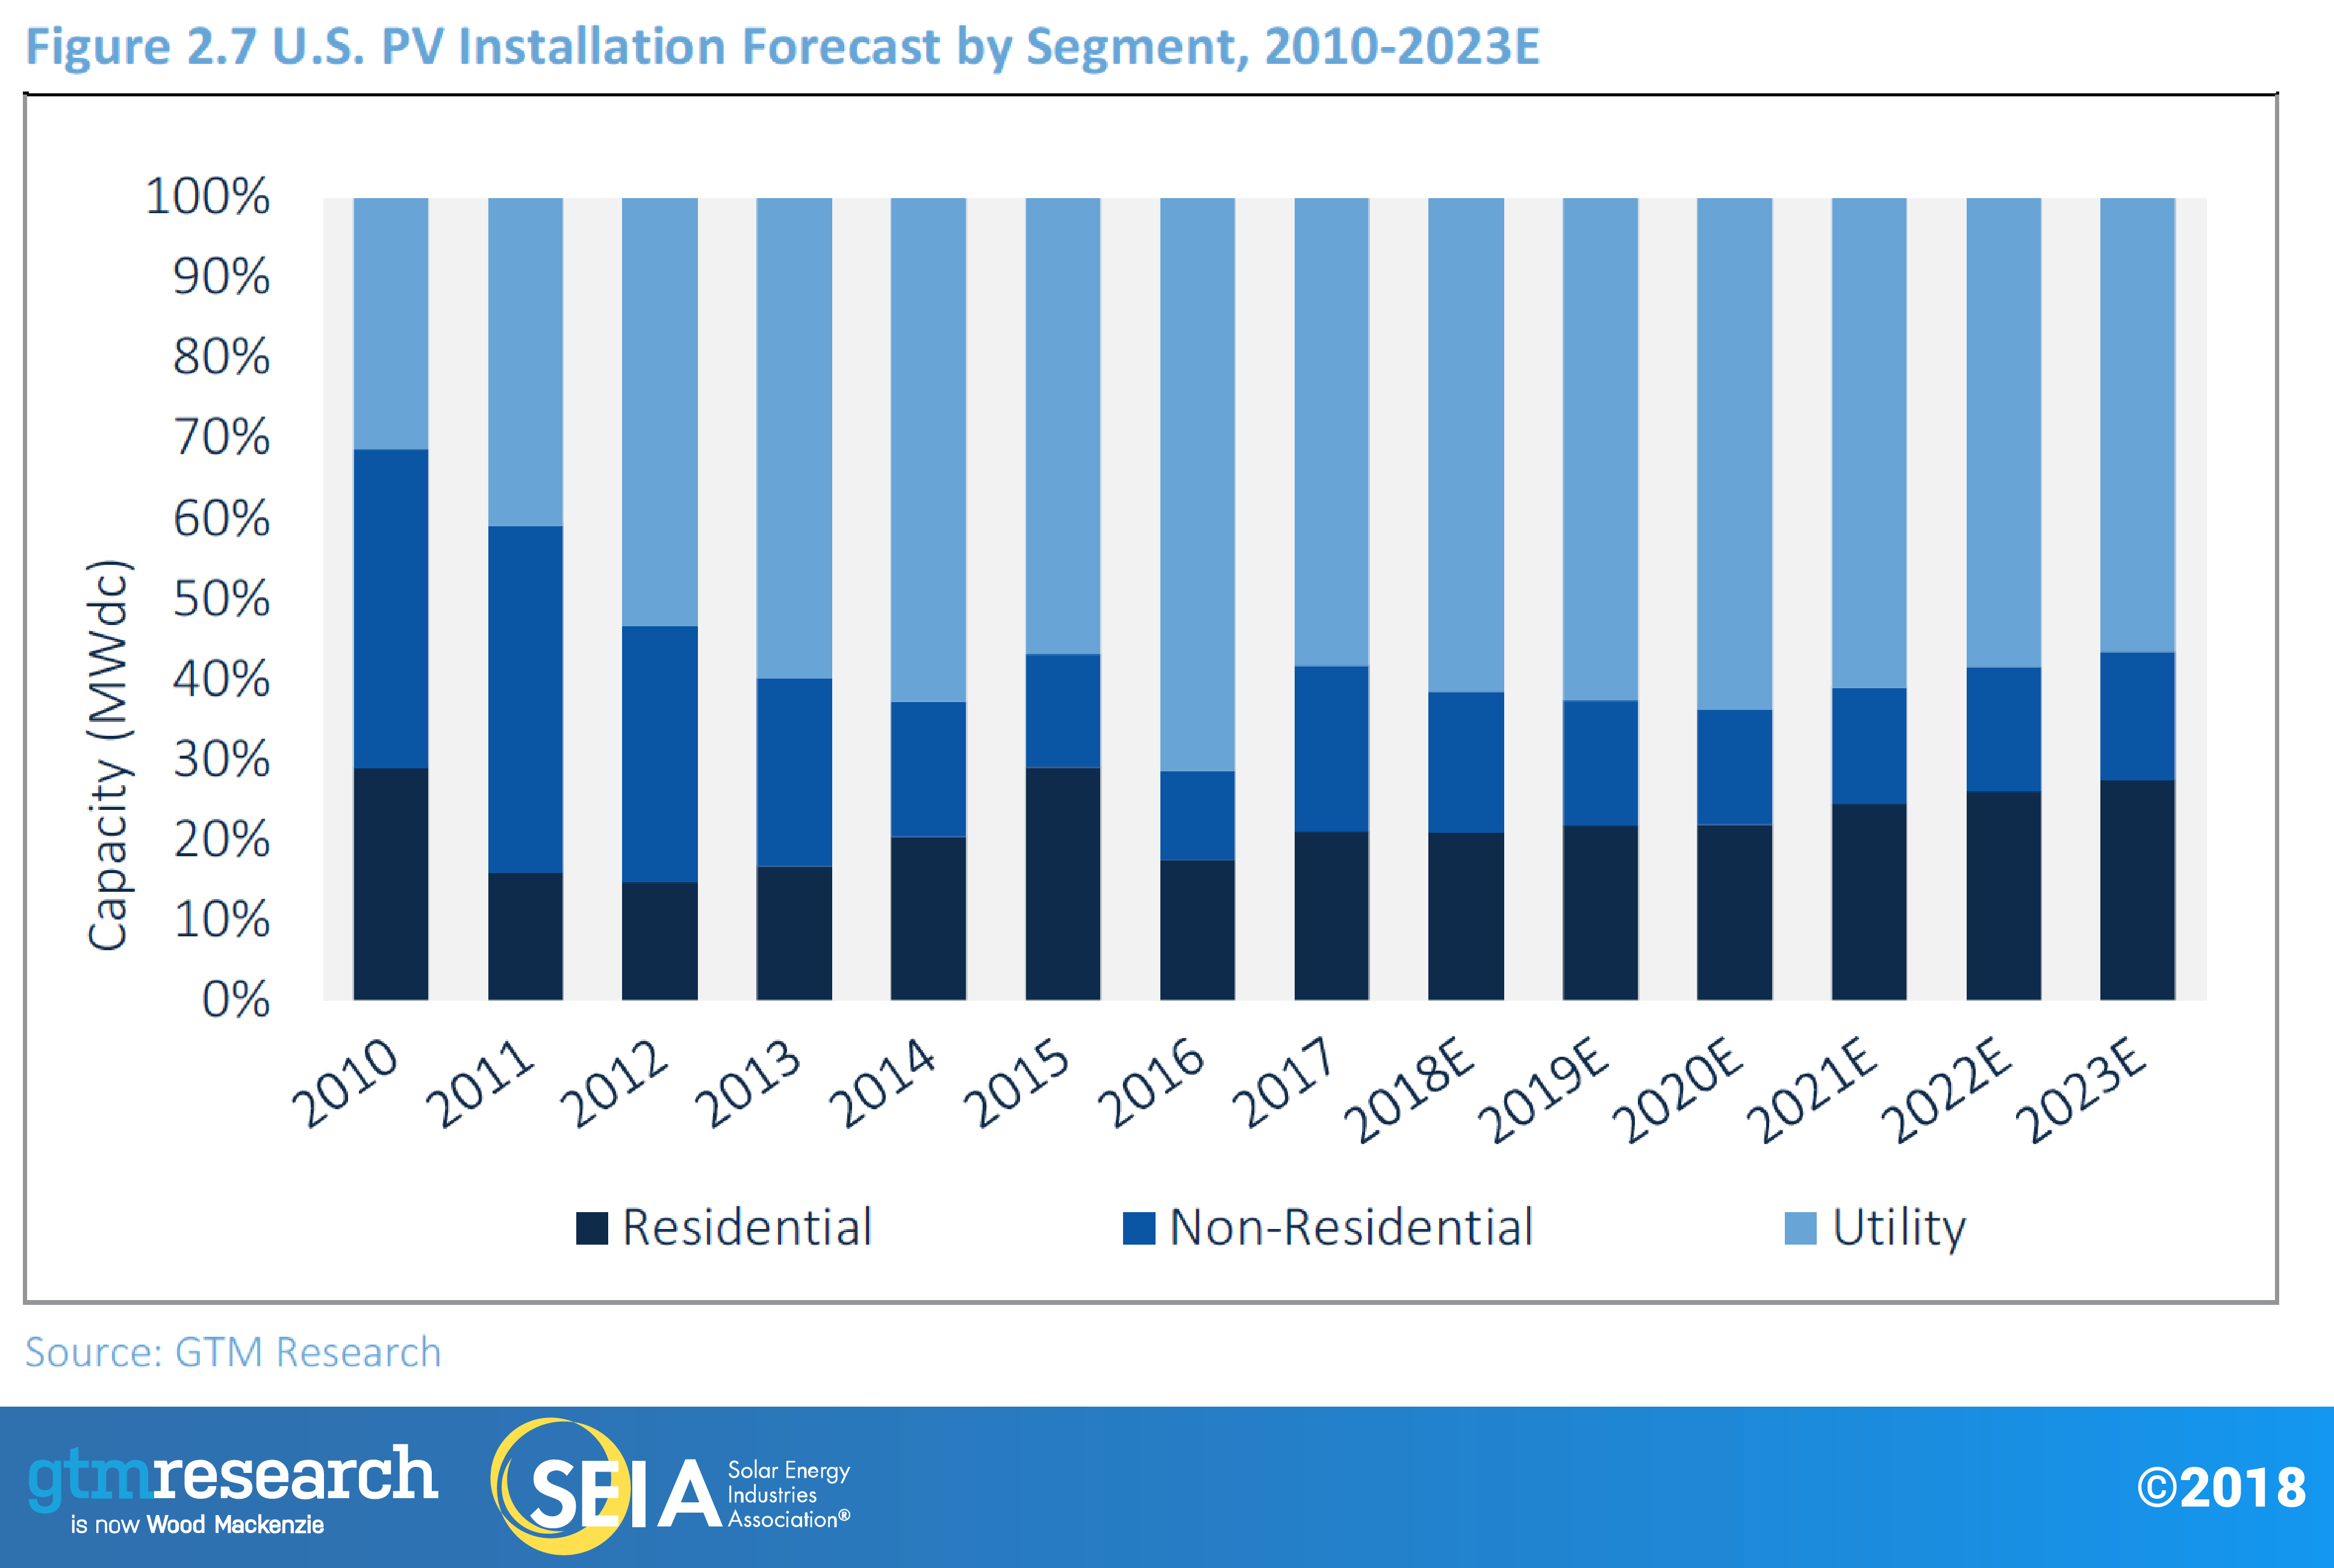
- Total installed U.S. PV capacity is expected to more than double over the next five years. By 2023, over 14 GWdc of PV capacity will be installed annually.
1. Introduction
In Q1 2018, the U.S. solar market installed 2.5 gigawatts direct current (GWdc) of solar photovoltaic (PV) capacity. In total, the national market grew 13% on a year-over-year basis, despite falling 37% on a quarter-over-quarter basis. In line with historical trends, utility PV accounted for the lion’s share of PV installations at 57% of installed capacity. In Q1, solar PV accounted for the majority of U.S. electric capacity additions.
After 2017, during which residential PV contracted 15%, the sector was essentially flat on both a year-over-year and quarter-over-quarter basis in Q1 2018. This is a promising indicator that the constrained residential PV growth throughout 2017 may be abating after facing segment-wide customer-acquisition challenges and the subsequent national installer pullback. However, these problems are not entirely solved, as major states are still struggling to grow in heavily penetrated residential PV markets in Q1. Three of the top five markets in 2017 are expected to contract in 2018 for a second consecutive year as a function of these persistent customer-acquisition challenges. The decline in some major state markets will be offset by growth in emerging markets, and accordingly, we expect growth to be flat in 2018.
Though non-residential PV technically fell 34% on a quarterly basis from Q4 2017, which was the strongest quarter ever for non-residential installations, it grew 23% year-over-year, putting Q1 2018 as the fourth-largest quarter for non-residential solar. This was primarily driven by a pipeline of commercial and industrial (C&I) projects grandfathered into solar-friendly time-of-use periods in California, in addition to the continued realization of a robust community-solar pipeline in Minnesota, which is expected to continue for the remainder of the year.
Utility PV continues to make up the largest share of annual installations in the U.S. solar market. A total of 1.4 GWdc came online in Q1 2018, accounting for 57% of U.S. capacity installed this quarter. With the Section 201 trade case on cells and modules decided, developers now have the policy certainty needed to negotiate procurement. New procurement completion dates are primarily targeting 2020 and 2021. With 21% of expected 2018 capacity already online in Q1 and better visibility into developer pipelines, there is more confidence in projects expected to come online this year. In the near term, 2018 is expected to be somewhat insulated from the impact of the Section 201 tariffs due to developers securing tariff-free module supply from pre-tariff imports, thin-film PV not being subject to tariffs, and some domestic PV production. But in the longer term, the impacts of these tariffs are significant – several developers have announced project cancelations, and more are in negotiations to restructure their PPAs due to the higher costs resulting from the tariffs.
1.1. State Market Spotlight: California's New Building Solar Mandate Creates 800 MW of New Residential PV Demand
On May 9, 2018, the California Energy Commission approved a proposal mandating that all new low-rise residential buildings (including multi-family homes less than three stories) shall be constructed with a PV system beginning in 2020. This is the first such statewide rooftop solar building mandate in the U.S. In this State Market Spotlight, GTM Research breaks down how this decision increases California’s long-term residential PV forecast.
According to data from California’s New Solar Homes Partnership, new-build solar has historically accounted for a small share of California’s residential PV market. In 2017, only 3% of California’s residential capacity in 2017 was installed on new construction. As a result, the new CEC mandate provides significant upside to California’s long-term forecasts beginning in 2020.
Though estimates vary for forecasted new construction in 2020, we used data sourced through the California Homebuilding Foundation and assume that roughly 65,000 new single-family homes will be built in 2020, while citing CEC estimates that around 47,000 new multi-family homes will be less than three stories in height and thus subject to the new building code.
Housing developers that secure building permits before 2020 will not be subject to the rule, which will allow for a significant amount of grandfathered non-compliant houses to be built in 2020. Accordingly, we assume that 60% of new single-family homes in 2020 will be compliant to the new building codes while assuming that a smaller share (25%) of multi-family homes will be subject to the new codes due to a much longer development cycle, with compliance rates for both expected to gradually increase annually. Finally, we assume a conservative 10% of new housing is exempt from the ruling for structural and solar access reasons.
Because new home solar has historically accounted for such a small share of solar installations in California – California’s New Solar Homes Partnership counted just over 8,000 new homes with solar in 2017 – the implementation of this rule adds over 800 MW of additional demand coming from new home solar in 2020-2023.
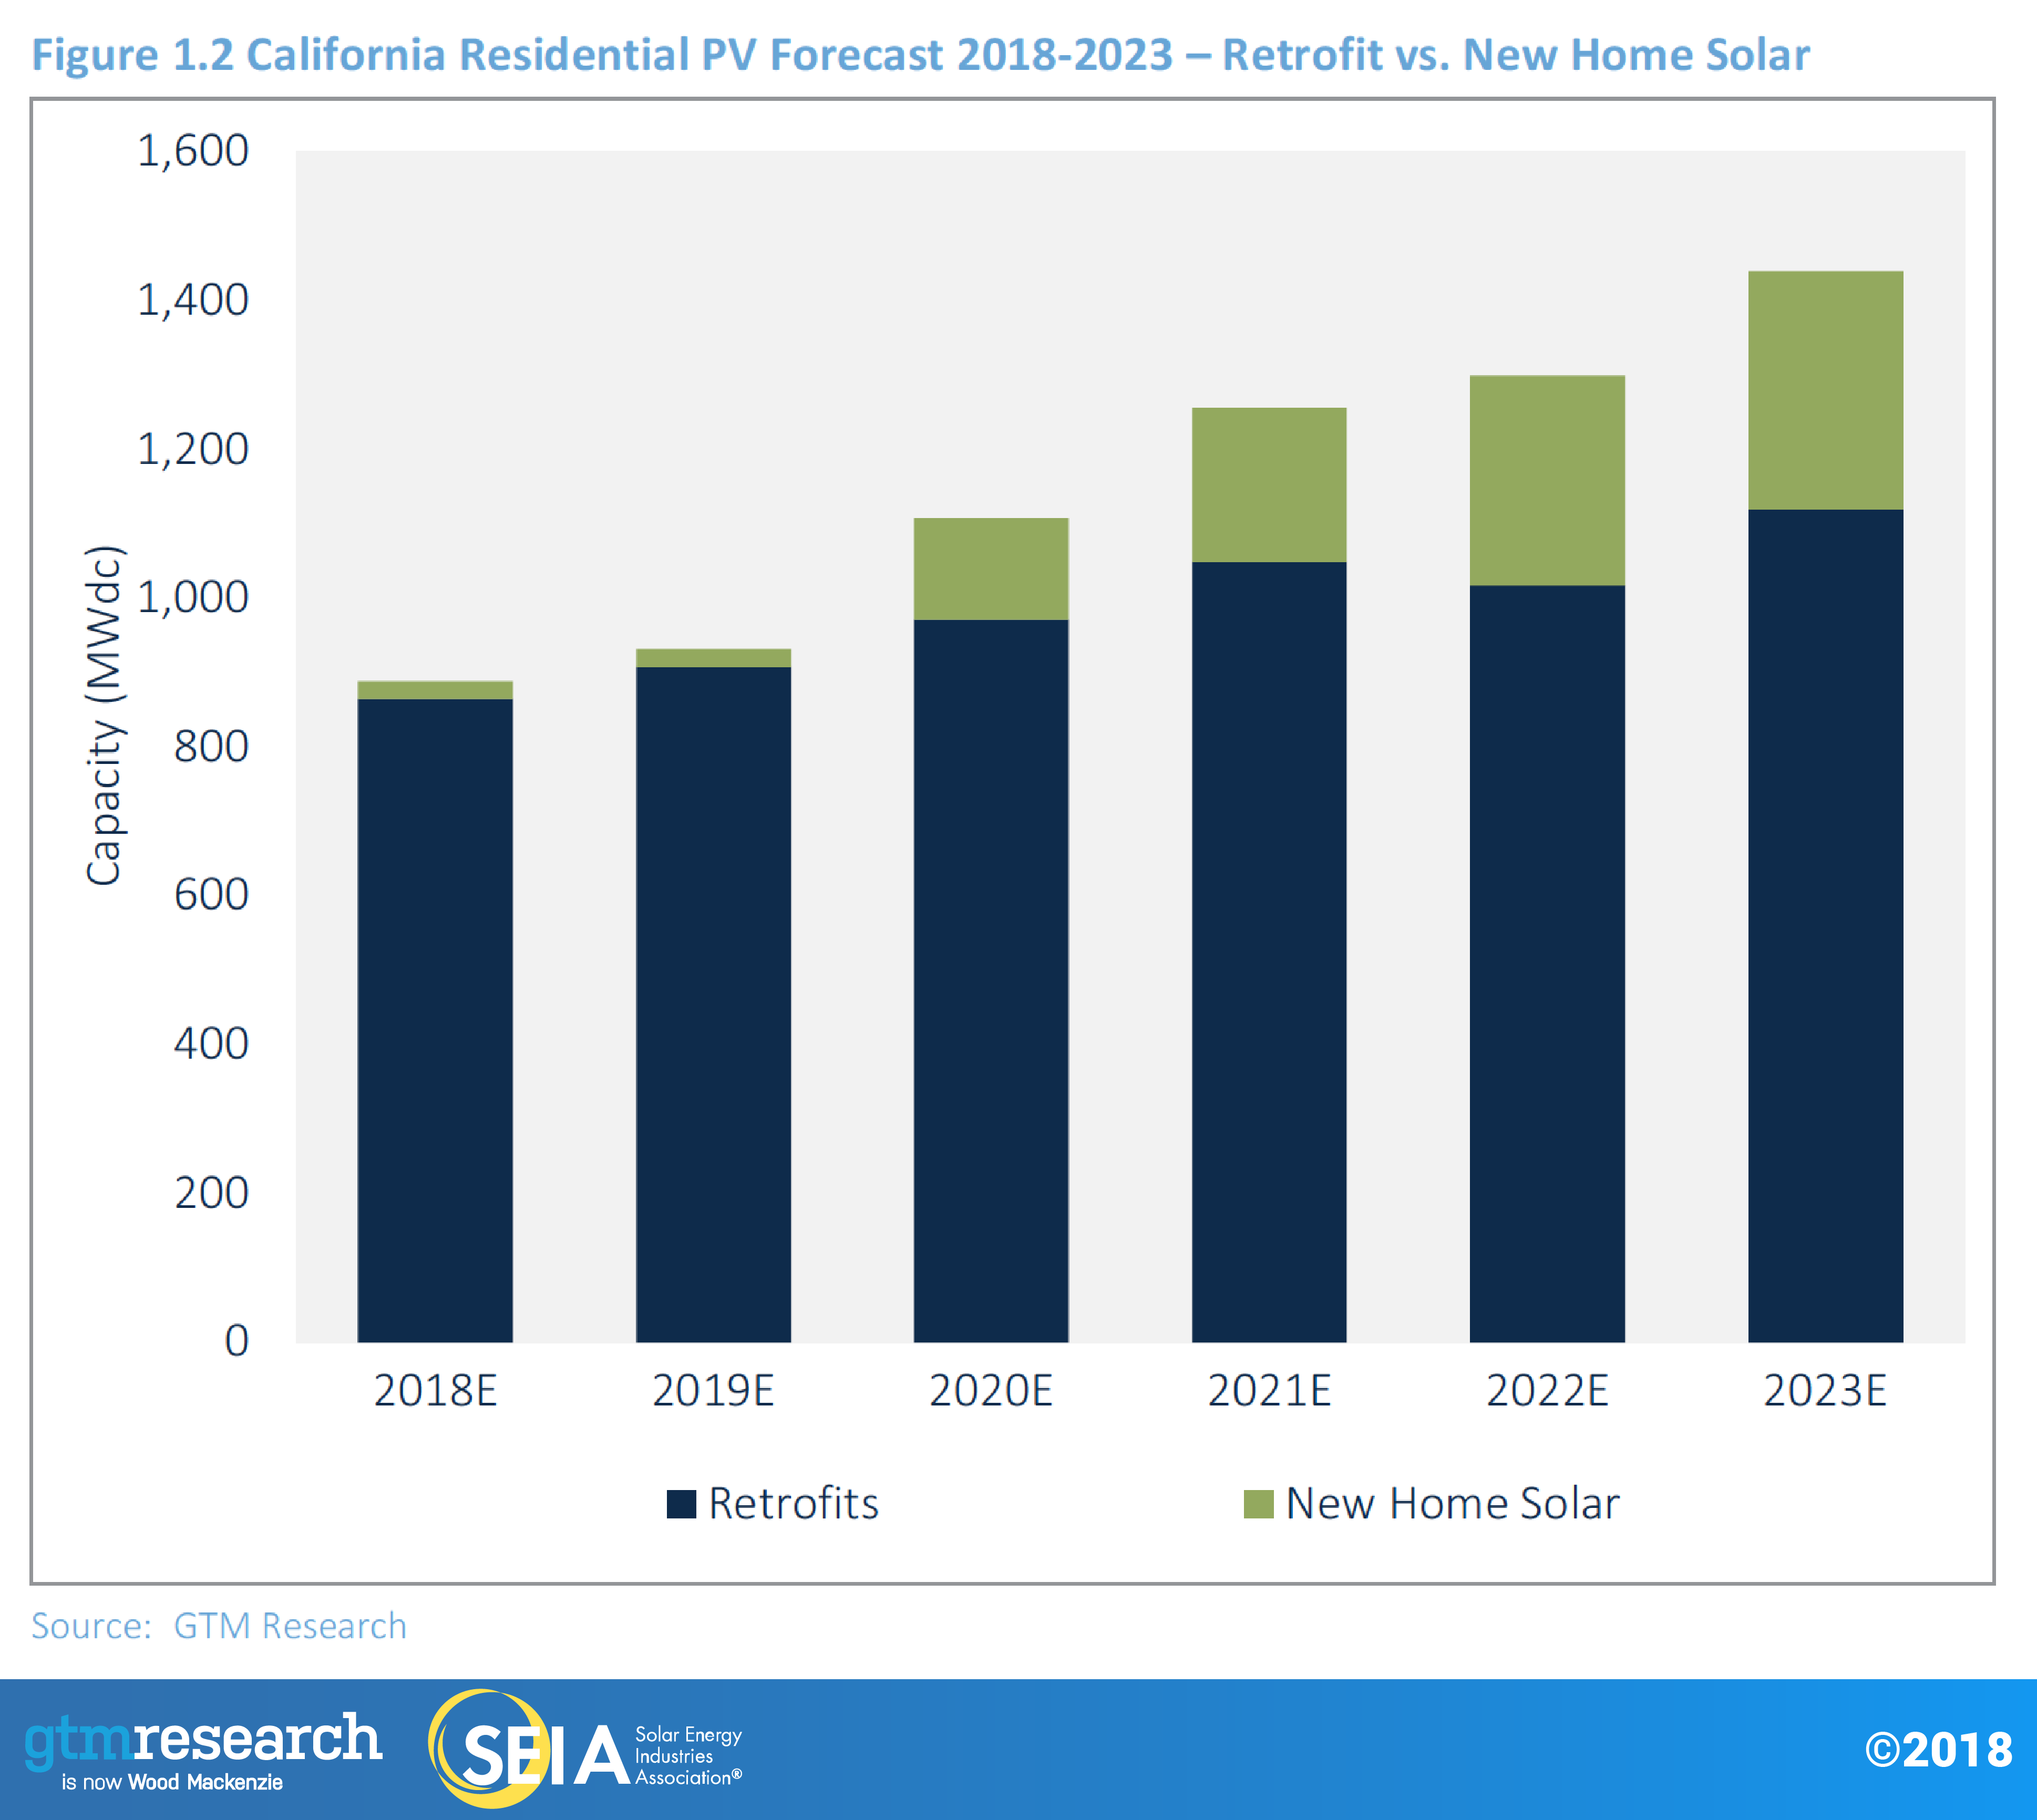
espite not accounting for a large share of residential installations to date, new home solar in California will be the primary subsegment driving growth in the state. While the retrofit market is only expected to see mid-single-digit percentage growth from 2018-2021 (before contracting in 2022 as the federal residential Investment Tax Credit1 expires), the new home solar market will grow from 24 MW in 2019 to 137 MW in 2020. By 2023, new home solar will account for over 20% of residential installed capacity or 300 MW of solar capacity in California. By 2023, California’s new home solar market will account for more solar demand than the second-largest forecasted state market – New Jersey – by 100 MW.
1 The Investment Tax Credit steps down to 26 percent for projects that commence construction in 2020, and to 22 percent for projects that commence construction in 2021. In 2022, the ITC fully expires for residential solar projects that are customer-owned. After 2023, the ITC steps down to 10 percent permanently for third-party-owned residential solar projects as well as commercial and utility projects.
2. Photovoltaics
2.1. Market System Trends
2.1.1. Residential PV
Key Figures
- 562 MWdc installed in Q1 2018
- Flat quarter-over-quarter; year-over-year
After a year in which the residential market saw 15% contraction, Q1 2018 installation numbers show promising signs that national installer headwinds and segment-wide customer-acquisition challenges may be abating in 2018.
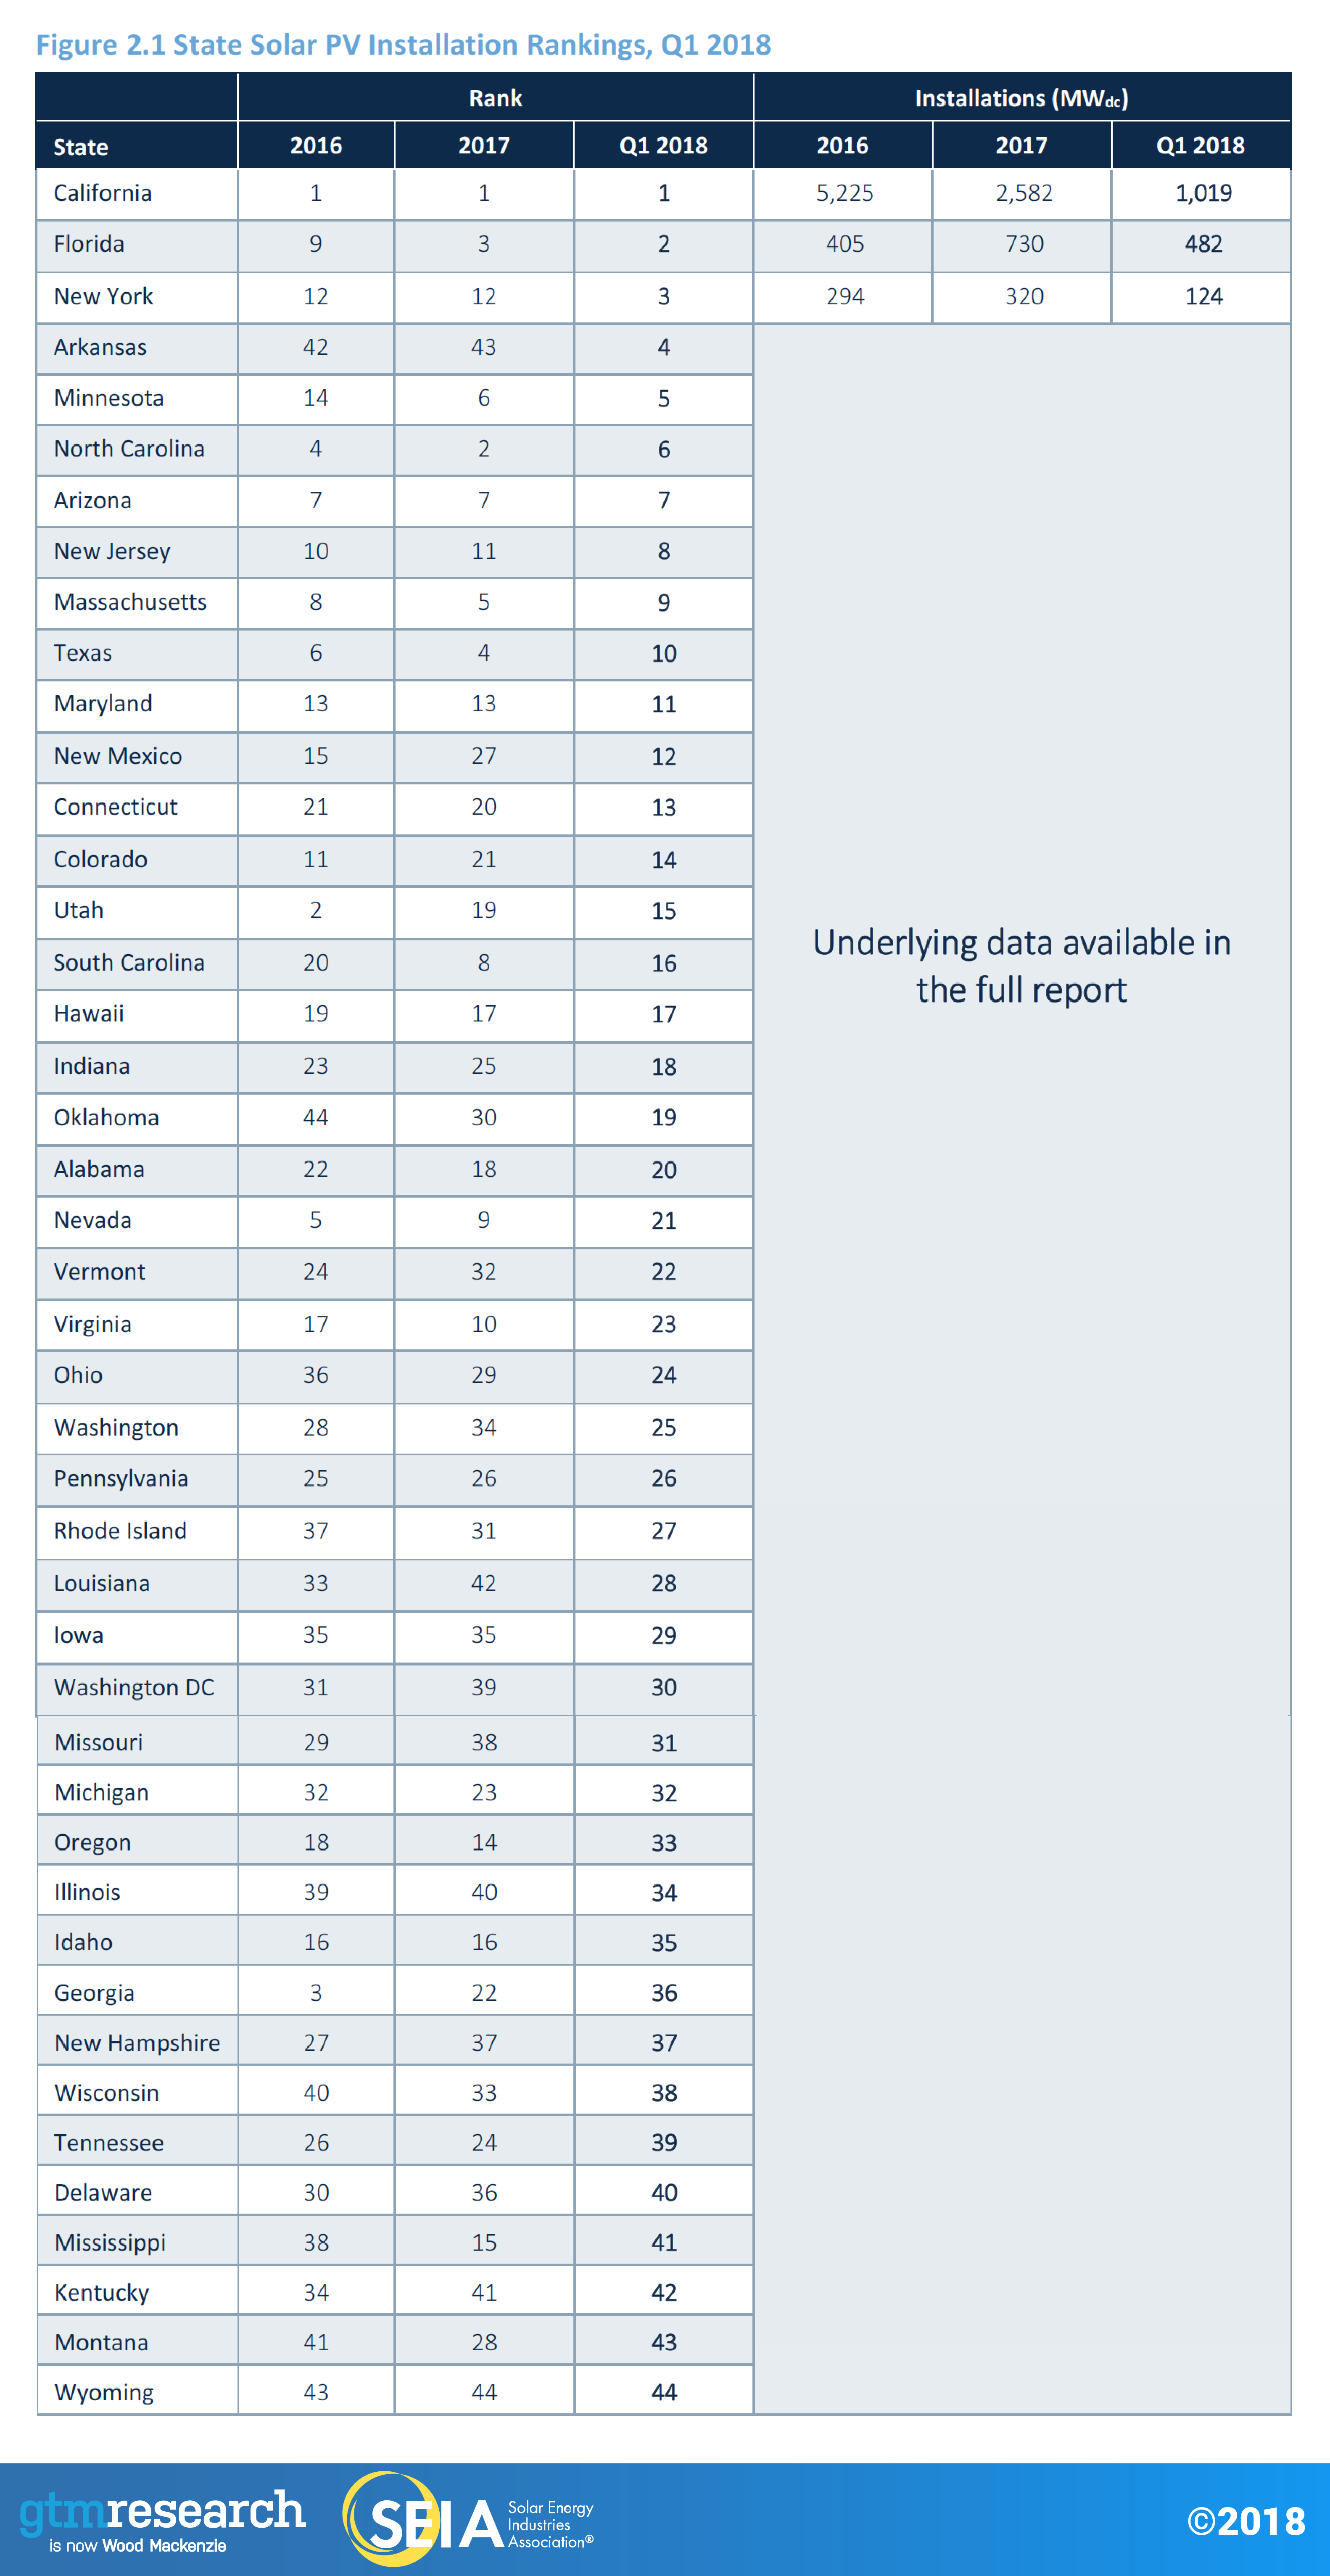
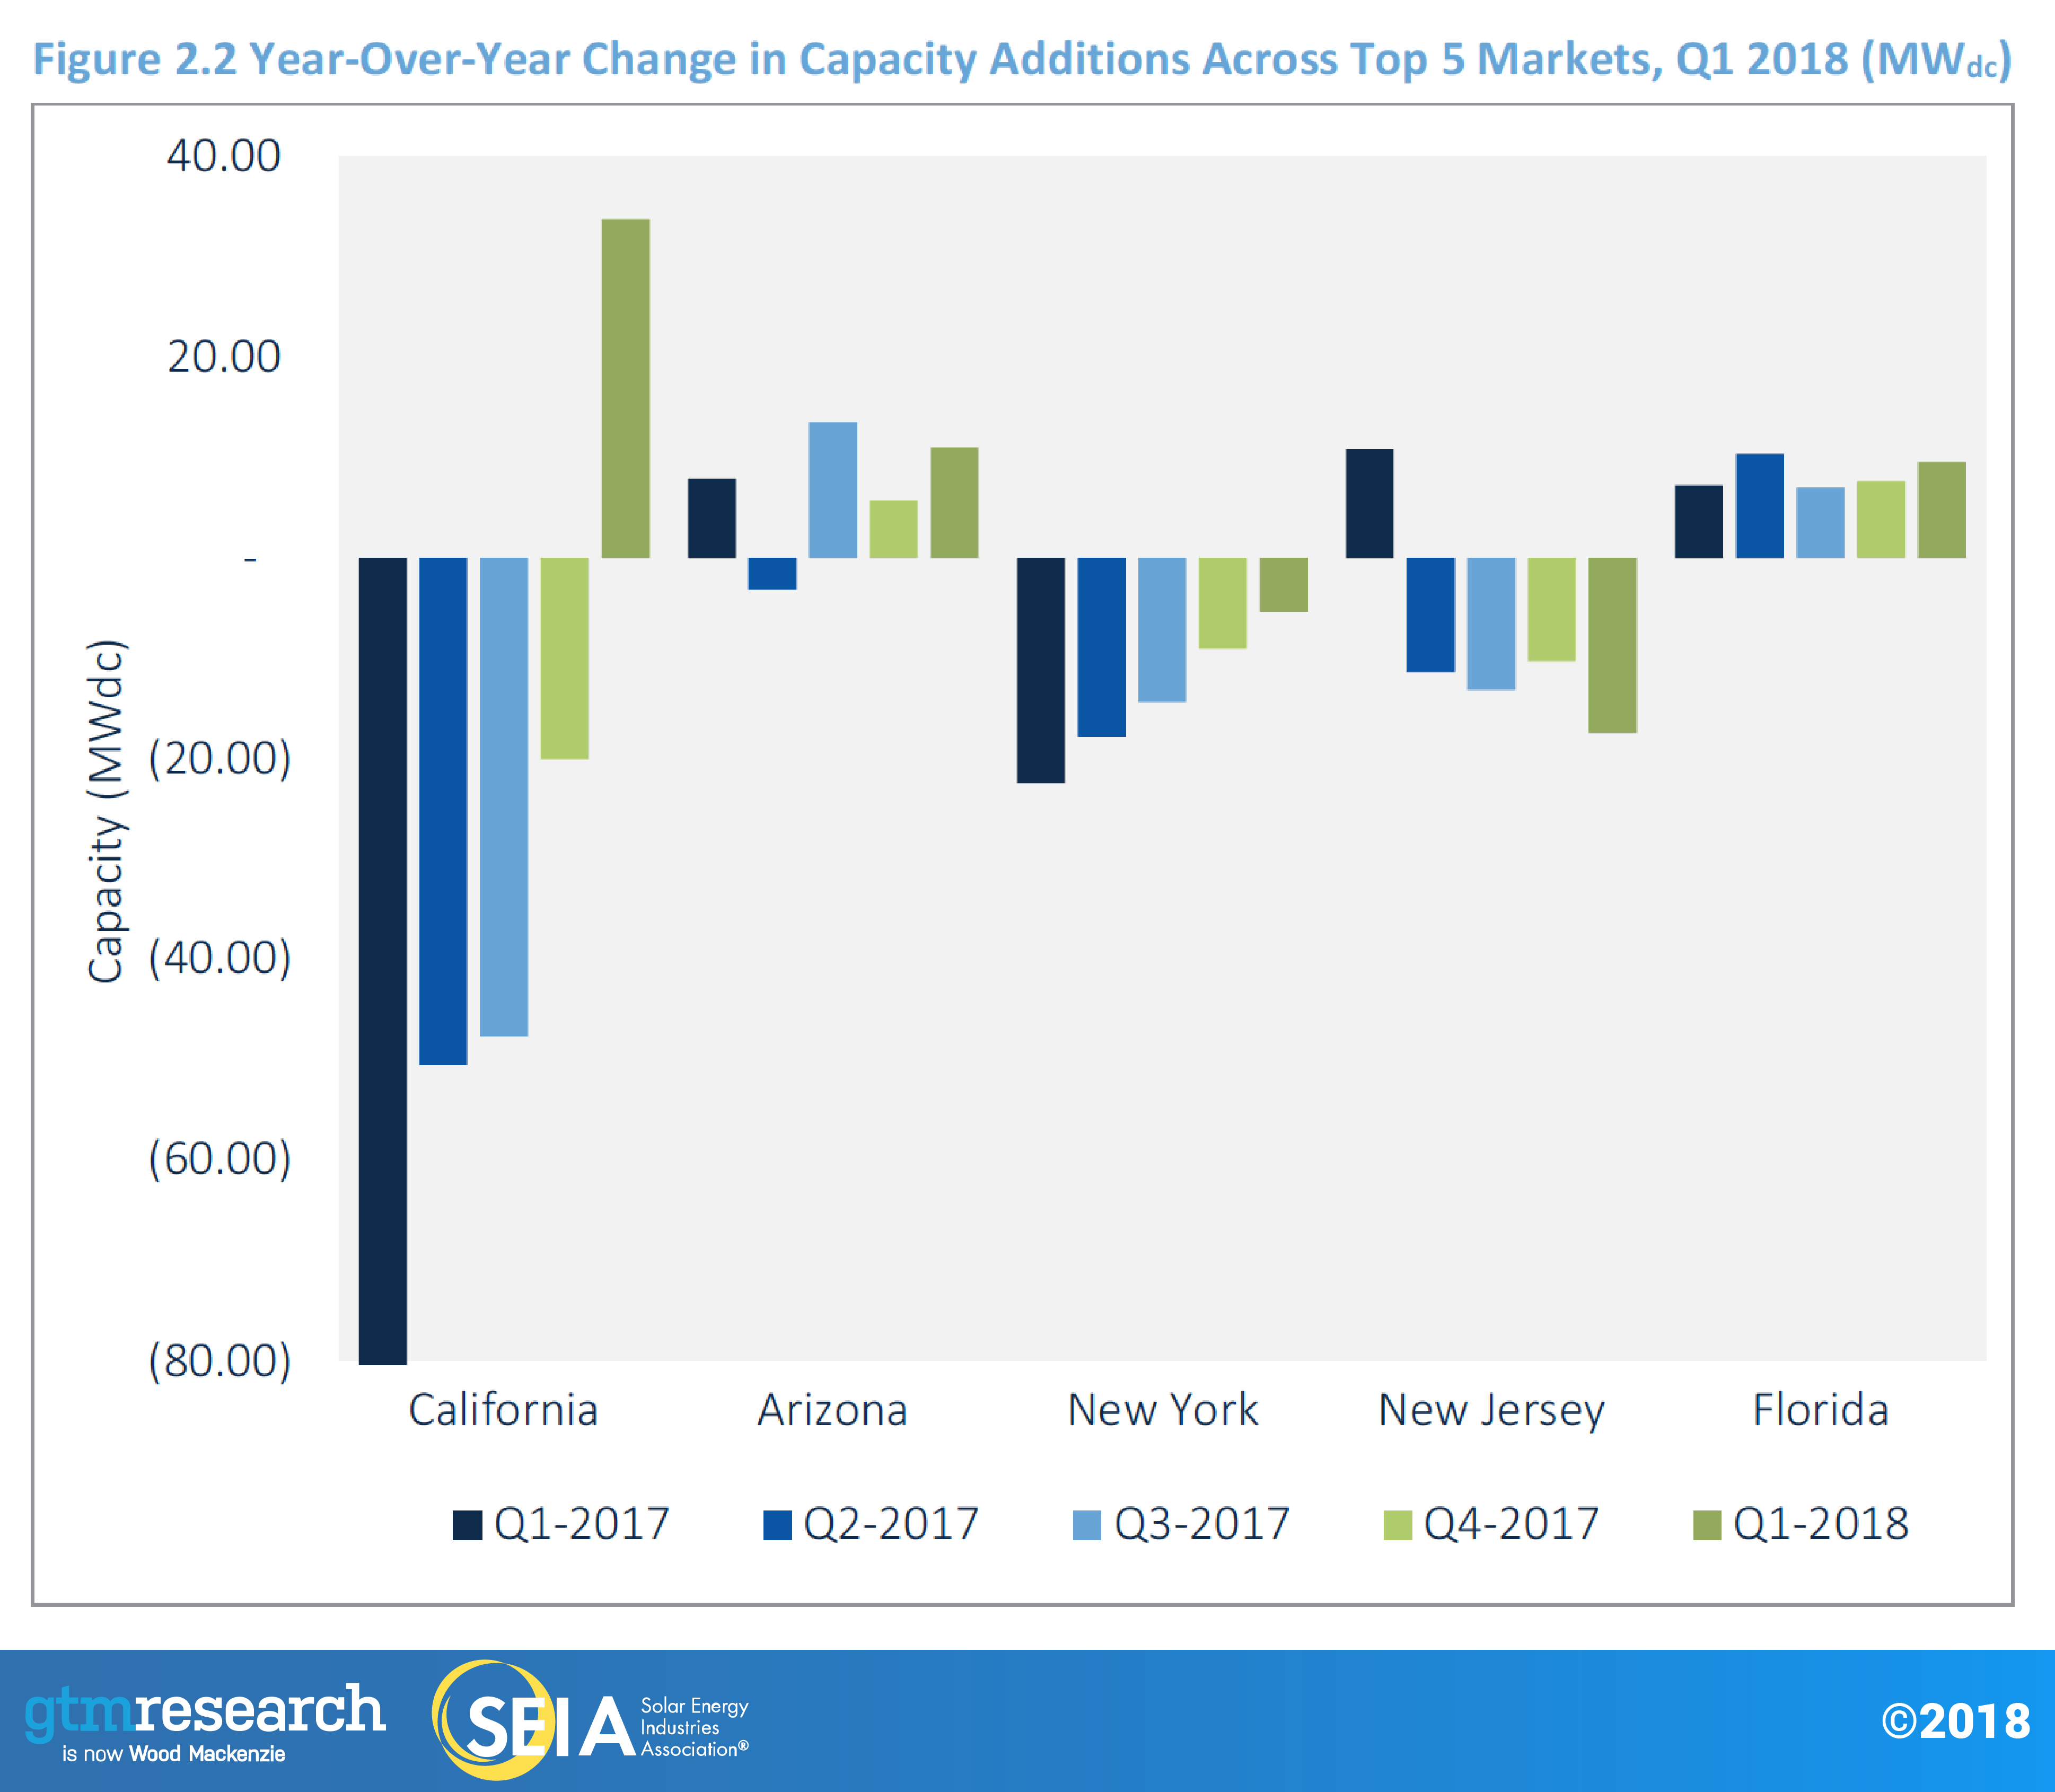
But despite flat growth in Q1 2018, major markets are still exhibiting signs of weakness, as seven of the top 10 state markets fell year-over-year as the lingering effects of national installer pullback still had clear impacts on the market. That said, Arizona stands out as a state that has yet to see quarterly contraction, as sales under a lower bill-credit mechanism appear to be strong. Meanwhile, emerging state markets, such as Nevada and Florida, continue to grow. Notably, Florida joins the ranks of the top five markets for quarterly installations for the first time in Q1 2018. Florida’s status as a growing market will only continue since the state’s Public Service Commission recently confirmed that residential solar lease providers, most prominently Sunrun, are permitted to offer solar leasing in the state.
2.1.2. Non-Residential PV
Key Figures
- 509 MWdc installed in Q1 2018
- Up 23% from Q1 2017
- Down 34% from Q4 2017
Coming off its largest quarter ever in Q4 2017, the non-residential segment naturally saw some slight seasonal downturn. Nevertheless, the sector did display significant year-over-year growth as regulatory demand pull-in and community solar continued to contribute to strong quarterly showings for non-residential PV. California benefited from developers rushing to install projects to meet a (since-lifted) end-of-the-year deadline to be grandfathered into more favorable, solar-friendly “time-of-use” net metering policies, which spilled over into Q1. Meanwhile, the build-out of Xcel Energy’s robust community solar pipeline continues to account for a significant share of non-residential growth, with Minnesota posting its second consecutive 100+ MW quarter in Q1 2018.
On the policy front, New Jersey’s governor signed a bill to accelerate the state’s renewable portfolio standard, which will bring relief to the solar renewable energy credit (SREC) market beginning in 2019, while also signing into law a new community solar program – both of which serve to increase our non-residential forecasts.
2.1.3. Utility PV
Key Figures
- 1,406 MWdc installed in Q1 2018
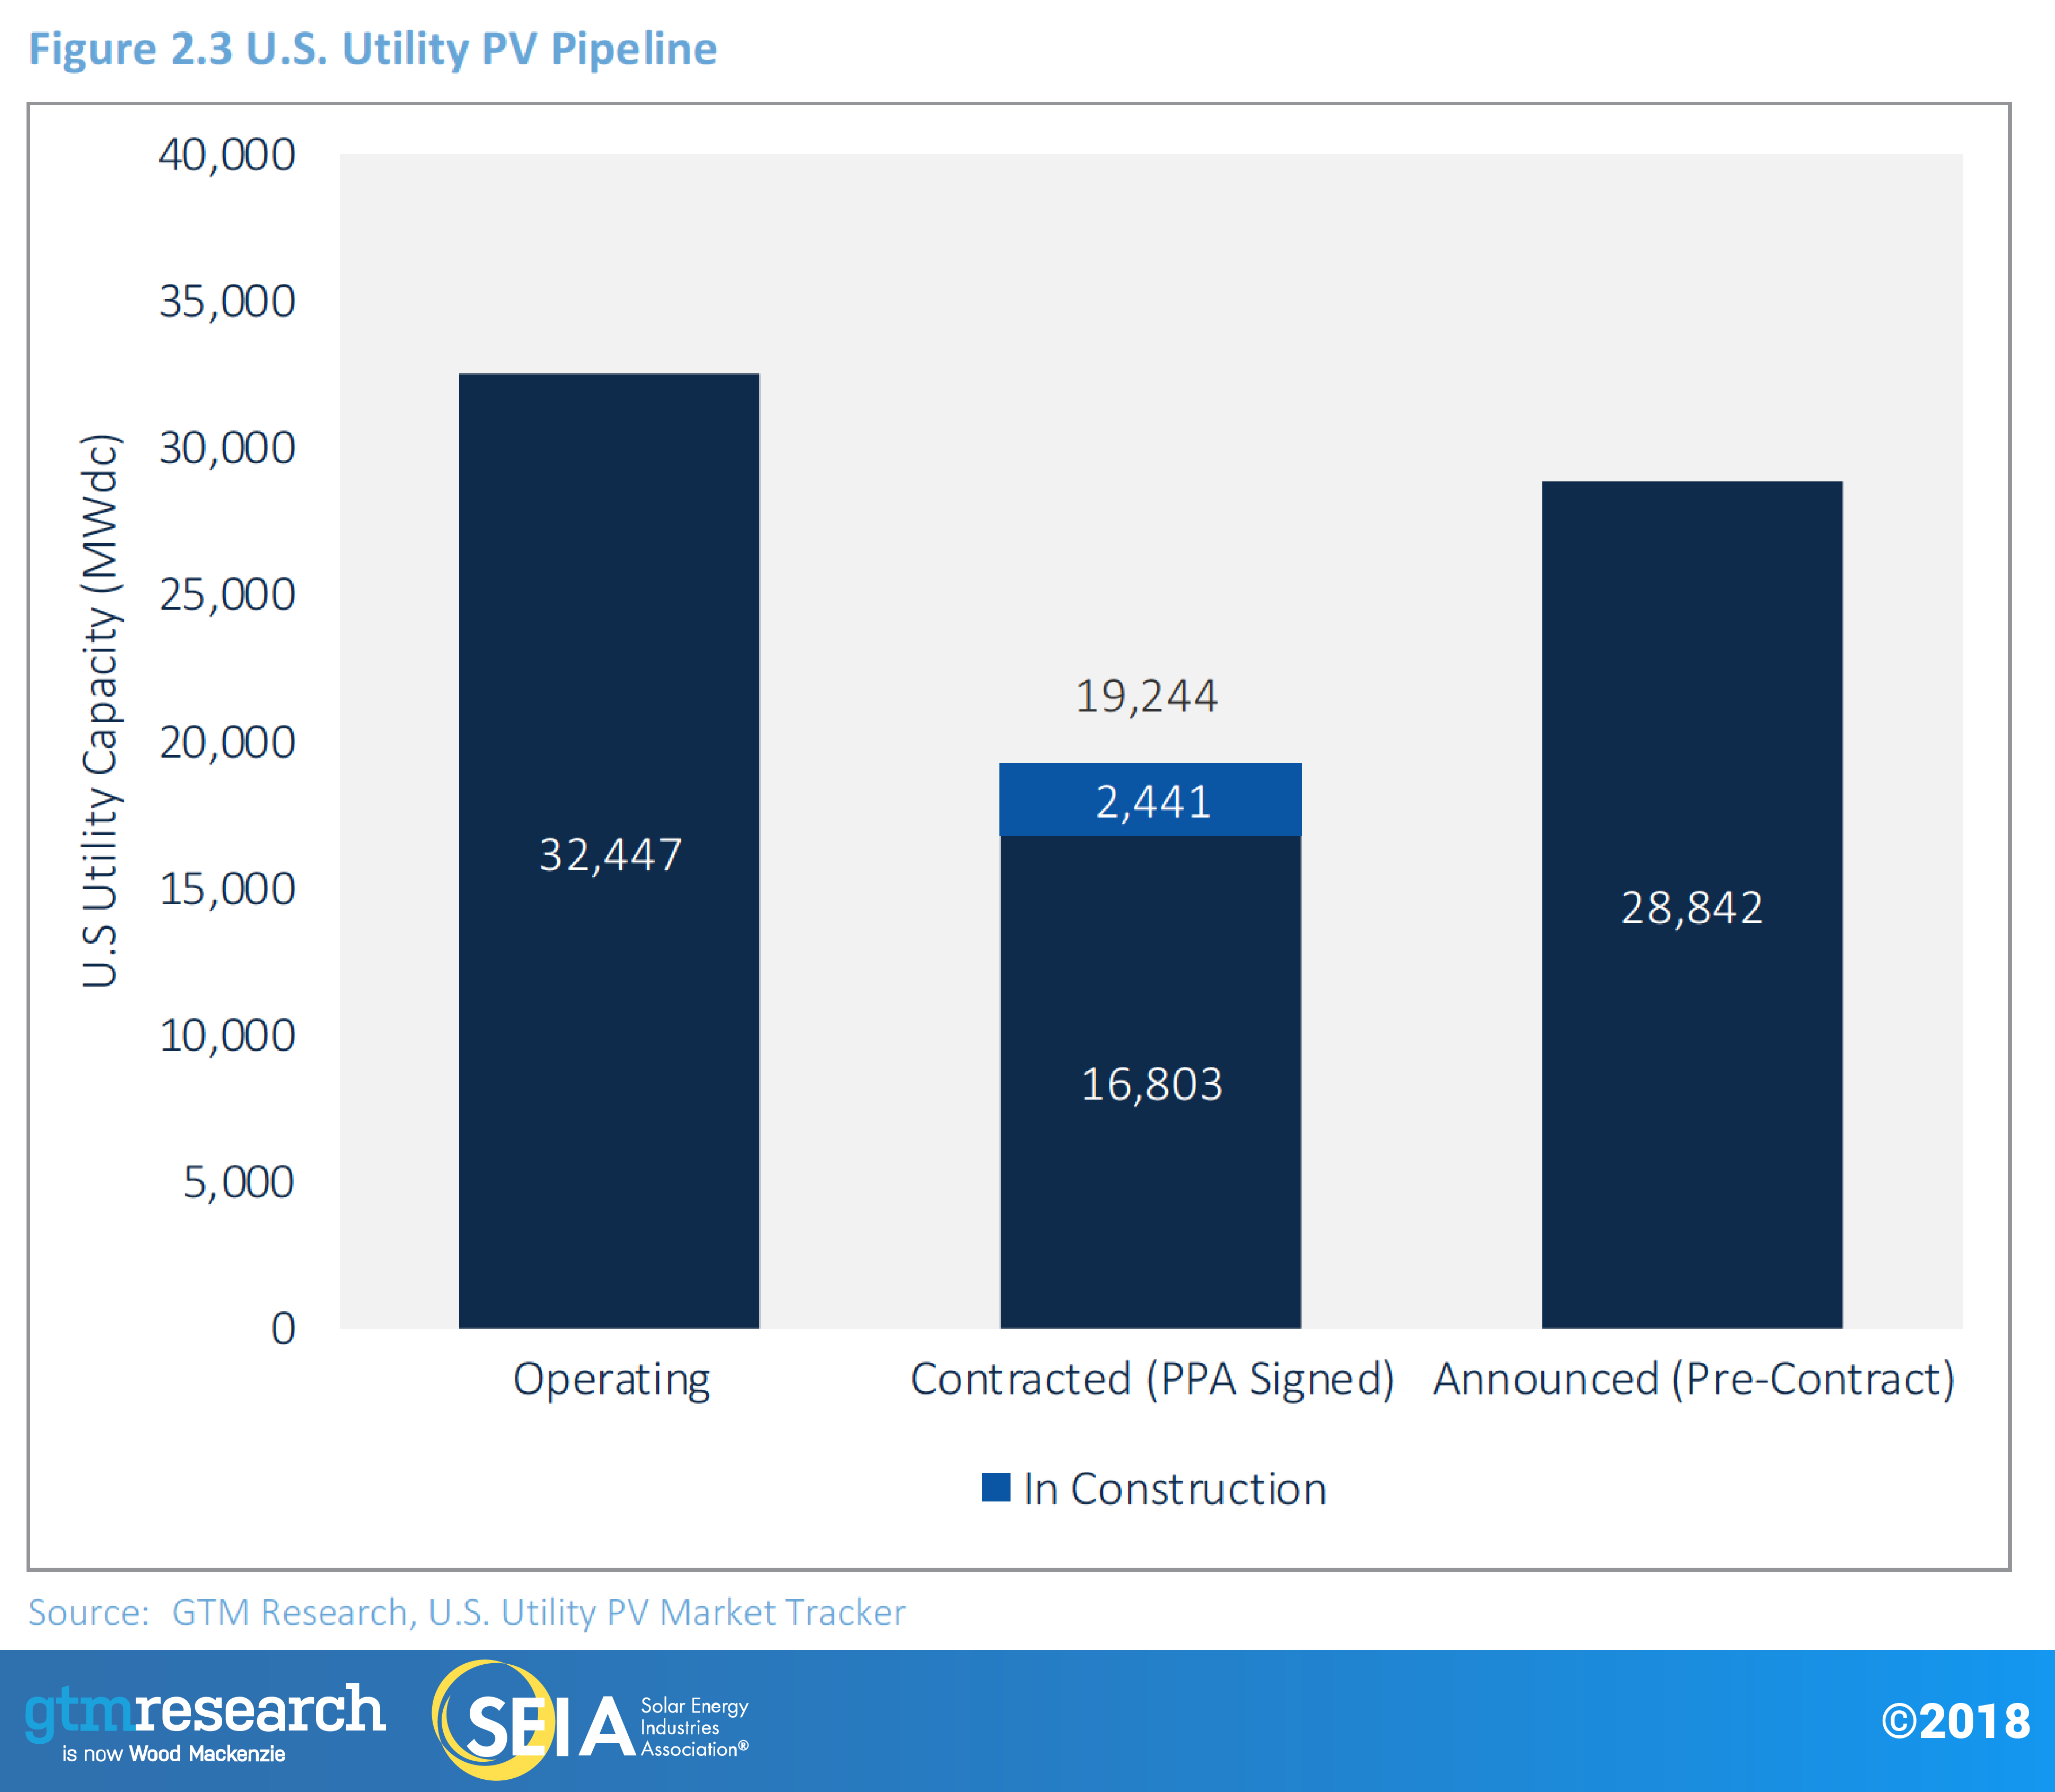
- Contracted utility PV pipeline currently totals 19.2 GWdc
- 10th consecutive quarter in which utility PV added over 1 GWdc
Utility PV continues to be the largest share of annual installations in the U.S. solar market. 1.4 GWdc came online in Q1 2018, accounting for 54% of U.S. capacity installed this quarter. A total of 1.9 GWdc of projects are under construction and targeting 2018 completion. With Q1 2018 being the 10th consecutive quarter with over 1.0 GWdc installed, GTM believes that despite the cell and module tariffs put in place, we will continue to see growth in the utility solar market, albeit at a slower rate than what would be seen without the Section 201 tariffs.
With the conclusion of the Section 201 trade case bringing policy certainty for developers, procurement is picking up. The 2018 utility PV forecast has increased slightly to 6.6 GWdc. With 21% of expected 2018 capacity online in Q1 and better visibility into developer pipelines, there is more confidence in projects that are expected to come online this year.
While securing some tariff-free modules has provided relative insulation for 2018 projects, developers are still facing the prospect of higher module costs over the long term. GTM’s 2019 forecast has decreased by 600 MWdc due to project and RFP delays because of the tariffs. For existing projects that did not factor in tariffs, several developers have reported that they are still trying to renegotiate PPA prices with the utility offtaker. Consequently, we expect to hear of project cancellations in H2 2018.
As procurement picks up for new projects, both developers and offtakers are targeting 2020 and 2021 completion dates so that projects are able to secure the 30% ITC in 2019 using the law’s commence-construction provision, but can still purchase modules at a lower tariff rate in 2020 or 2021. GTM’s 2019 forecast has fallen to 7.0 GW, while the 2020 and 2021 forecast each sit at 8.1 GW. Investor-owned utilities (IOUs) like Duke Energy in North Carolina and Florida Power & Light have outlined consistent annual procurement targets that will drive the bulk of capacity additions during this time. Despite module tariffs, most large IOUs have not deviated from their solar procurement plans. In smaller emerging markets like Oklahoma, Wyoming and Kentucky, module tariffs made utility PV less economically competitive with wind, combined cycle and gas, and these states are consequently less likely to see capacity additions from 2020 to 2023.
Long term, GTM’s 2022 and 2023 forecasts have dropped to 7.8 GWdc and 8.1 GWdc, respectively, resulting in a relatively flat market from 2020-2023. The long-term procurement plans of IOUs and the economic competitiveness of utility PV support steady capacity additions in 2022 and 2023. The bulk of 2022 capacity additions will come from developers leveraging the 22%+ ITC before it steps down to 10%. Additionally, corporate procurement of utility PV now represents 10% of projects in development and will continue to drive new project development through 2022 as companies try to acquire renewable energy PPAs before the ITC steps down. Levelized cost of energy (LCOE) analysis of generation resources by GTM Research and Wood Makenzie shows that the LCOE of utility PV will be less than that of onshore wind in at least 30 state markets by 2023, resulting in more utilities turning to solar over wind for renewables generation.
2.2. National Solar PV System Pricing
We employ a bottom-up modeling methodology to track and report national average PV system pricing for the major market segments. Our bottom-up methodology is based on tracked wholesale pricing of major solar components and data collected from interviews with major installers.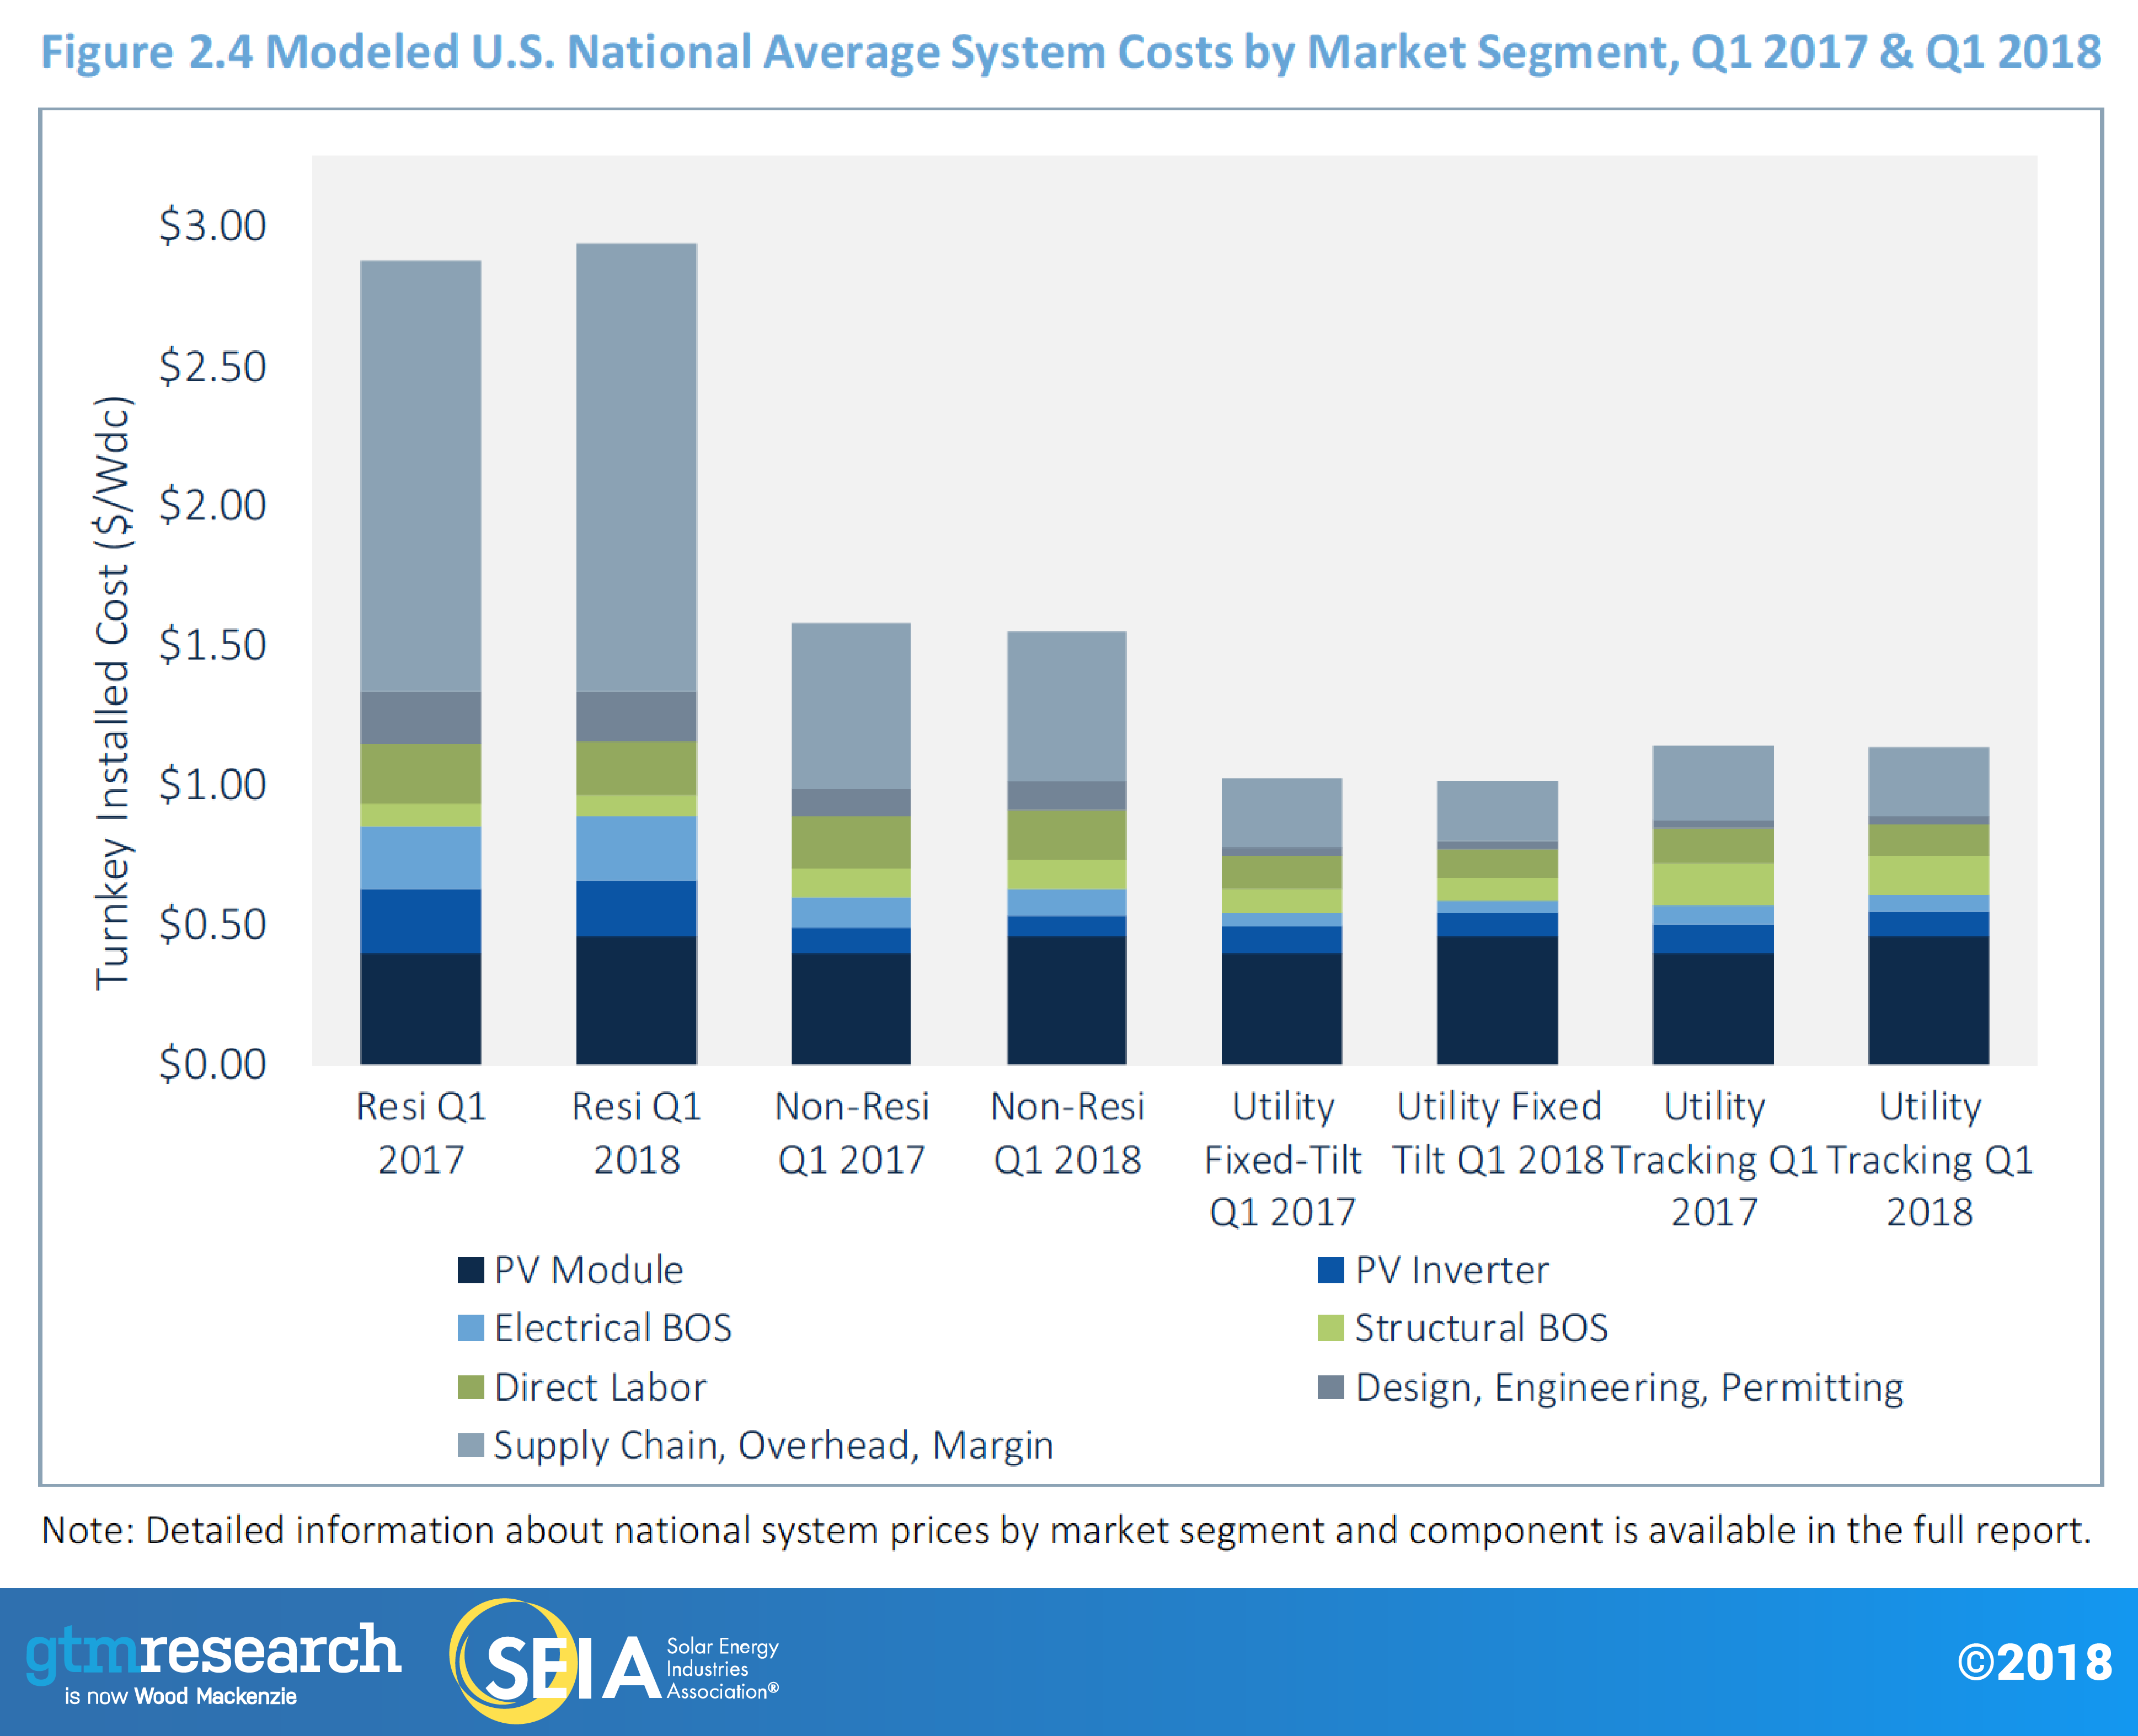 In Q1 2018, system pricing fell in all market segments besides residential. System pricing fell by 1%, 2% and 1.8% in the non-residential, utility fixed-tilt and utility single-axis tracking markets, respectively, while system pricing remained the same in the residential market. After two quarters of pricing increases across market segments, system pricing began to fall again. This quarter-over-quarter change in pricing was mostly spurred by the fall in module prices. Once the Section 201 module tariffs were announced at levels below market expectations, market certainty helped to drive down module costs – uncertainty during H2 2017 had led to substantial price premiums. Additionally, low procurement during Q1 2018 contributed to price declines compared to Q4 2017. These factors outweighed the actual module tariffs, resulting in lower module pricing in Q1 2018.
The stagnation of system pricing in the residential market can be attributed to rising customer acquisition costs. We have seen customer acquisition costs steadily increase over the past four quarters, causing system pricing to rise in some quarters or producing a net-zero change in overall system pricing.
Much of the market was in stasis in Q1 2018. Stakeholders throughout the value chain were waiting to see what the impact of the Section 201 trade case would be before changing course on pricing, technology selection, procurement strategies, construction management techniques or internal operations.
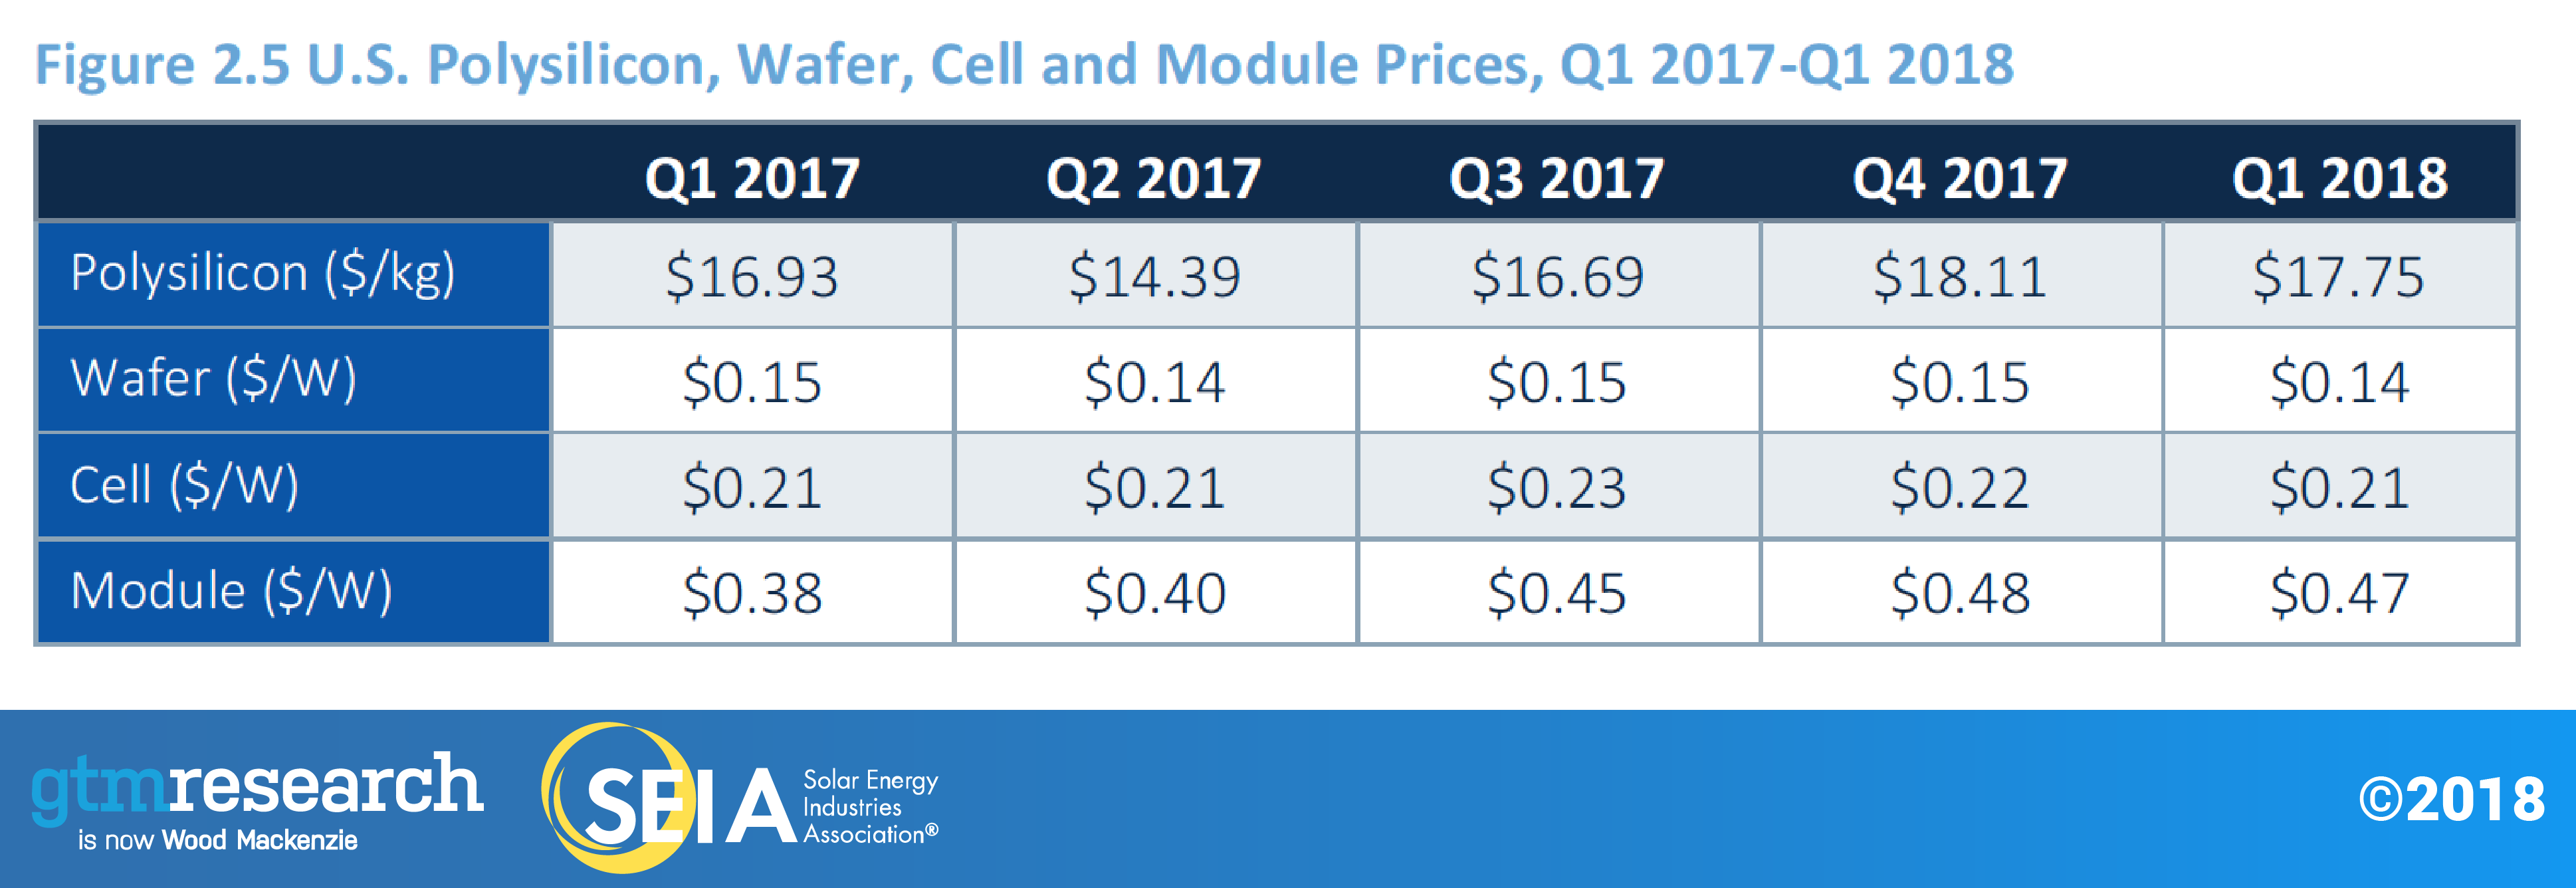
2.3. Component Pricing
Component price fell in Q1 2018, with global demand weakening and buyers pressuring suppliers to reduce prices in every part of the value chain.
- For polysilicon, the quarterly average price fell 2% quarter-over-quarter to $17.8/kg in Q1 2018. Polysilicon prices fell as downstream demand declined, as well as in response to buyer pressure. With wafer and cell margins tight, buyers demanded that polysilicon suppliers reduce high prices.
- Multi wafer and cell price declines were more aggressive, with quarterly average prices hitting a respective $0.14/W to $0.21/W. Price trends were driven by low demand and high inventory levels.
- In 2017, module prices in the U.S. were driven by supply-demand tightness, with the U.S. leaning toward being a seller’s market before the results of the Section 201 case were released. As the market waited for the release of tariff rates from the case in February 2018, multi module prices were stable-to-down, averaging $0.47/W in Q1 2018. Looking at module prices as of May, we continue to see a downward trend with the uncertainty of final tariff rates removed and buyer inventory buildup no longer driving tightness.
 2.4. Market Outlook
GTM Research forecasts U.S. solar to be essentially flat in 2018. With nearly two-thirds of the 2018 utility PV pipeline consisting of relatively less price-sensitive renewable portfolio standard projects and projects currently in construction that secured tariff-free modules (either crystalline-silicon PV delivered before the tariffs went into effect or non-subject thin-film or domestically produced modules), tariff impacts on 2018 will be somewhat mitigated. The non-residential market will fall as a pipeline of projects grandfathered in under a more favorable policy and incentive environment wanes in 2018. Residential PV is expected to be flat given lingering weakness in major markets, which will lead to these markets seeing flat growth or contraction this year.
In the medium term, more price-sensitive procurement drivers such as PURPA and voluntary procurement by utilities (i.e., projects made viable due to their economic competitiveness) will not pencil out under increased price assumptions due to the Section 201 module tariffs. The utility segment is still expected to grow 5% in 2019, but growth will be relatively flat from 2021-2022 as the declining module tariffs delay projects that were initially slated for completion in 2020-2021. Going forward, utility PV will continue to be driven by procurement outside renewable portfolio standards, with more than 75% of the current pipeline coming from voluntary procurement, PURPA, offsite corporate procurement, and California-based community-choice aggregators.
For residential PV, the widespread customer-acquisition issues in major state markets that afflicted the segment in 2017 are only exacerbated in an increased pricing environment. This is especially true for large national installers scaling back expensive sales channels and transitioning to lower-cost customer-acquisition strategies in pursuit of profitability. These challenges are expected to continue in the near term for large national installers, though 2018 is expected to represent the bottoming out of this trend as more local installers grow to capture larger shares of the market.
Flat growth forecasted for 2018 allows for a more robust rebound in 2019 as the market aligns to the growth expectations of small and medium-sized installers leveraging less expensive customer-acquisition channels. Growth rates exceeding 10% are expected to resume in the early 2020s, in part bolstered by the California mandate for all new residential housing to include rooftop solar, in addition to emerging markets beginning to account for a larger share of the residential segment, while ITC demand pull-in will boost growth in 2021 ahead of its expiration in 2022.
Meanwhile, the non-residential PV market is expected to experience two consecutive down years as the grandfathered project pipeline wanes in 2018 and the market acclimates to a reduced incentive environment across major state markets in 2019. However, this will be incrementally offset starting in 2020 as the next wave of states with robust community solar mandates – New York, Maryland, Illinois – begin to see the realization of those pipelines. Solar-plus-storage viability will also begin to have an impact on non-residential demand.
By 2020, 28 states in the U.S. are expected to be 100+ MWdc annual solar markets, with 25 of those states being home to more than 1 GWdc of operating solar PV. This compares to only two states with 100+ MWdc annual solar markets in 2010.
Forecast details by state (45 states plus Washington, D.C.) and market segment through 2023 are available in the full report.
Acknowledgments
U.S. Solar Market Insight® is a quarterly publication of Wood Mackenzie, Limited, and the Solar Energy Industries Association (SEIA)®. Each quarter, we collect granular data on the U.S. solar market from nearly 200 utilities, state agencies, installers and manufacturers. This data provides the backbone of this U.S. Solar Market Insight® report, in which we identify and analyze trends in U.S. solar demand, manufacturing and pricing by state and market segment. We also use this analysis to look forward and forecast demand over the next five years. All forecasts are from Wood Mackenzie, Limited; SEIA does not predict future pricing, bid terms, costs, deployment or supply.
- References, data, charts and analysis from this executive summary should be attributed to “Wood Mackenzie, Limited/SEIA U.S. Solar Market Insight®.”
- Media inquiries should be directed to Mike Munsell ([email protected]) at GTM Research and Morgan Lyons ([email protected]) at SEIA.
- All figures are sourced from Wood Mackenzie, Limited. For more detail on methodology and sources, visit www.gtmresearch.com/solarinsight.
- GTM Research partners with Clean Power Research to acquire project-level datasets from participating utilities that utilize the PowerClerk product platform. For more information on Clean Power Research’s product offerings, visit www.cleanpower.com.
Our coverage in the U.S. Solar Market Insight reports includes 43 individual states and Washington, D.C. However, the national totals reported include all 50 states, Washington, D.C., and Puerto Rico.
Detailed data and forecasts for 43 states and Washington, D.C. are contained within the full version of this report, available at www.greentechmedia.com/research/ussmi.
Author’s Note: Revision to U.S. Solar Market Insight report title
GTM Research and SEIA have changed the naming convention for the U.S. Solar Market Insight report series. Starting with the report released in June 2016 onward, the report title will reference the quarter in which the report is released, as opposed to the most recent quarter in which installation figures are tracked. The exception will be our Year in Review publication, which covers the preceding year’s installation volumes despite being released during the first quarter of the current year.