Solar Industry Research Data
Solar Industry Growing at a Record Pace
Solar energy in the United States is booming. Along with our partners at Wood Mackenzie Power & Renewables, SEIA tracks trends and trajectories in the solar industry that demonstrate the diverse and sustained growth of solar across the country.
Below you will find charts and information summarizing the state of solar in the U.S. If you're looking for more data, explore our resources page. In addition, SEIA Members have access to presentation slide decks that contain this data and much more. Not a SEIA Member? Join today!
Massive Growth Since 2000 Sets the Stage for the Solar+ Decade
In the last decade alone, solar has experienced an average annual growth rate of 22%. Thanks to strong federal policies like the solar Investment Tax Credit, rapidly declining costs, and increasing demand across the private and public sector for clean electricity, there are now more than 179 gigawatts (GW) of solar capacity installed nationwide, enough to power nearly 33 million homes.
Solar as an Economic Engine
As of 2022, more than 263,000 Americans work in solar at more than 10,000 companies in every U.S. state. In 2023, the solar industry generated nearly $51 billion of private investment in the American economy.
Growth in Solar is Led by Falling Prices
The cost to install solar has dropped by more than 40% over the last decade, leading the industry to expand into new markets and deploy thousands of systems nationwide. An average-sized residential system has dropped from a pre-incentive price of $40,000 in 2010 to roughly $25,000 today, while recent utility-scale prices range from $16/MWh - $35/MWh, competitive with all other forms of generation.
Inflation, Supply Chain Constraints Lead to Price Increases
However, the last 3 years have been volatile for solar pricing. Inflation and supply chain challenges stemming from the global pandemic and trade instability contributed to price increases. As more modules have been able to enter the U.S., and as domestic manufacturing capacity begins to come online, modules have become more widely available, putting downward pressure on prices. This came to a head in Q4 2023, as module oversupply sent module prices tumbling by 25 – 35% in the distributed segments, contributing to significant annual and quarterly declines in total system price.
Solar's Share of New Capacity has Grown Rapidly
Solar has added the most generating capacity to the grid each of the last five years. 53% of all new electric capacity added to the grid in 2023 came from solar, marking the first time in 80 years a renewable energy resource has captured a majority of new capacity added. Solar’s increasing competitiveness against other technologies has allowed it to quickly increase its share of total U.S. electrical generation - from just 0.1% in 2010 to over 5% today.
The U.S Solar Industry is a 50-State Market
While California has traditionally dominated the U.S. solar market, other markets are continuing to expand rapidly. States like Texas, Florida, and Ohio all saw major growth in 2023. In addition, now half of U.S. states have installed 1 GW or more of solar, compared to only 3 a decade ago. As demand for solar continues to grow, new state entrants will grab an increasing share of the national market.
Prices Decline for Rooftop Solar, but Higher Soft Costs Remain
Residential price increases are not only driven by supply constraints leading to higher module and other hardware pricing, but also increasing soft costs, which include installation labor, customer acquisition, and permitting/inspection/interconnection. For much of the 2010s, soft cost declines were unable to keep up with rapidly dropping hardware prices. More recently, instability in hardware pricing has been accompanied by rising labor and customer acquisition costs, pushing the soft cost share to its highest point in years. U.S. solar soft costs continue to be much higher than those of other developed solar markets around the world. Through programs like Solar Automated Permit Processing (SolarAPP) and SolSmart, SEIA and our partners are working to reduce local barriers to going solar.
Storage is Increasingly Paired with All Forms of Solar
Homeowners and businesses are increasingly demanding solar systems that are paired with battery storage. While this pairing is still relatively new, the growth over the next five years is expected to be significant. By 2028, 28% of all new distributed solar capacity will be paired with storage, compared to under 12% in 2023. The utility-scale market is also recognizing the benefits of pairing solar with storage, with 3 GW of new storage systems deployed alongside solar in 2023, more than double the capacity deployed in 2022.
Residential Market Continues to Diversify
Nearly 7 GW of residential solar were installed in 2023, marking the 5th consecutive record year for the segment. High household electricity bills and power outages have driven demand, as have changes to California’s Net Metering rules. Customers in California rushed to sign up for projects under the old, more favorable rules before they expired in Spring 2023, and build out of that pipeline propped up national installation volumes in 2023. In 2024 however, the buildout of the California queue coupled with higher financing costs nationally will lead to an overall contraction in the residential market, despite modest growth in non-California markets.
IRA to Help Drive Emerging Commercial Markets
The commercial solar market, which consists of on-site solar installations for businesses, non-profits and governments, has historically been dominated by a handful of markets: California, Massachusetts, New Jersey and New York. Because of their outsized portion of the market, policy and incentive changes in any of those states could rattle the market and stymie national growth. However, the IRA, through provisions on transferability, direct pay, and the various adder credits, will lead to growth in emerging commercial markets.
Community Solar Expansion
While early growth for community solar installations was led primarily by three key markets – New York, Minnesota, and Massachusetts – a growing list of states with community solar programs have helped diversify the market. Maine and Illinois continued build out of extensive community solar pipelines in 2023, while markets in Maryland and New Jersey saw large improvements from 2022. As more states and utilities create and expand community solar programs, access to solar will expand to all types of households and businesses.
Utility-Scale Segment Rebounds from Supply Challenges
Supply chain challenges stemming from regulatory trade action stymied utility-scale installations in 2022. As module supply improved throughout 2023, many delayed projects were finally brought online, along with large portions of the previously existing 2023 pipeline. By year’s end, 22.5 GW of new utility-scale projects had been installed, representing a 77% improvement from 2022. While new project procurement was down in 2023 due primarily to elevated financing costs, large 2024 pipelines are likely to lead to another year of growth.
Solar PV Growth Forecast
After supply chain challenges slowed industry growth in 2022, improvements in module supply helped propel the industry to a record 32.4 GW of deployment in 2023. The total US solar fleet is expected to quadruple over the next decade to 673 GW, as the Inflation Reduction Act provides key tax incentives and long-term certainty that will spark demand for solar and storage and accelerate the transition to renewable energy.
Inflation Reduction Act Boosts Solar Outlook
The passage of the Inflation Reduction Act has drastically improved baseline projections for the solar industry over the next five years. In the next half decade, the long-term tax incentives and manufacturing provisions in the IRA provide the market certainty needed to boost expected solar deployment by 38% compared to pre-IRA projections. Still, the industry awaits guidance from the Biden Administration on key provisions of the law. The specifics of this guidance will have massive implications for the industry's ability to maximize the potential of the IRA, and could unlock further growth in years to come.
New Manufacturing to Secure Supply Chain
In addition to spurring massive deployment of solar energy, the IRA will bring about a renaissance of U.S. solar manufacturing. Since the beginning of 2022, more than 100 GW of solar module manufacturing capacity has been announced, along with dozens of facilities producing other components of the supply chain. This will be a boon for the industry, as it will increase supply chain reliability, create jobs, and spur investment in clean energy. In addition, massive investment in battery storage manufacturing has been announced, and these manufacturing facilities will ensure that the solar and storage industries have access to reliable, domestic supply for future growth.
More Aggressive Growth Needed to Reach Climate Goals
While projected growth over the next 10 years spurred by the IRA puts the solar market in reach of ambitious clean energy goals set by the industry and the Biden administration, more work is needed to achieve the pace required for a 100% clean energy electricity system. Annual installs will need to grow from less than 22 GW in 2022 to nearly 140 GW by 2030, with cumulative totals over 800 GW by the end of the decade. A combination of private sector innovation and stable, long-term public policy will set the solar industry on a path to achieving these more aggressive goals to address climate change and decarbonize the economy.
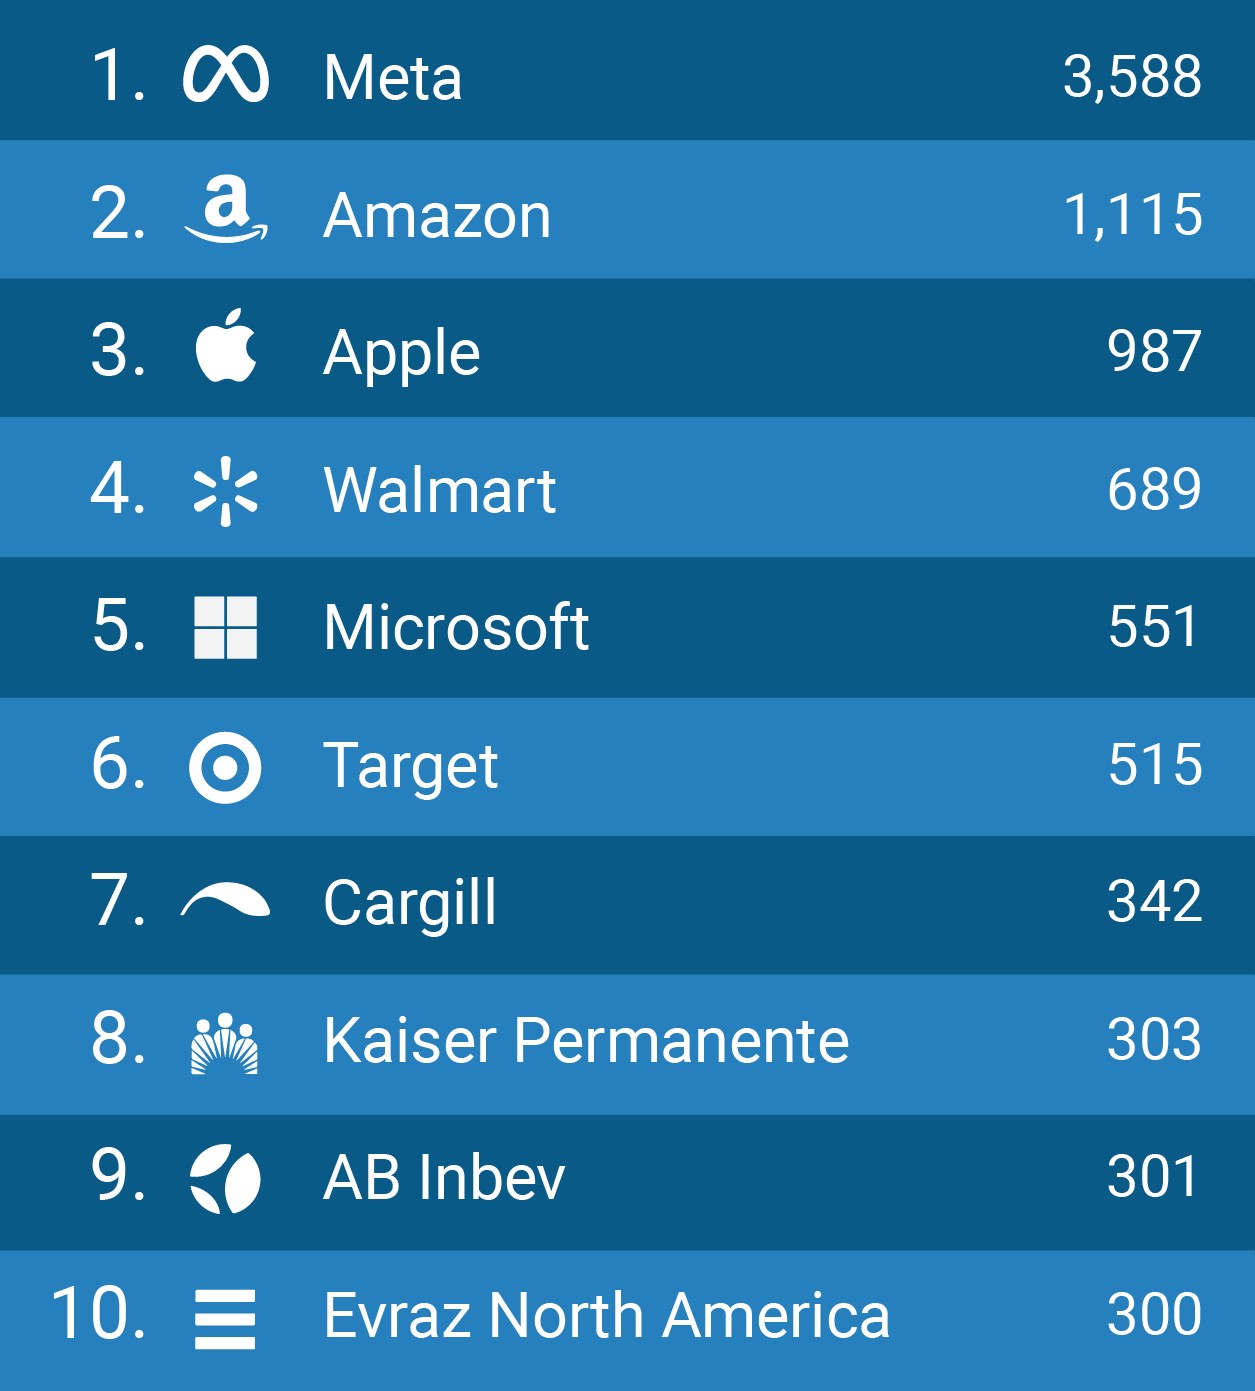
Solar Helps Fortune 500 Companies Save Money
Data from SEIA's annual Solar Means Business report show that major U.S. corporations, including Meta, Amazon, Apple, Walmart, and Microsoft are investing in solar and renewable energy at an incredible rate. Through June 30 2022, the top corporate solar users in America have installed almost 19 GW of capacity across nearly 50,000 different facilities across the country.
Other key takeaways:
- Corporate solar adoption has expanded rapidly over the past several years, with about half of all capacity installed since 2020.
- Off-site solar made up much of the growth in corporate solar, with 77% of capacity since 2020 being off-site.
- The systems tracked in this report generate enough electricity each year to power 3.2 million U.S. homes.
You can explore SEIA's Solar Means Business report, including interactive maps and data tools on the top corporate solar users in the U.S.