100 Solar Districts Maps
Share


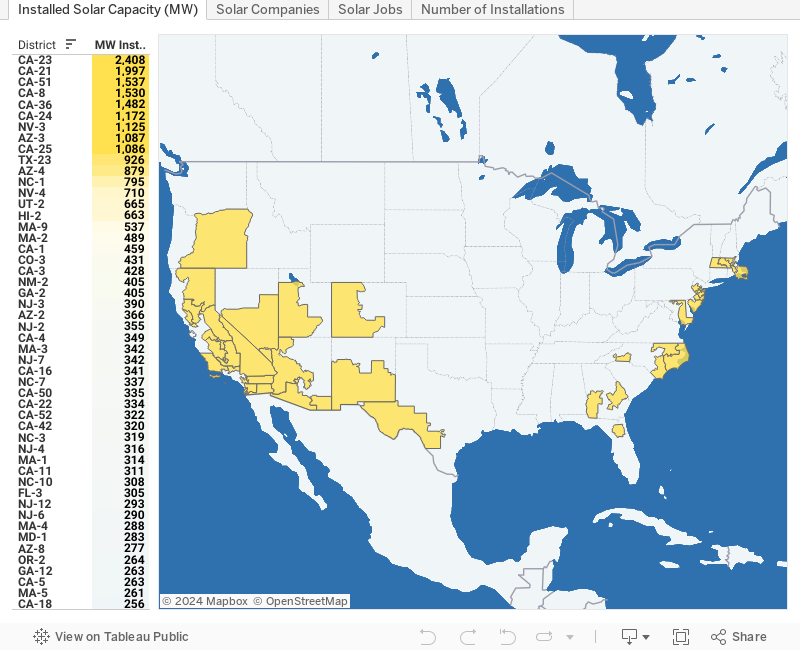
There are roughly 100 Congressional Districts that rank in the top 50 for the four main indicators of a strong solar market: installed capacity, companies in operation, number of jobs, and number of installations. Below you can explore the top 50 Congressional Districts for each of these categories.
Source Information
- Installed Capacity & Number of Installations: cumulative through July 2018. Estimated using NREL Open PV, EIA Form 861M, SEIA Major Solar Projects List and SEIA/GTM Research U.S. Solar Market Insight.
- Solar Companies: current through July 2018. SEIA National Solar Database.
- Solar Jobs: as of fall 2017. The Solar Foundation National Solar Jobs Census.
Resource Type
Browse Resources by Related Topics: